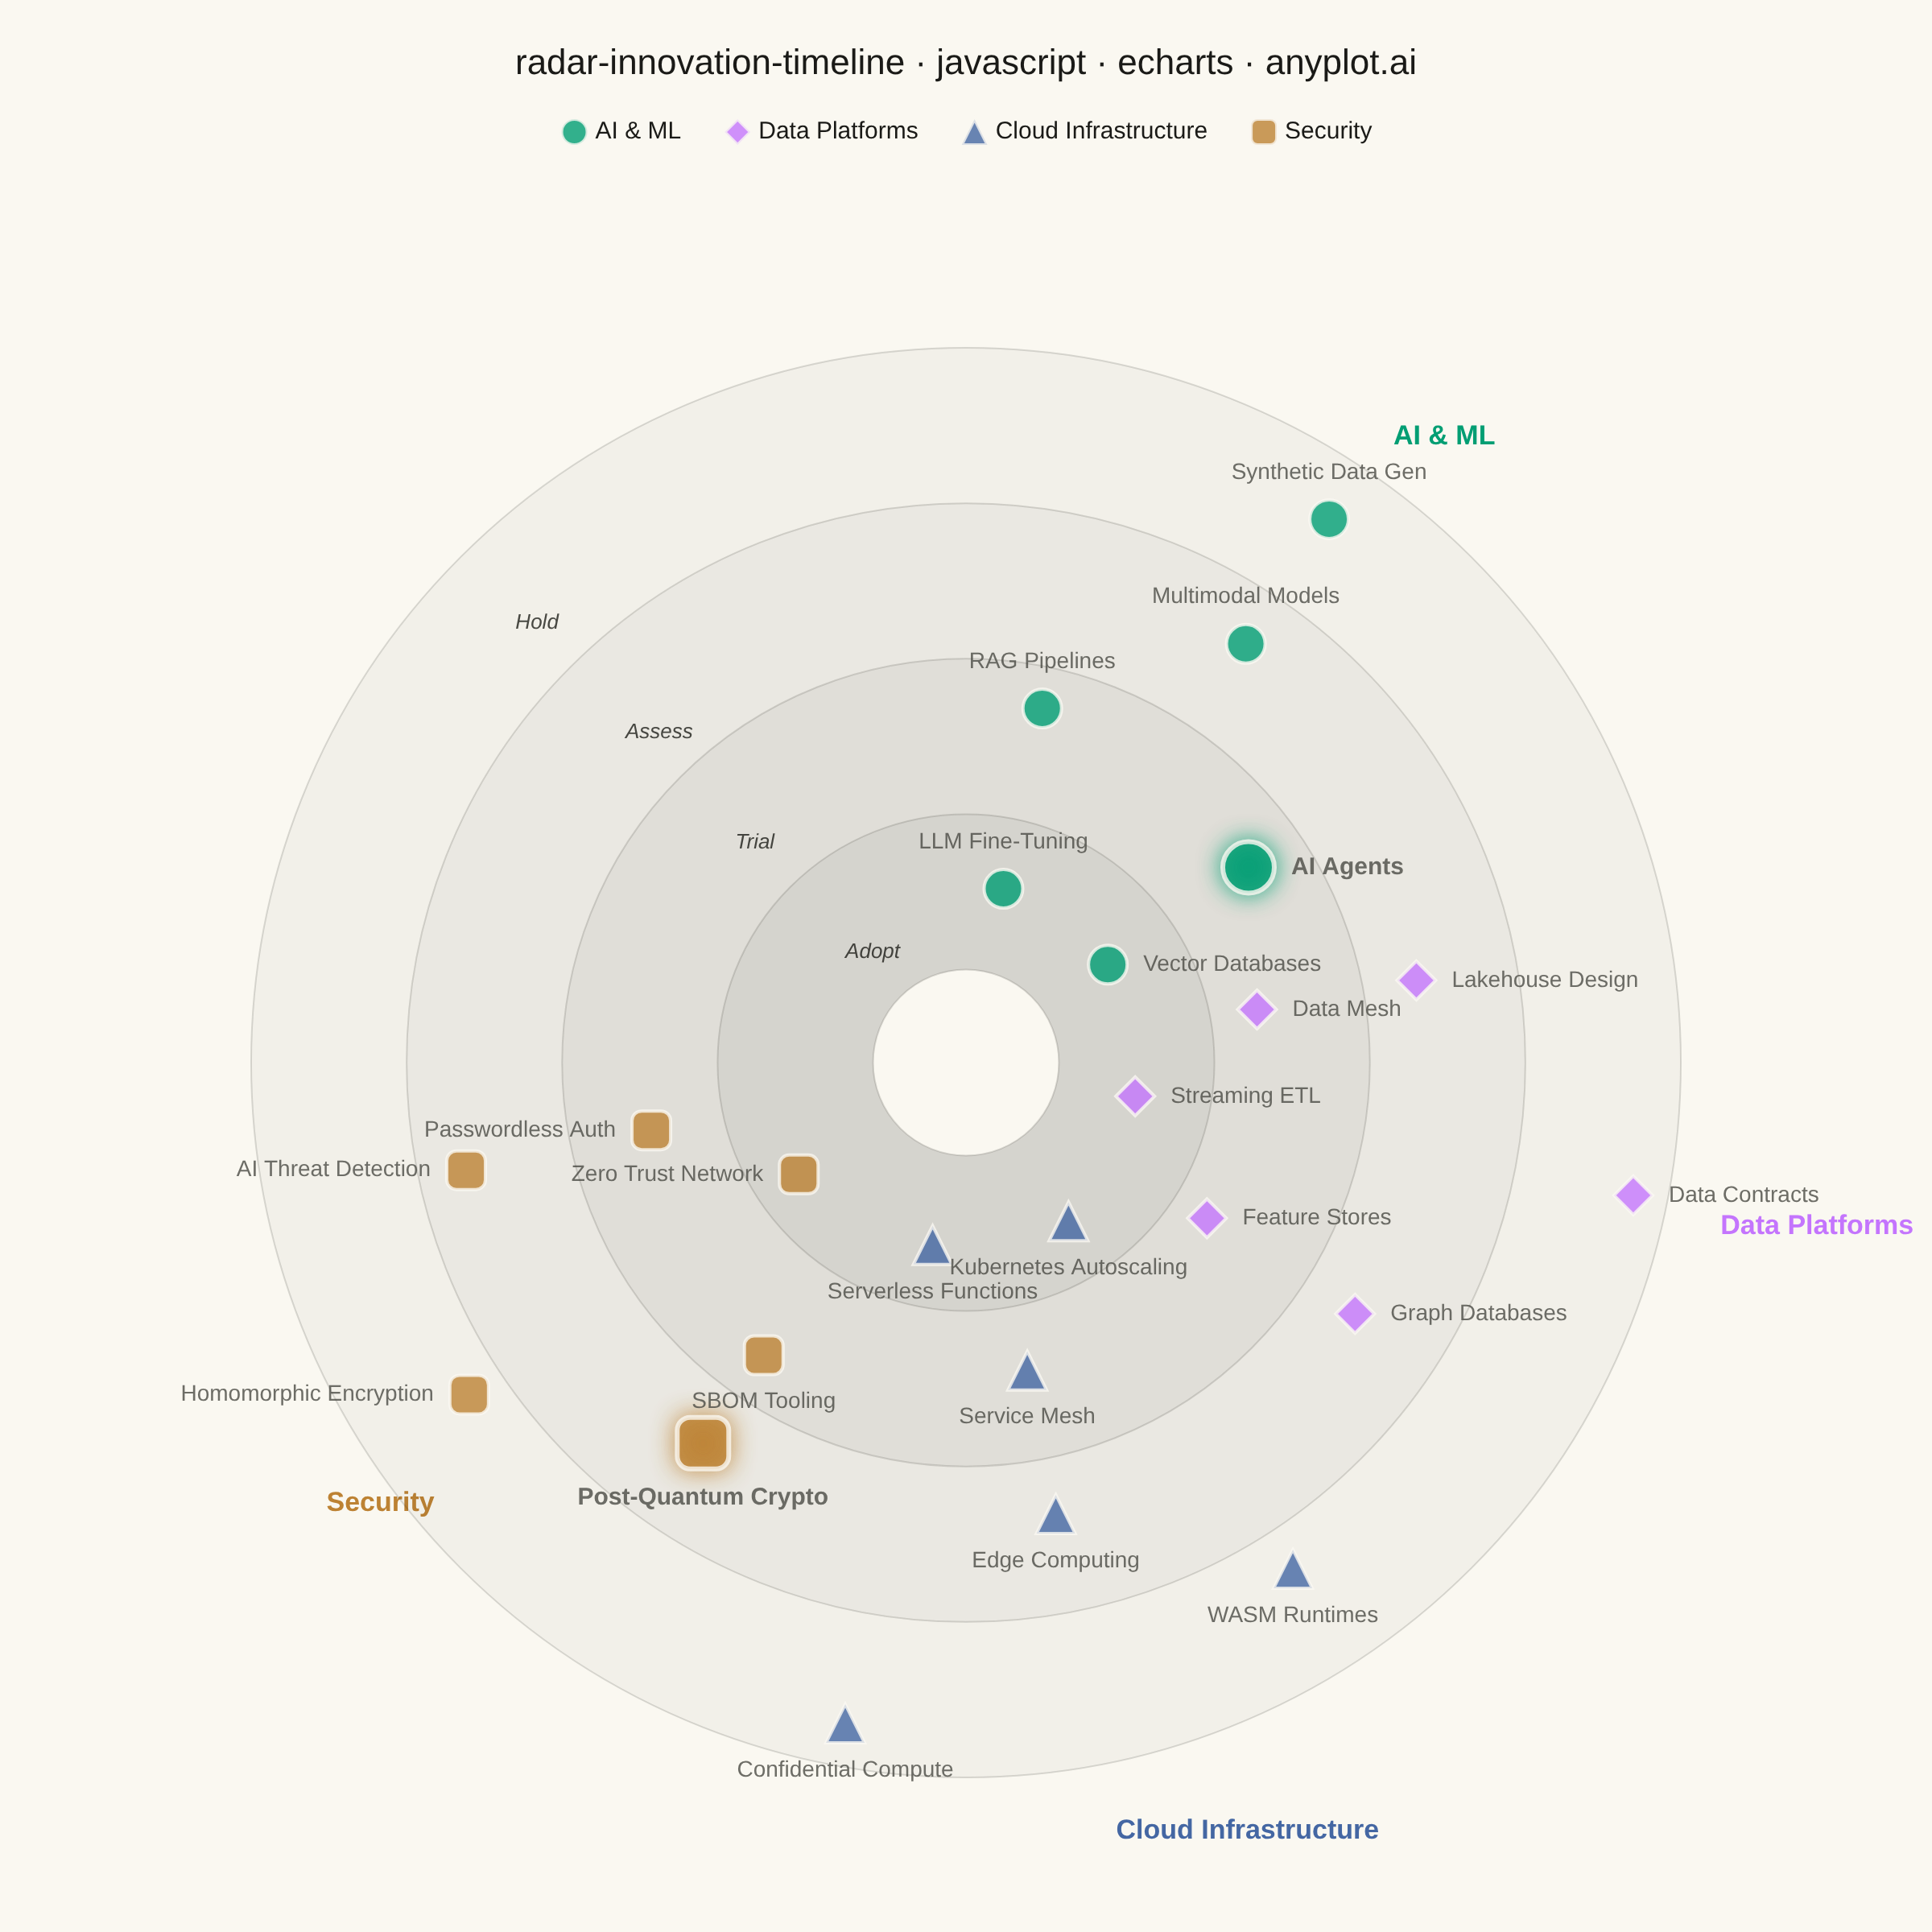
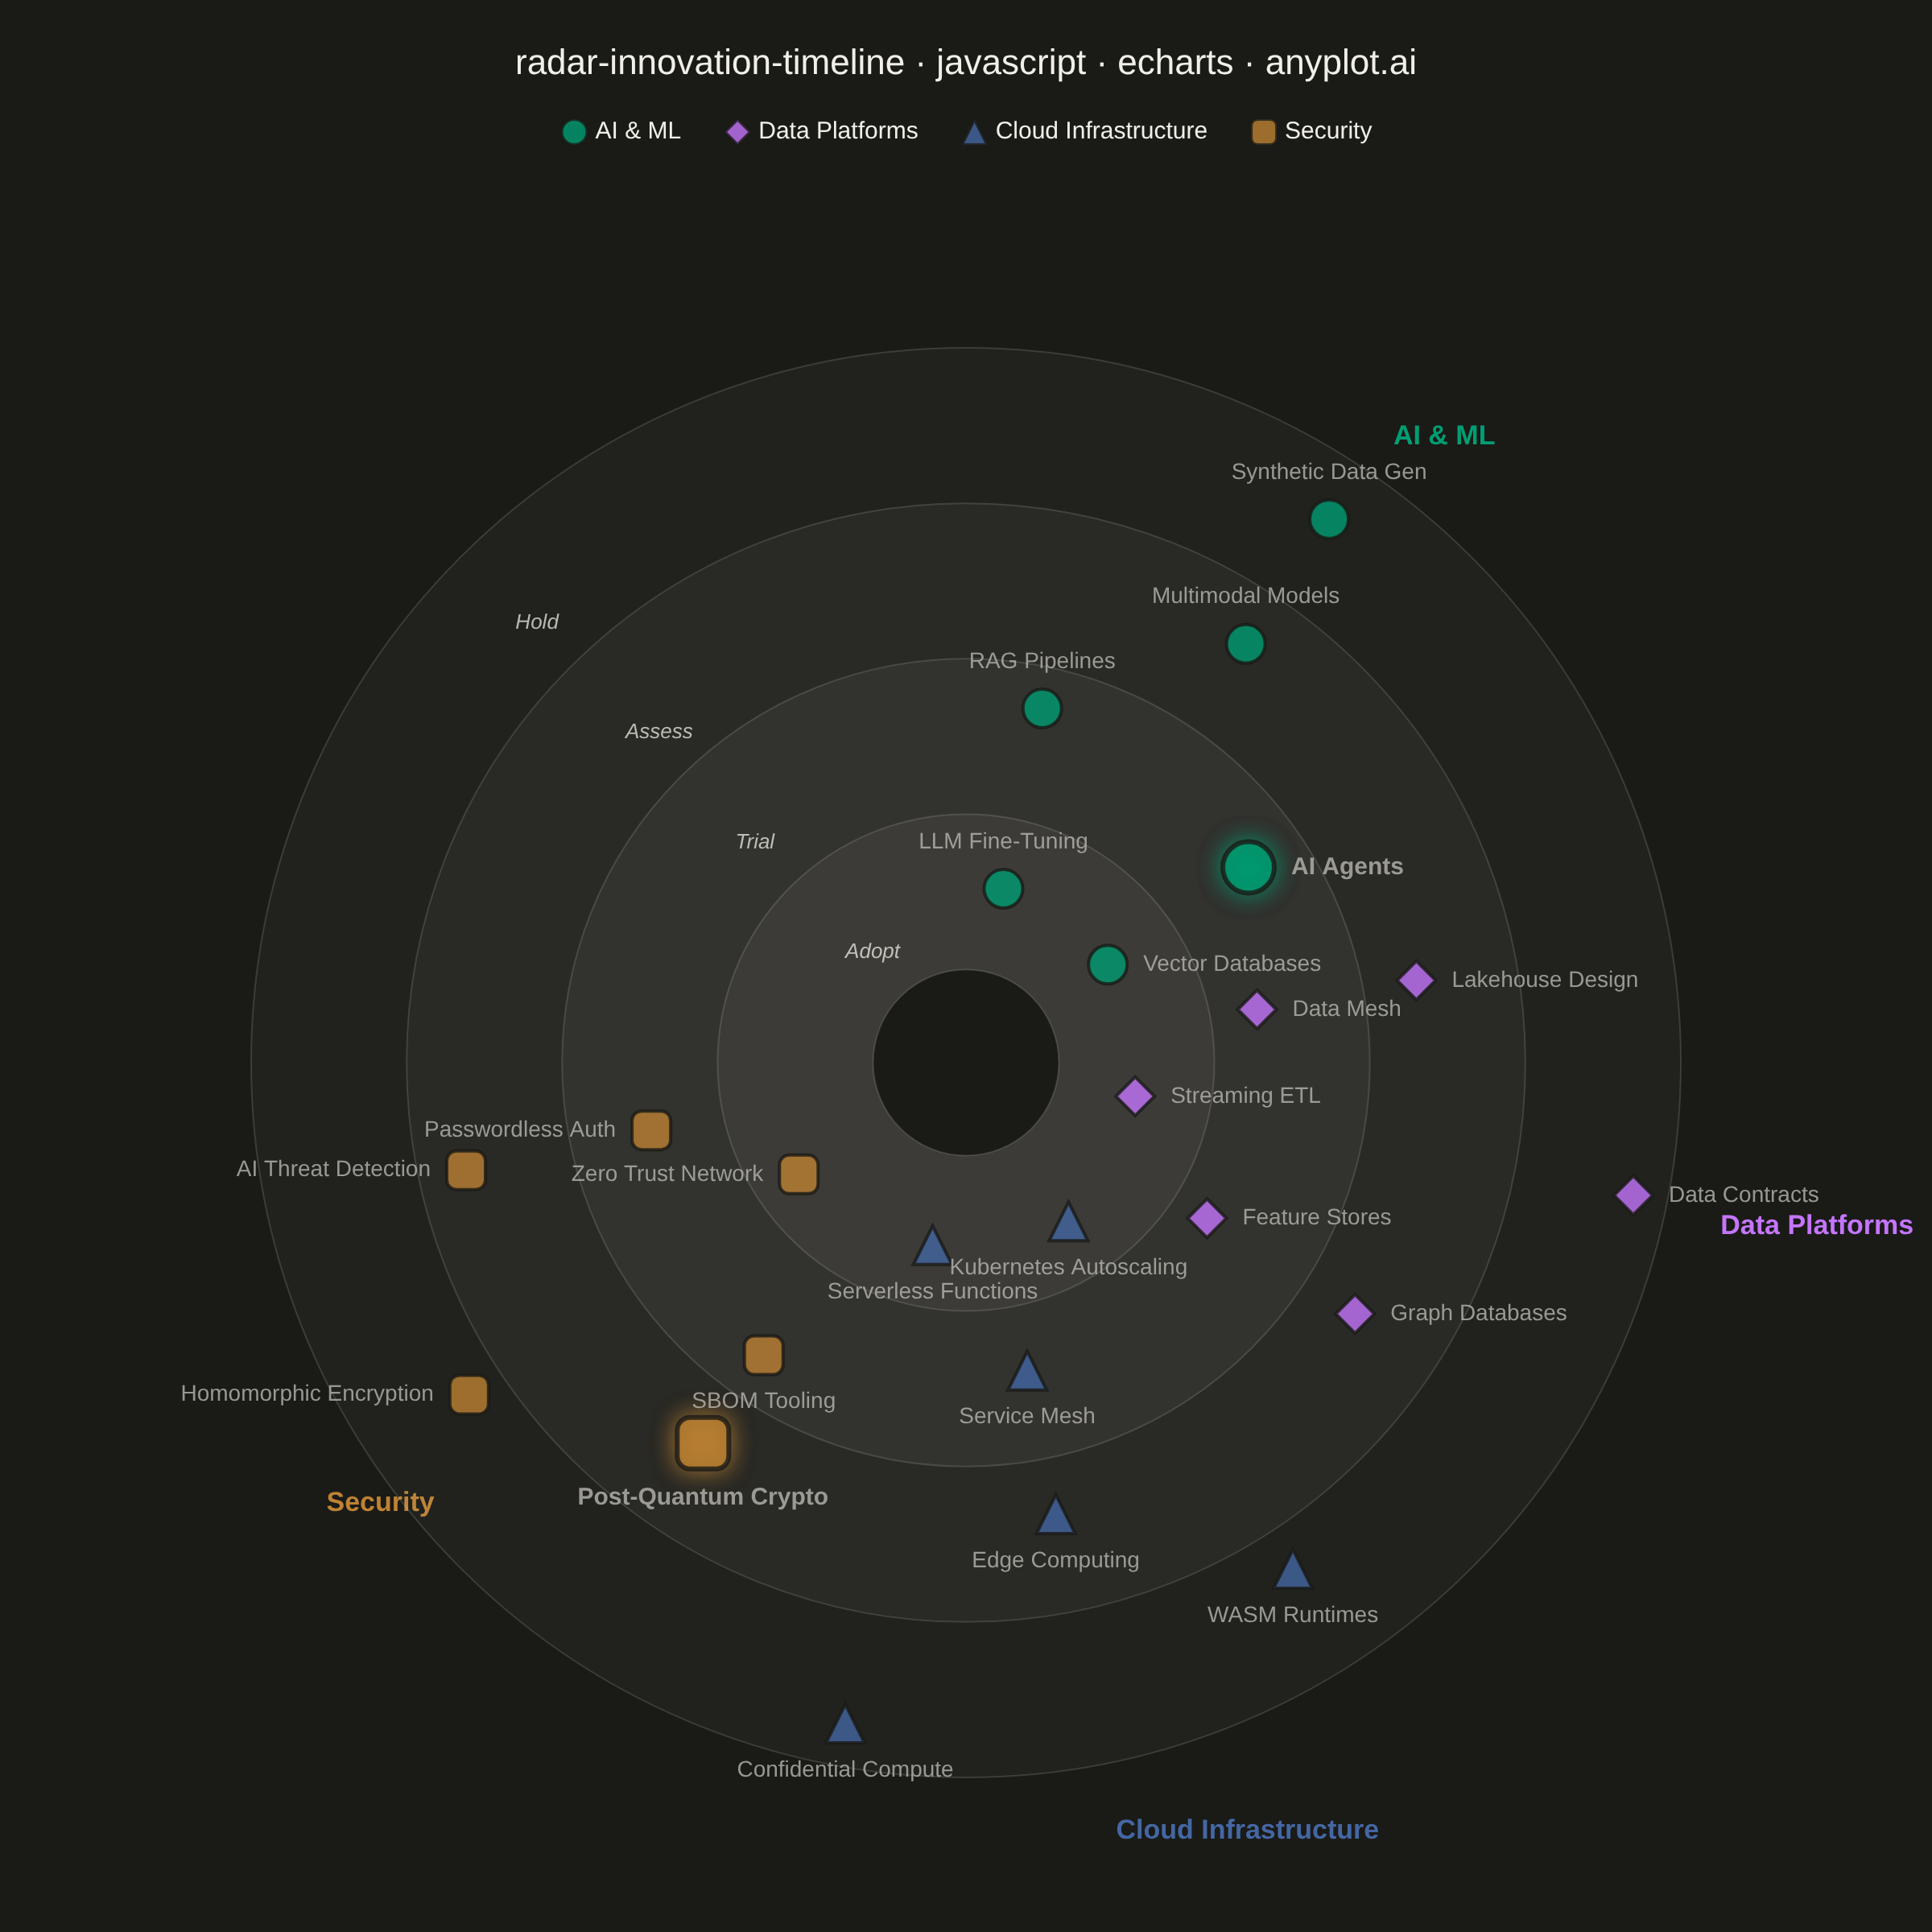
A radial chart that maps innovations, technologies, or trends onto concentric rings representing time horizons and angular sectors representing thematic categories. Inner rings represent near-term items (e.g., "Now", "Next 6 months") while outer rings represent longer-term or emerging trends (e.g., "2-5 years", "Future"). Each item is placed as a labeled point within its sector and ring, with distinct markers or colors encoding categories. Inspired by ThoughtWorks Technology Radar and similar strategic planning visualizations.
Preview render from the Apache ECharts implementation.