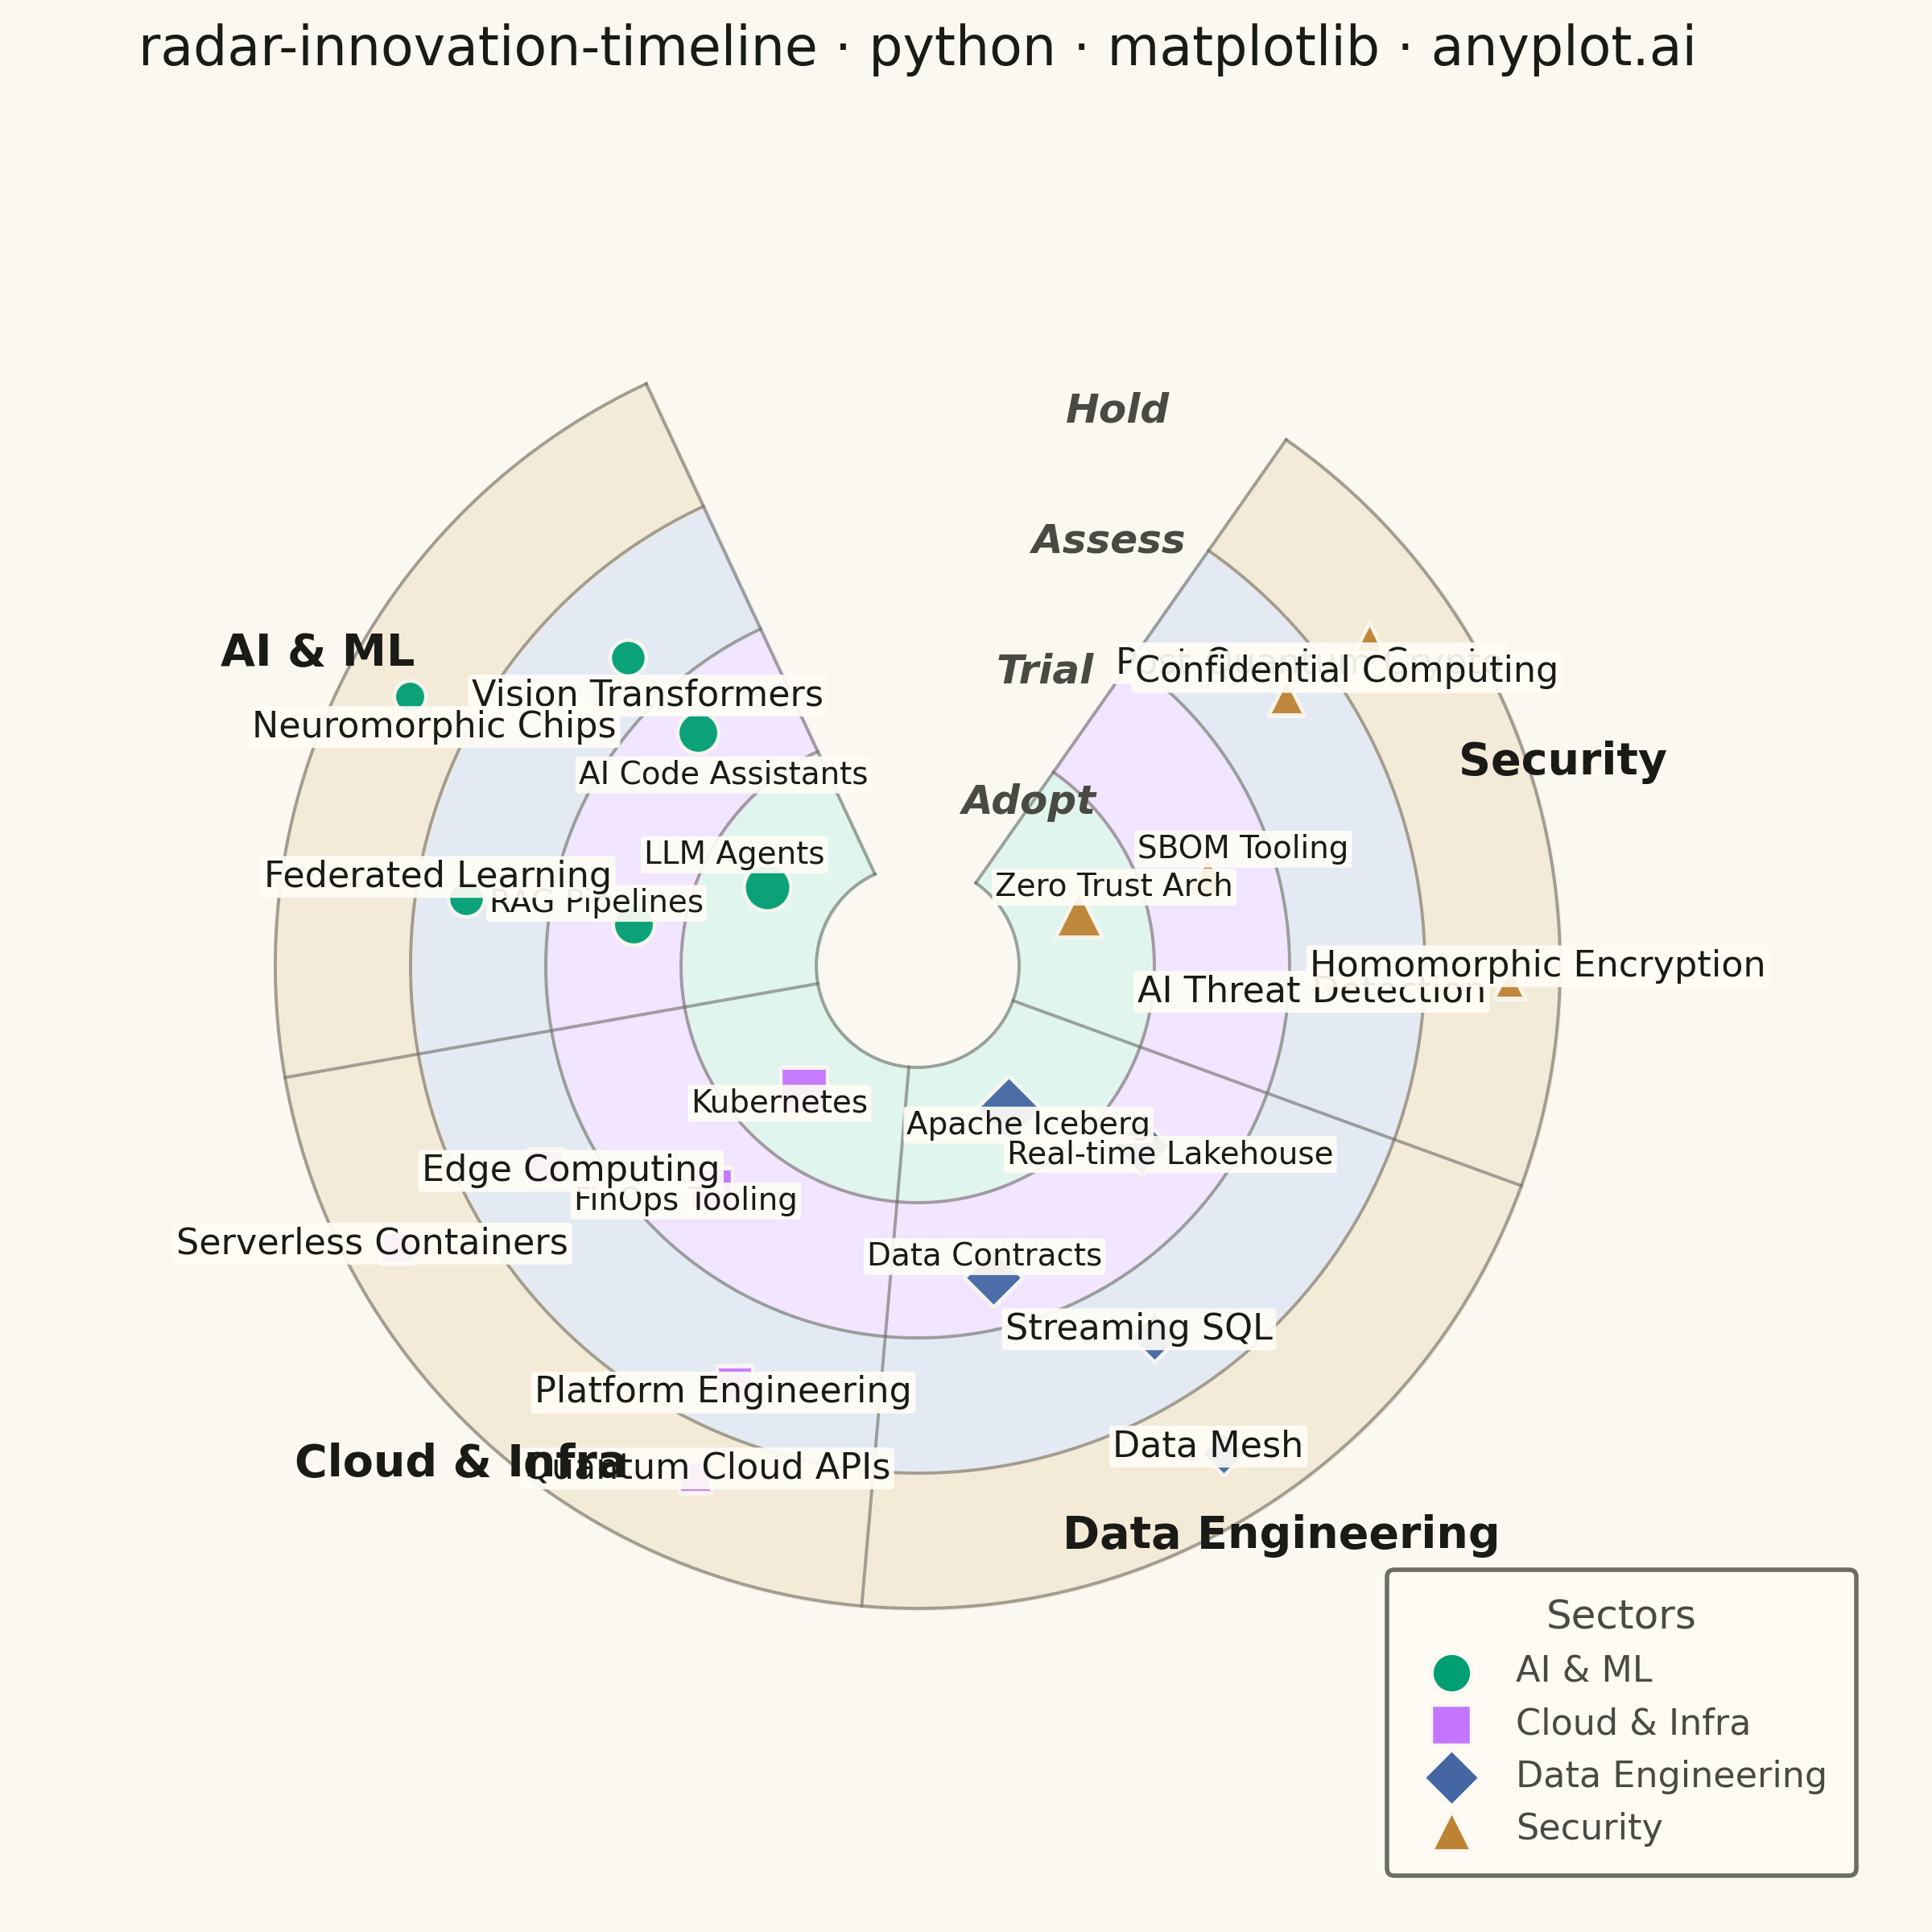
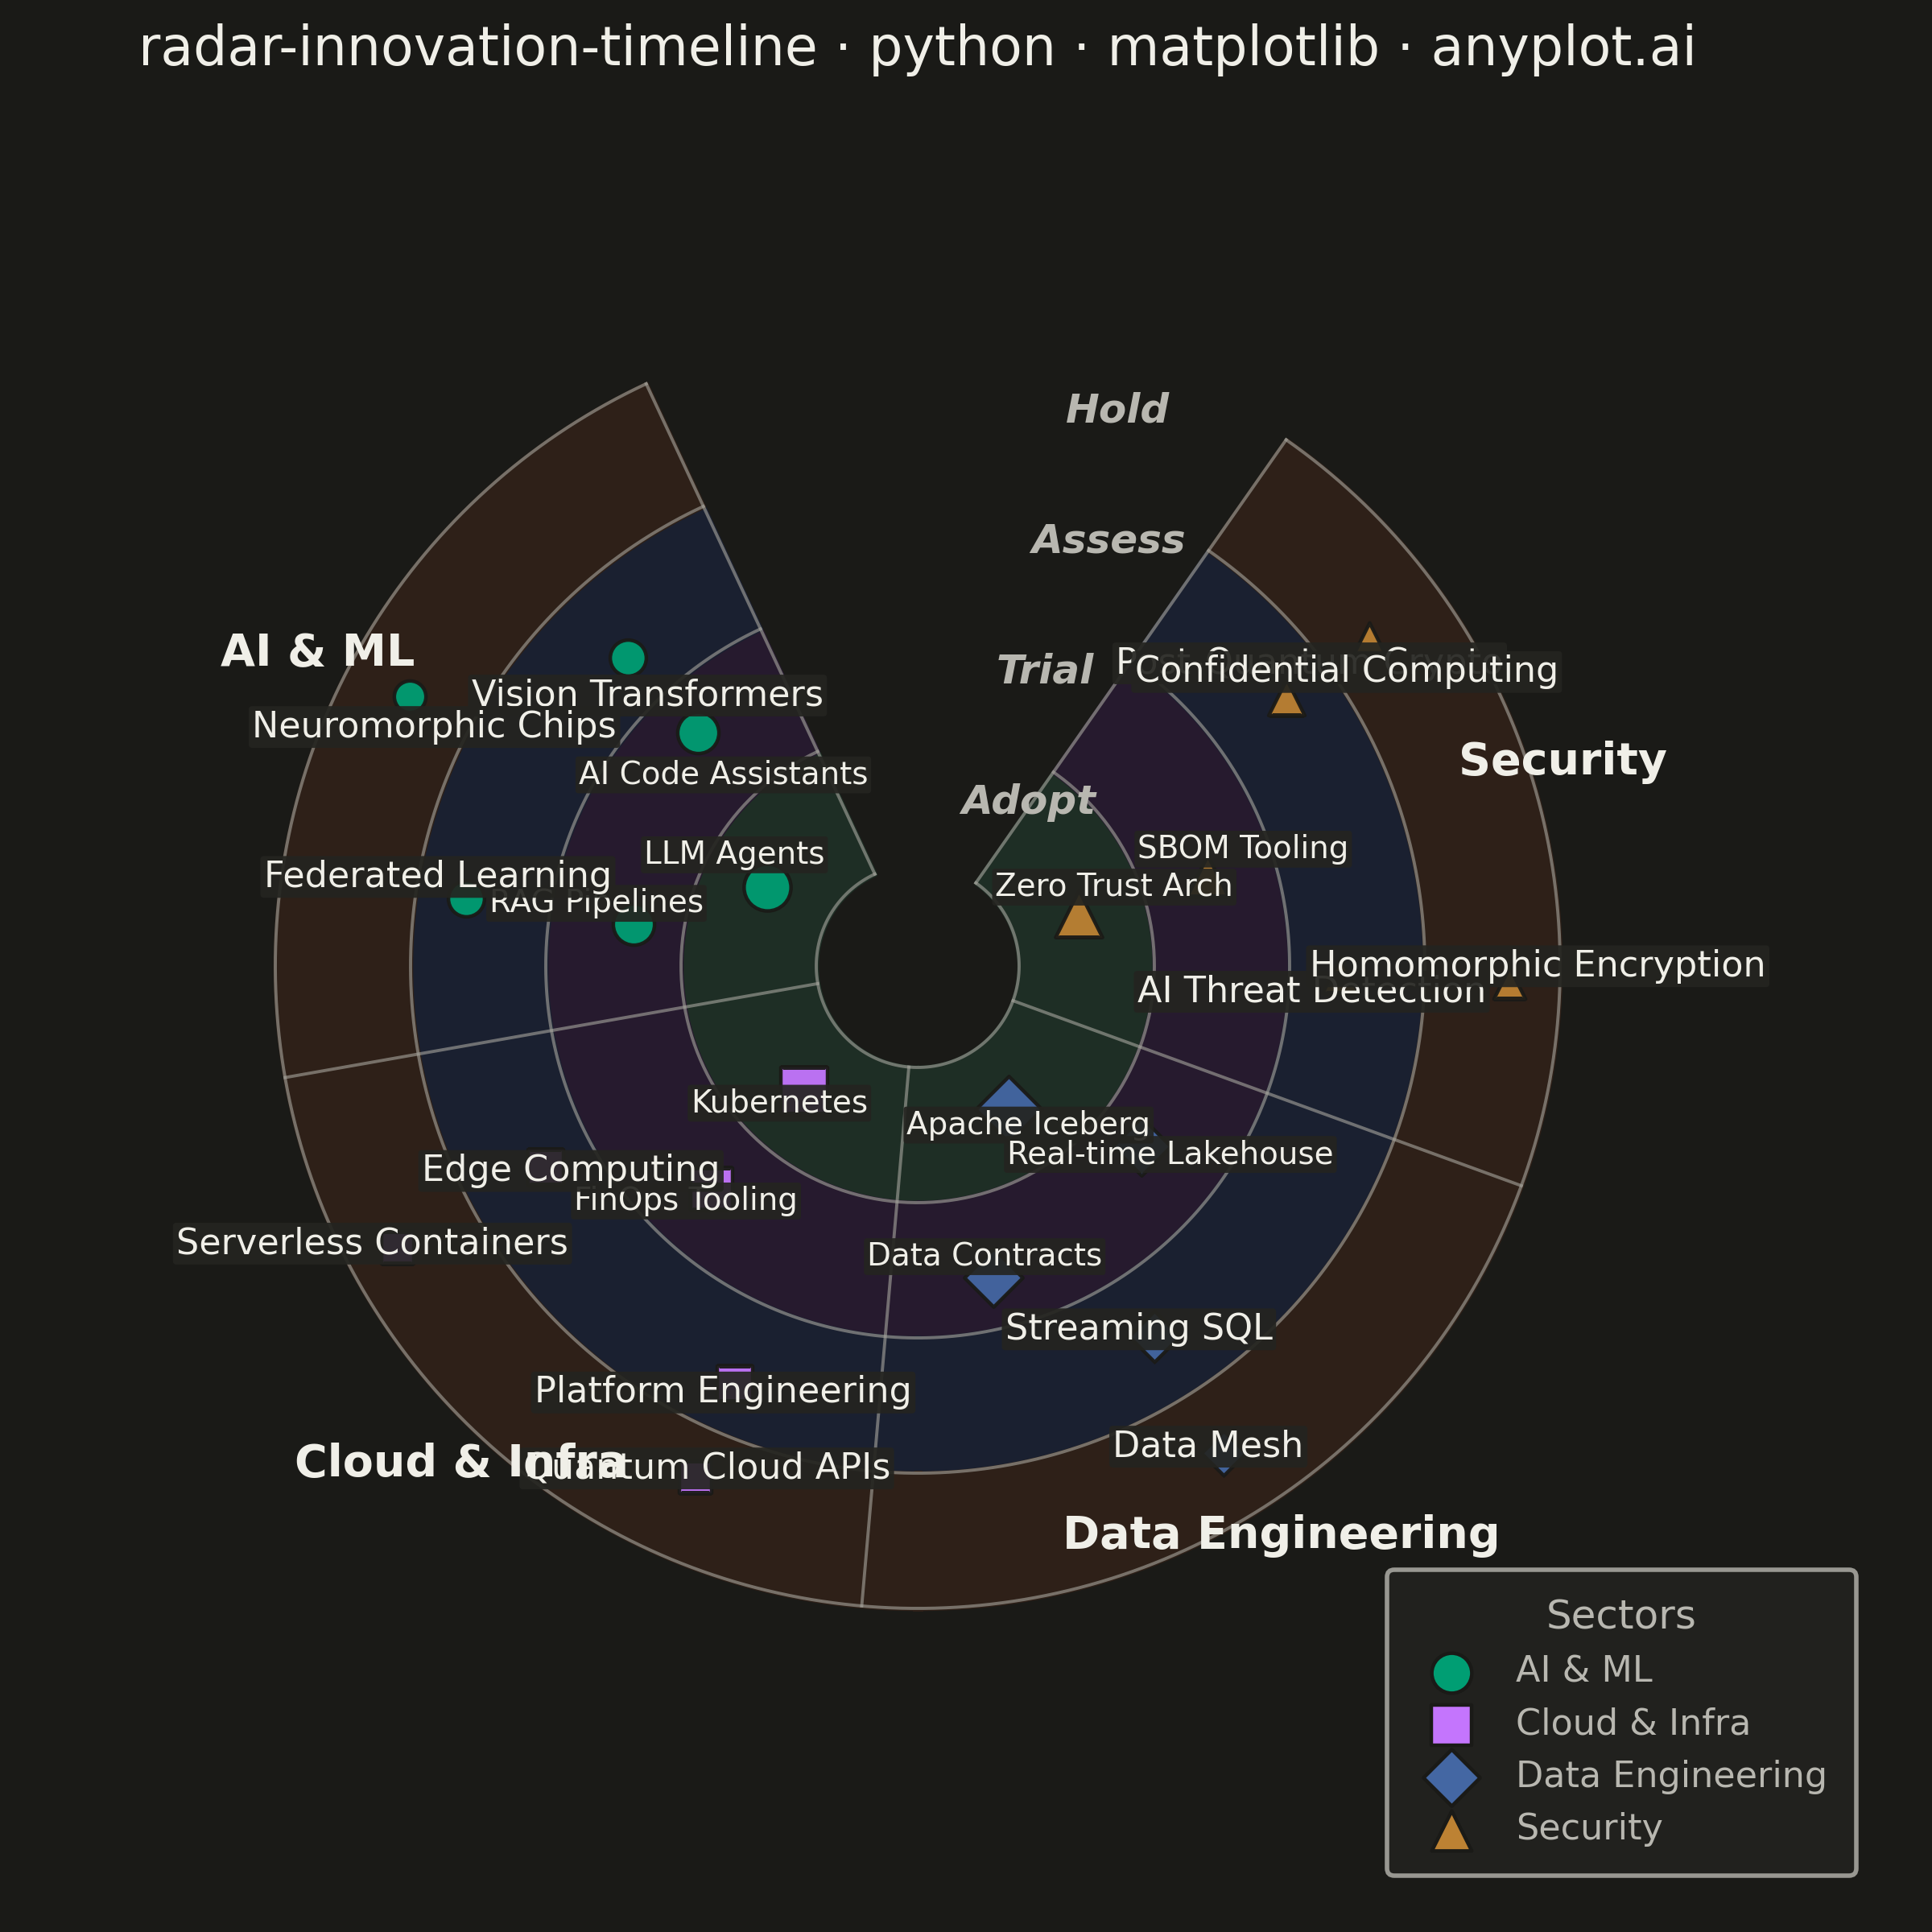
A radial chart that maps innovations, technologies, or trends onto concentric rings representing time horizons and angular sectors representing thematic categories. Inner rings represent near-term items (e.g., "Now", "Next 6 months") while outer rings represent longer-term or emerging trends (e.g., "2-5 years", "Future"). Each item is placed as a labeled point within its sector and ring, with distinct markers or colors encoding categories. Inspired by ThoughtWorks Technology Radar and similar strategic planning visualizations.
""" anyplot.ai
radar-innovation-timeline: Innovation Radar with Time-Horizon Rings
Library: matplotlib 3.10.9 | Python 3.13.13
Quality: 85/100 | Updated: 2026-05-29
"""

import os

import matplotlib.pyplot as plt
import numpy as np


# Theme tokens (Imprint palette — prompts/default-style-guide.md)
THEME = os.getenv("ANYPLOT_THEME", "light")
PAGE_BG = "#FAF8F1" if THEME == "light" else "#1A1A17"
ELEVATED_BG = "#FFFDF6" if THEME == "light" else "#242420"
INK = "#1A1A17" if THEME == "light" else "#F0EFE8"
INK_SOFT = "#4A4A44" if THEME == "light" else "#B8B7B0"
INK_MUTED = "#6B6A63" if THEME == "light" else "#A8A79F"

# Imprint palette — 8 hues, canonical order, first series always position 1
IMPRINT_PALETTE = ["#009E73", "#C475FD", "#4467A3", "#BD8233", "#AE3030", "#2ABCCD", "#954477", "#99B314"]

# Data
np.random.seed(42)

rings = ["Adopt", "Trial", "Assess", "Hold"]
sectors = ["AI & ML", "Cloud & Infra", "Data Engineering", "Security"]
n_sectors = len(sectors)

innovations = [
    ("LLM Agents", "Adopt", "AI & ML"),
    ("RAG Pipelines", "Trial", "AI & ML"),
    ("AI Code Assistants", "Trial", "AI & ML"),
    ("Vision Transformers", "Assess", "AI & ML"),
    ("Federated Learning", "Assess", "AI & ML"),
    ("Neuromorphic Chips", "Hold", "AI & ML"),
    ("Kubernetes", "Adopt", "Cloud & Infra"),
    ("FinOps Tooling", "Trial", "Cloud & Infra"),
    ("Edge Computing", "Assess", "Cloud & Infra"),
    ("Platform Engineering", "Assess", "Cloud & Infra"),
    ("Quantum Cloud APIs", "Hold", "Cloud & Infra"),
    ("Serverless Containers", "Hold", "Cloud & Infra"),
    ("Apache Iceberg", "Adopt", "Data Engineering"),
    ("Real-time Lakehouse", "Trial", "Data Engineering"),
    ("Data Contracts", "Trial", "Data Engineering"),
    ("Streaming SQL", "Assess", "Data Engineering"),
    ("Data Mesh", "Hold", "Data Engineering"),
    ("Zero Trust Arch", "Adopt", "Security"),
    ("SBOM Tooling", "Trial", "Security"),
    ("AI Threat Detection", "Assess", "Security"),
    ("Post-Quantum Crypto", "Assess", "Security"),
    ("Confidential Computing", "Hold", "Security"),
    ("Homomorphic Encryption", "Hold", "Security"),
]

ring_index = {name: i for i, name in enumerate(rings)}
sector_index = {name: i for i, name in enumerate(sectors)}

# Sector colors: Imprint palette positions 1–4 in canonical order
sector_colors = {
    "AI & ML": IMPRINT_PALETTE[0],
    "Cloud & Infra": IMPRINT_PALETTE[1],
    "Data Engineering": IMPRINT_PALETTE[2],
    "Security": IMPRINT_PALETTE[3],
}
sector_markers = {"AI & ML": "o", "Cloud & Infra": "s", "Data Engineering": "D", "Security": "^"}

# Marker sizes by ring — visual hierarchy: near-term prominent, far-future subtle
ring_marker_sizes = {"Adopt": 110, "Trial": 85, "Assess": 65, "Hold": 50}

# Layout: 300-degree arc (wider spread reduces inner-ring label crowding), 60-degree gap for ring labels
arc_span = 5 / 6 * 2 * np.pi
arc_start = np.deg2rad(115)
sector_width = arc_span / n_sectors

# Ring band boundaries — inner ring starts at 1.5 (not 0.5) to push Adopt items
# further from the center, providing ~52% more arc-space between adjacent items
ring_boundaries = [1.5, 3.5, 5.5, 7.5, 9.5]

# Count items per ring-sector cell for spread calculation
sector_ring_counts = {}
for _, ring_name, sector_name in innovations:
    key = (ring_name, sector_name)
    sector_ring_counts[key] = sector_ring_counts.get(key, 0) + 1

# Compute marker positions with wider angular spread to reduce label crowding
positions = []
sector_ring_placed = {}
for name, ring_name, sector_name in innovations:
    r_idx = ring_index[ring_name]
    s_idx = sector_index[sector_name]
    key = (ring_name, sector_name)
    placed = sector_ring_placed.get(key, 0)
    total = sector_ring_counts[key]
    sector_ring_placed[key] = placed + 1

    band_width = ring_boundaries[r_idx + 1] - ring_boundaries[r_idx]
    r_lo = ring_boundaries[r_idx] + band_width * 0.25
    r_hi = ring_boundaries[r_idx] + band_width * 0.75
    if total == 1:
        r = (r_lo + r_hi) / 2
    elif total == 2:
        r = r_lo + (r_hi - r_lo) * (0.25 + 0.50 * placed)
    else:
        r = r_lo + (r_hi - r_lo) * (placed + 0.5) / total

    # Wider angular spread within sector (8% margin instead of 10%) to reduce crowding
    sector_start = arc_start + s_idx * sector_width
    margin = sector_width * 0.08
    a_lo = sector_start + margin
    a_hi = sector_start + sector_width - margin
    if total == 1:
        theta = (a_lo + a_hi) / 2
    elif total == 2:
        frac = 0.20 + 0.60 * placed
        if r_idx % 2 == 1:
            frac = 1.0 - frac
        theta = a_lo + (a_hi - a_lo) * frac
    else:
        frac = placed / (total - 1)
        if r_idx % 2 == 1:
            frac = 1.0 - frac
        theta = a_lo + (a_hi - a_lo) * frac

    # Minimal angular jitter; smaller radial jitter to stay within ring band
    theta += np.random.uniform(-0.008, 0.008)
    r += np.random.uniform(-0.01, 0.01)

    positions.append((name, theta, r, sector_name, ring_name, placed, total, r_idx))

# Plot — square canvas 2400×2400 px (figsize=(6,6), dpi=400)
fig = plt.figure(figsize=(6, 6), dpi=400, facecolor=PAGE_BG)
ax = fig.add_subplot(111, polar=True)
ax.set_facecolor(PAGE_BG)

# Ring fills — Imprint-tinted pastels (light) / darks (dark) for ring separation
if THEME == "light":
    ring_fill_colors = ["#E0F5EE", "#F2E5FF", "#E4EAF4", "#F4EAD8"]
else:
    ring_fill_colors = ["#1E2E25", "#261A2E", "#1A2030", "#2E2018"]

for i in range(len(rings)):
    theta_fill = np.linspace(arc_start, arc_start + arc_span, 300)
    ax.fill_between(
        theta_fill,
        np.full(300, ring_boundaries[i]),
        np.full(300, ring_boundaries[i + 1]),
        color=ring_fill_colors[i],
        alpha=1.0,
    )

# Ring boundary arcs
for boundary in ring_boundaries:
    theta_arc = np.linspace(arc_start, arc_start + arc_span, 300)
    ax.plot(theta_arc, np.full(300, boundary), color=INK_MUTED, linewidth=0.7, alpha=0.6)

# Sector divider lines
for i in range(n_sectors + 1):
    angle = arc_start + i * sector_width
    ax.plot([angle, angle], [ring_boundaries[0], ring_boundaries[-1]], color=INK_MUTED, linewidth=0.7, alpha=0.6)

# Ring labels in the arc gap — push labels 0.35 rad past arc end to clear the boundary divider
label_angle = arc_start + arc_span + 0.35
for i, ring_name in enumerate(rings):
    r_mid = (ring_boundaries[i] + ring_boundaries[i + 1]) / 2
    ax.text(
        label_angle,
        r_mid,
        ring_name,
        ha="left",
        va="center",
        fontsize=9,
        fontweight="bold",
        color=INK_SOFT,
        fontstyle="italic",
        clip_on=False,
        zorder=10,
    )

# Sector labels along outer edge
for i, sector_name in enumerate(sectors):
    angle = arc_start + (i + 0.5) * sector_width
    ax.text(
        angle,
        ring_boundaries[-1] + 0.50,
        sector_name,
        ha="center",
        va="center",
        fontsize=10,
        fontweight="bold",
        color=INK,
        clip_on=False,
        zorder=10,
    )

# Label background for readability — theme-adaptive elevated surface
label_bbox = {"boxstyle": "round,pad=0.10", "facecolor": ELEVATED_BG, "alpha": 0.92, "edgecolor": "none"}

# Markers and labels
for name, theta, r, sector_name, ring_name, placed, _total, r_idx in positions:
    color = sector_colors[sector_name]
    marker = sector_markers[sector_name]
    msize = ring_marker_sizes[ring_name]

    ax.scatter(theta, r, s=msize, color=color, marker=marker, edgecolors=PAGE_BG, linewidth=0.8, zorder=5, alpha=0.95)

    # Alternate label radially above/below; inner rings prefer outward, outer prefer inward
    # to keep labels away from both the ring boundary and the chart edge
    outward = placed % 2 == 0
    if r_idx >= 2:  # Assess / Hold: flip to avoid outer boundary crowding
        outward = not outward
    # Inner rings: larger offset to push labels away from crowded center; smaller font
    base_offset = 0.55 if r_idx <= 1 else 0.42
    label_fontsize = 7 if r_idx <= 1 else 8
    label_offset = base_offset if outward else -base_offset
    va = "bottom" if outward else "top"

    ax.text(
        theta,
        r + label_offset,
        name,
        fontsize=label_fontsize,
        ha="center",
        va=va,
        color=INK,
        fontweight="medium",
        bbox=label_bbox,
        zorder=6,
        clip_on=False,
    )

# Style — hide default polar decorations
ax.set_ylim(0, ring_boundaries[-1] + 2.5)
ax.set_yticklabels([])
ax.set_xticklabels([])
ax.set_xticks([])
ax.set_yticks([])
ax.grid(False)
ax.spines["polar"].set_visible(False)

# Title — scale fontsize with title length per prompts/plot-generator.md
title = "radar-innovation-timeline · python · matplotlib · anyplot.ai"
n = len(title)
ratio = 67 / n if n > 67 else 1.0
title_fontsize = max(8, round(12 * ratio))
ax.set_title(title, fontsize=title_fontsize, fontweight="medium", pad=20, color=INK)

# Legend — theme-adaptive frame and text
legend_handles = [
    plt.scatter(
        [], [], s=80, color=sector_colors[s], marker=sector_markers[s], edgecolors=PAGE_BG, linewidth=0.8, label=s
    )
    for s in sectors
]
leg = fig.legend(
    handles=legend_handles,
    loc="lower right",
    fontsize=8,
    title="Sectors",
    title_fontsize=9,
    handletextpad=0.8,
    borderpad=0.8,
    bbox_to_anchor=(0.97, 0.02),
)
if leg:
    leg.get_frame().set_facecolor(ELEVATED_BG)
    leg.get_frame().set_edgecolor(INK_SOFT)
    plt.setp(leg.get_texts(), color=INK_SOFT)
    leg.get_title().set_color(INK_SOFT)

fig.subplots_adjust(left=0.05, right=0.90, top=0.92, bottom=0.08)
plt.savefig(f"plot-{THEME}.png", dpi=400, facecolor=PAGE_BG)
Runnable source as JSON, for any HTTP client: https://api.anyplot.ai/specs/radar-innovation-timeline/matplotlib/code. Any spec id and library id listed in llms-full.txt fit the same URL shape; every URL below is complete and callable.
{
  "spec_id": "radar-innovation-timeline",
  "language": "python",
  "library": "matplotlib",
  "page": "https://anyplot.ai/radar-innovation-timeline/python/matplotlib",
  "hub": "https://anyplot.ai/radar-innovation-timeline",
  "code_json": "https://api.anyplot.ai/specs/radar-innovation-timeline/matplotlib/code",
  "spec_json": "https://api.anyplot.ai/specs/radar-innovation-timeline",
  "render_light_png": "https://storage.googleapis.com/anyplot-images/plots/radar-innovation-timeline/python/matplotlib/plot-light.png",
  "render_dark_png": "https://storage.googleapis.com/anyplot-images/plots/radar-innovation-timeline/python/matplotlib/plot-dark.png",
  "quality_score": 85.0,
  "license": "MIT",
  "guide": "https://anyplot.ai/llms.txt"
}
Part of Innovation Radar with Time-Horizon Rings on anyplot.ai.