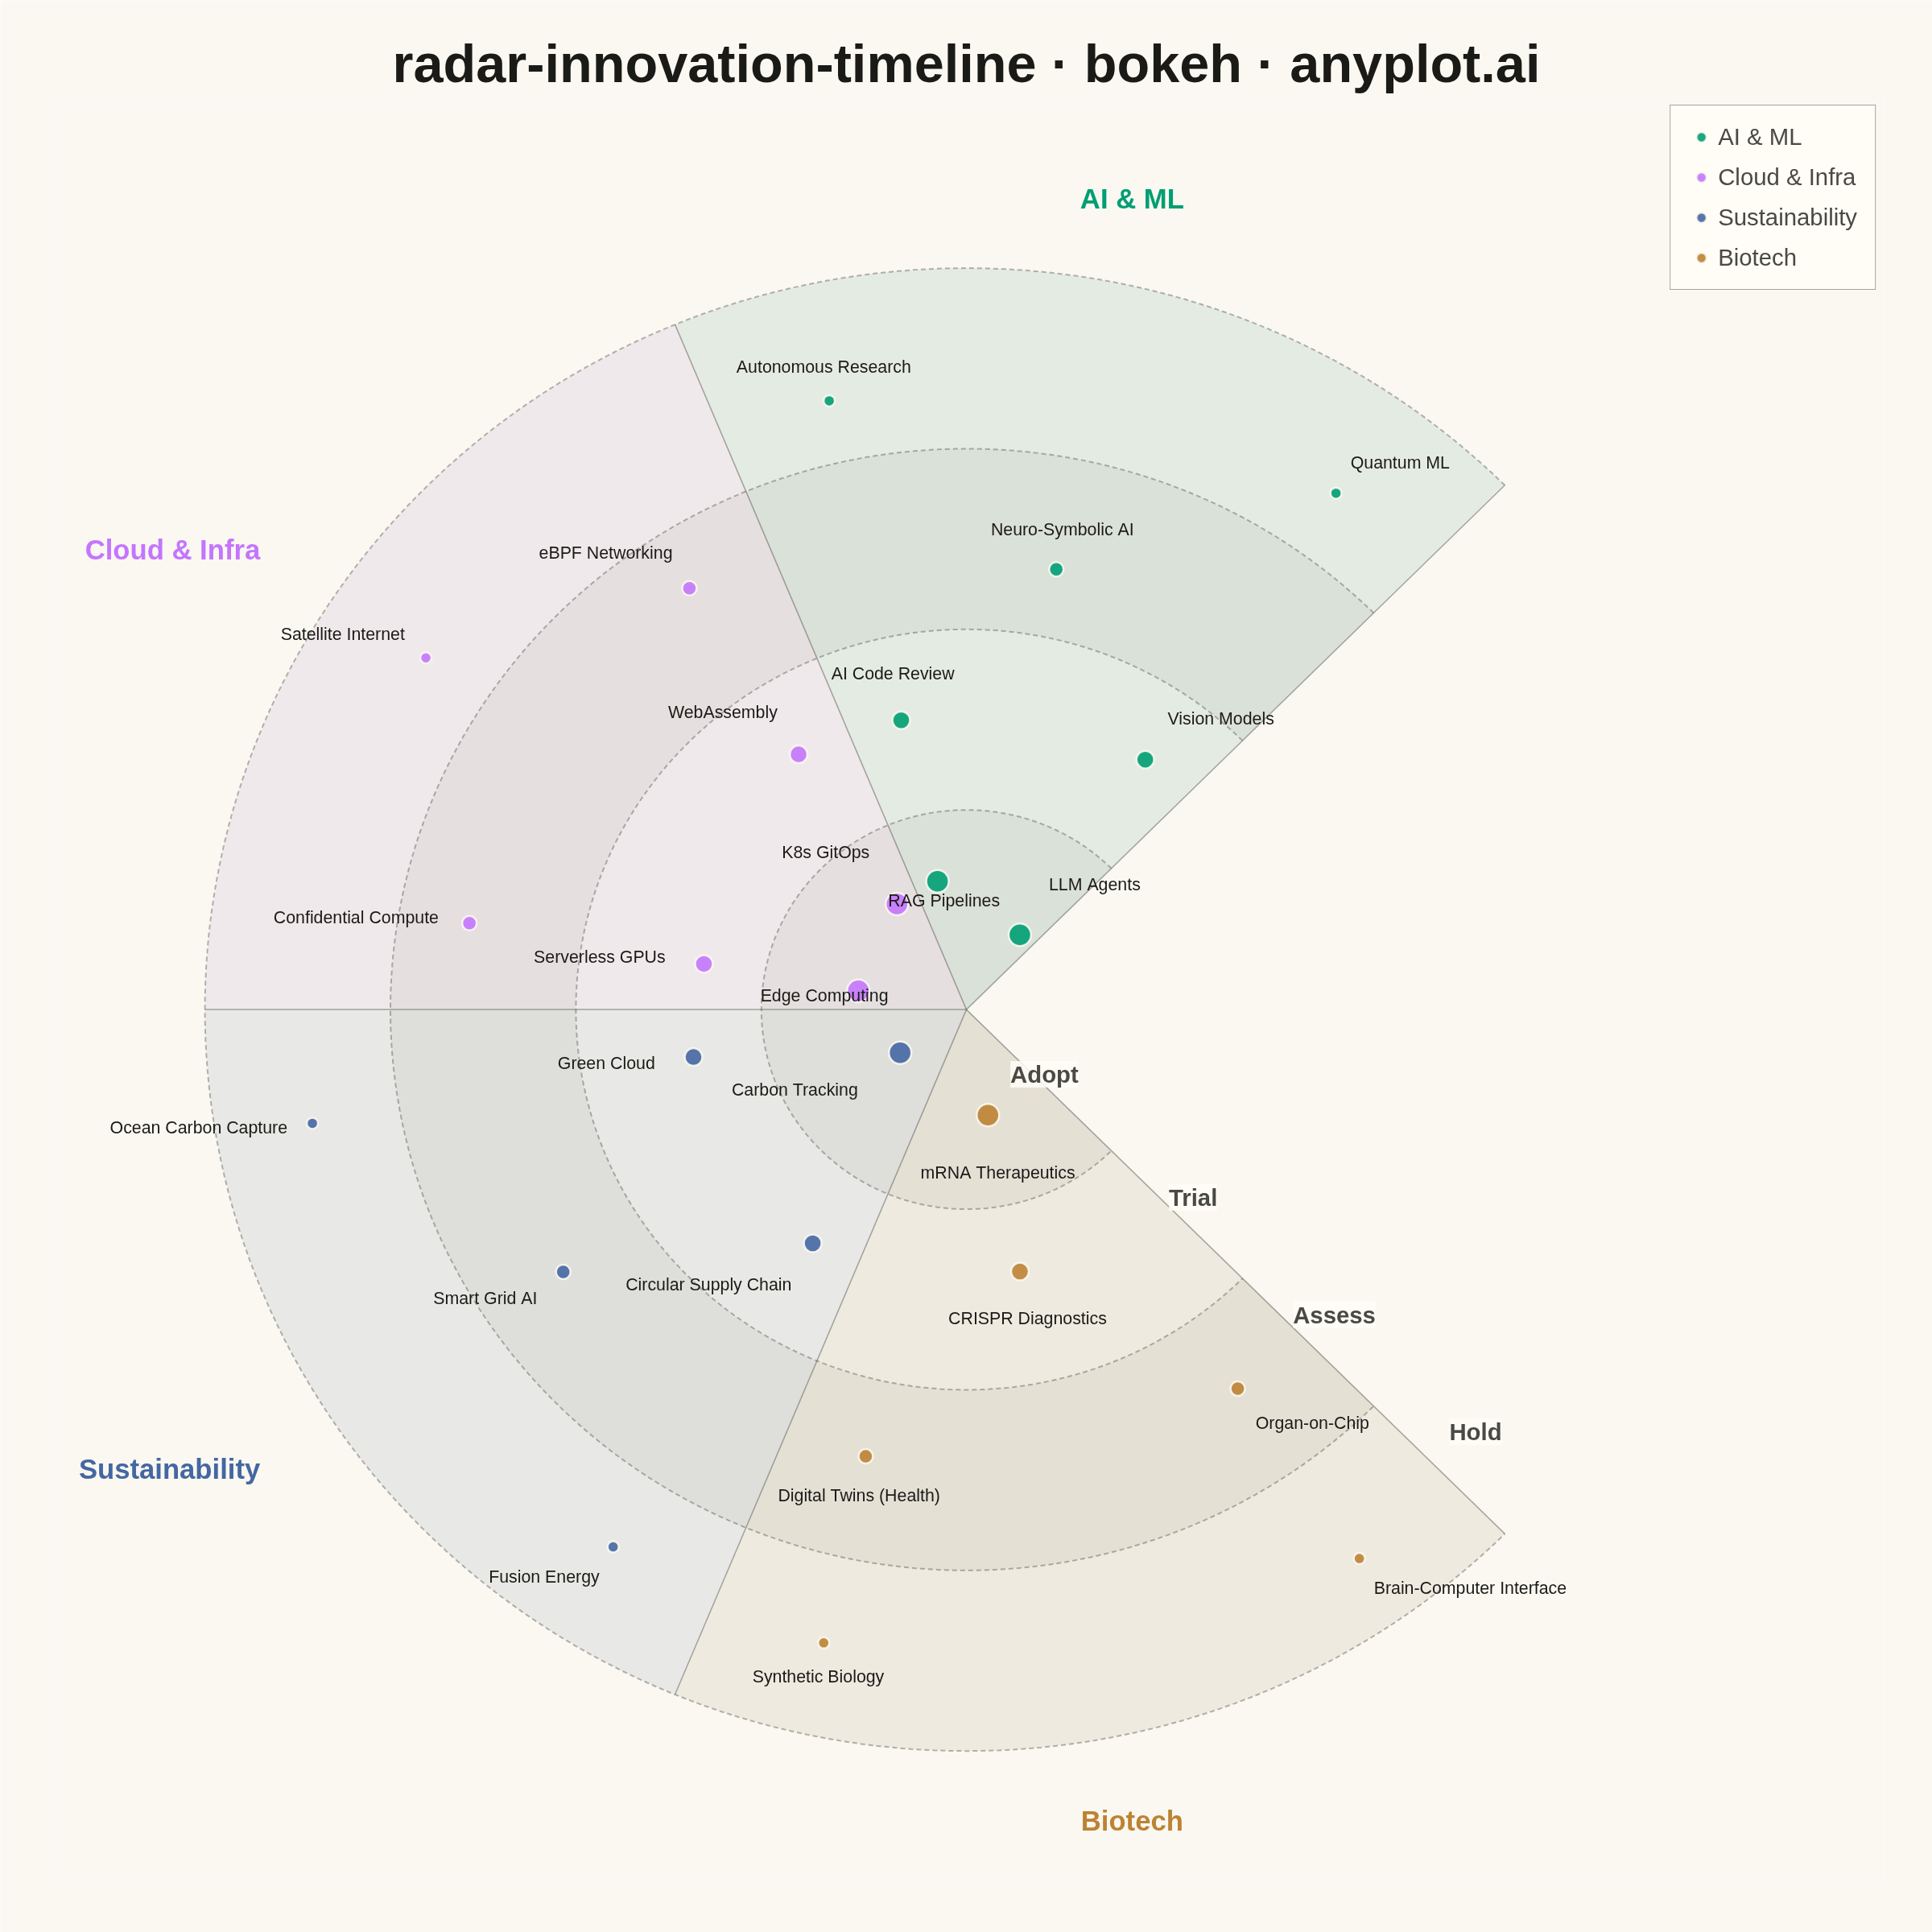
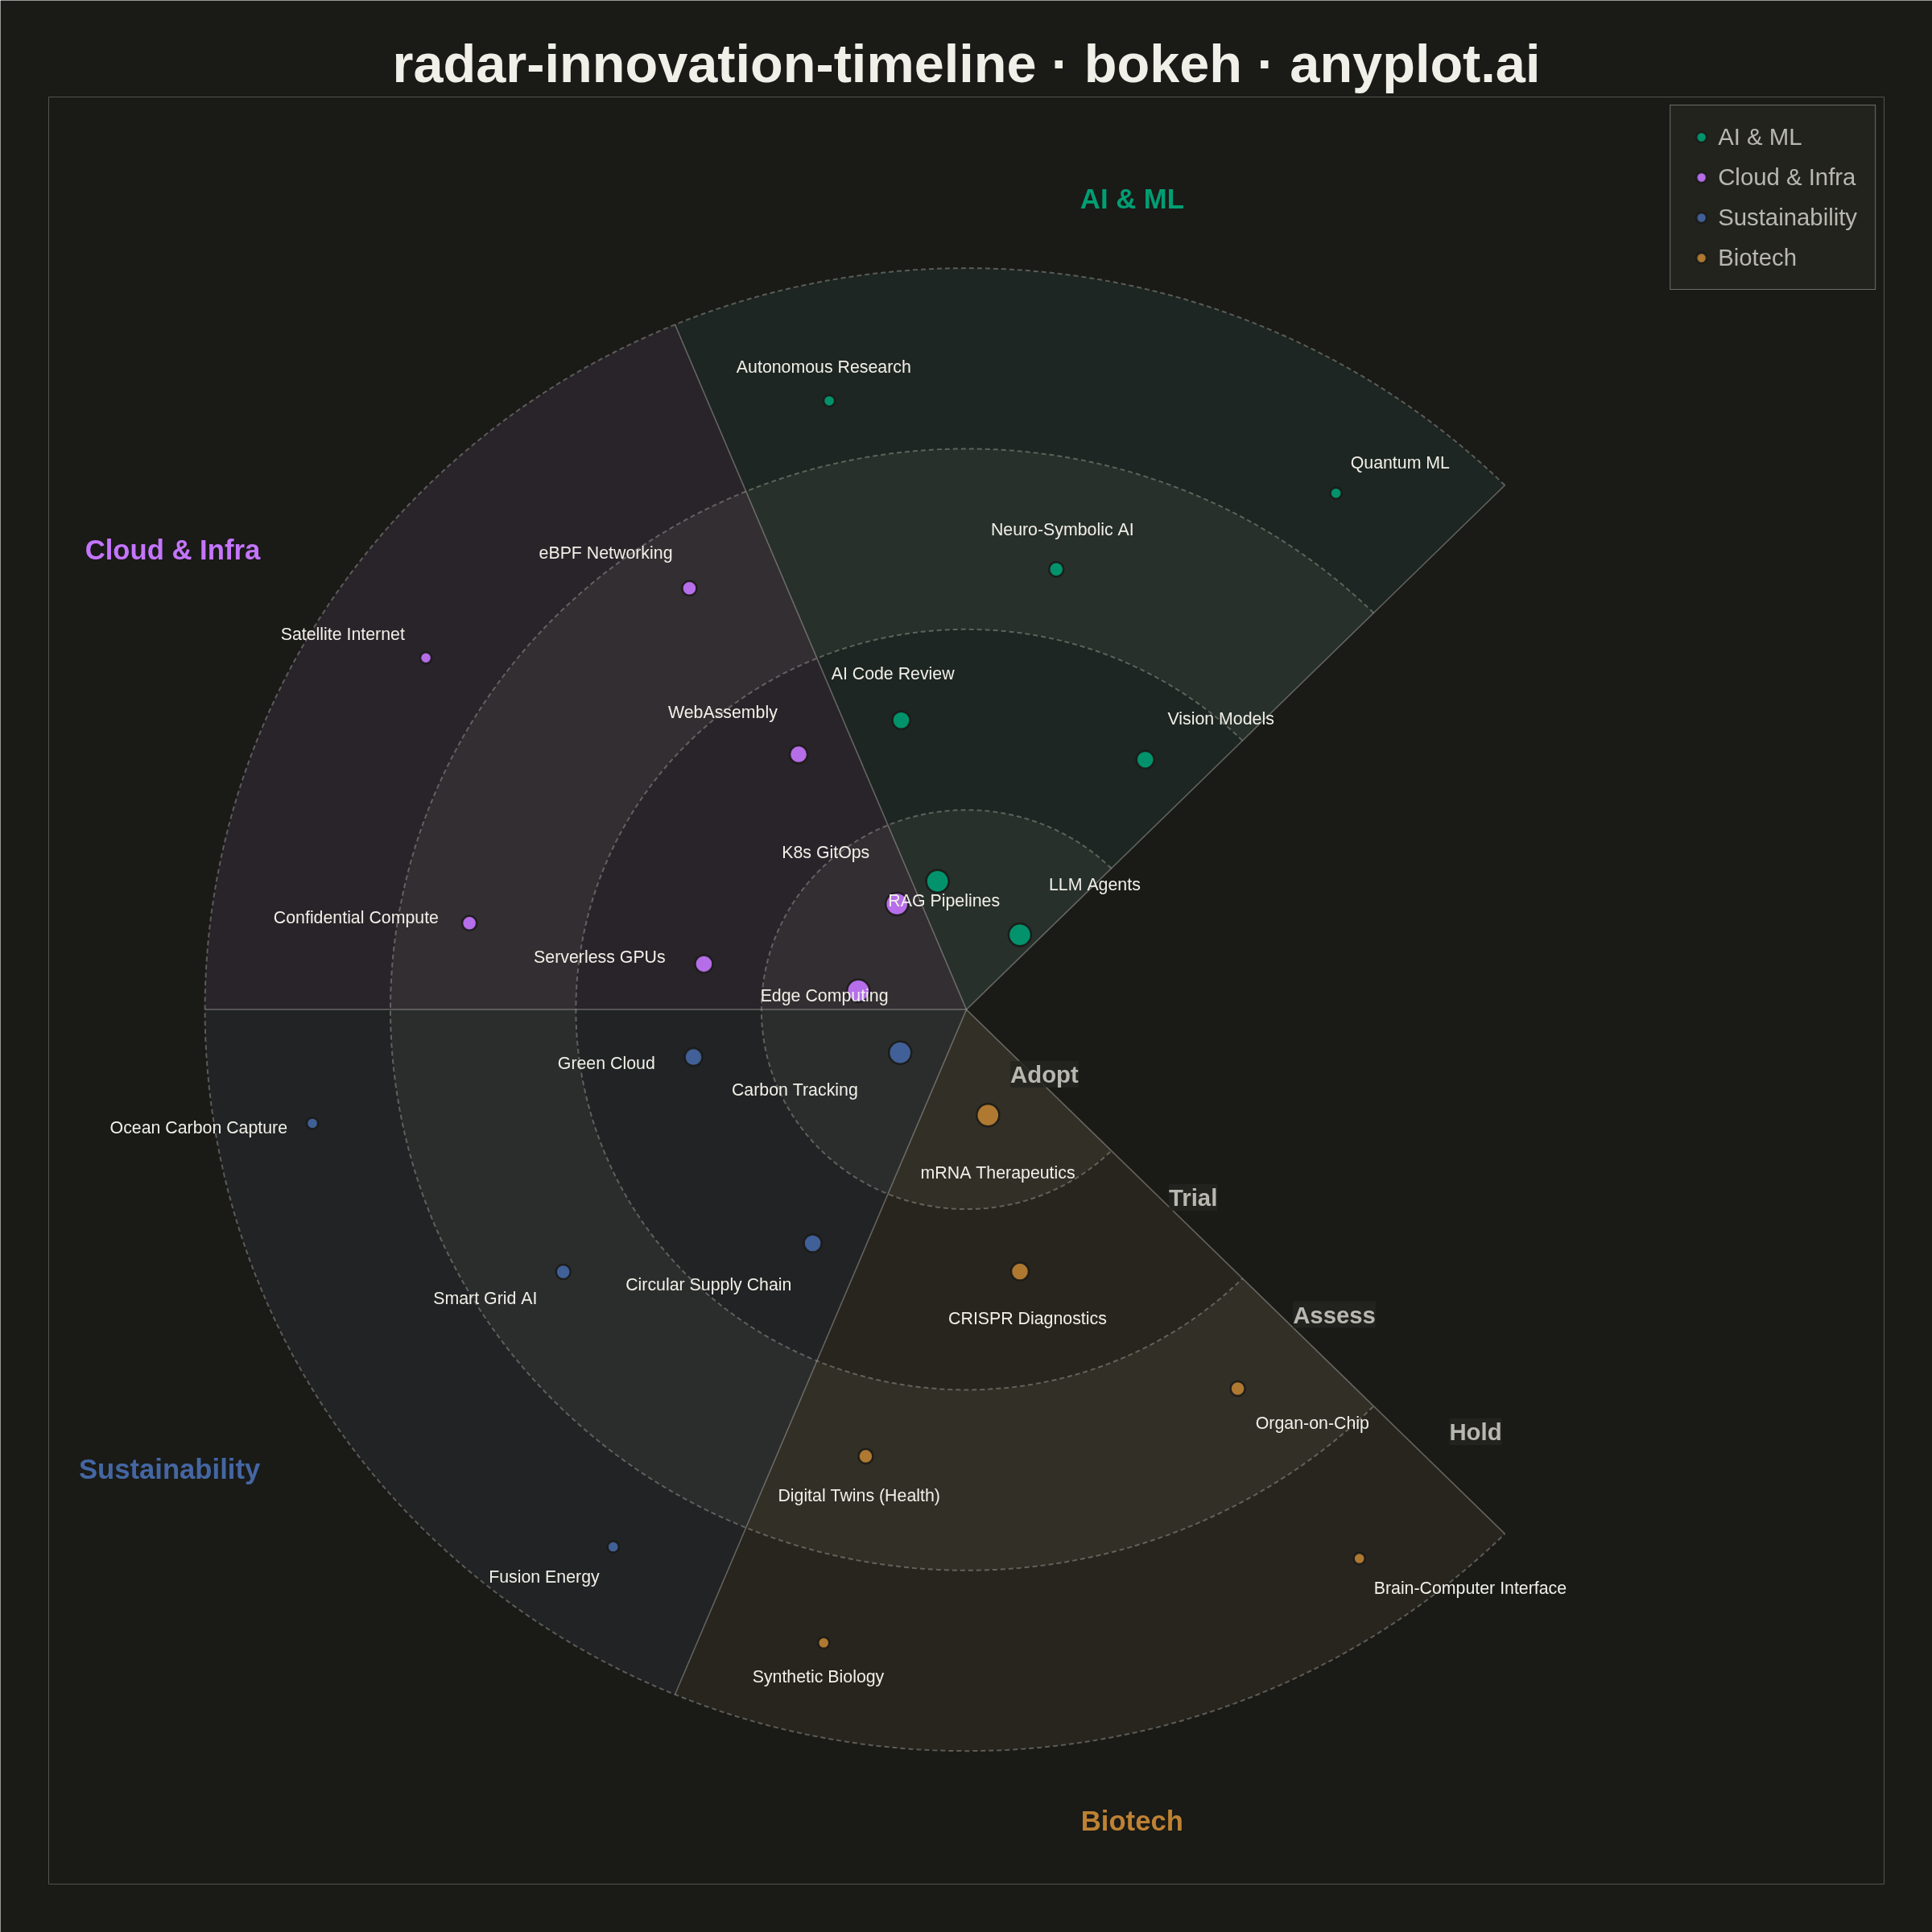
A radial chart that maps innovations, technologies, or trends onto concentric rings representing time horizons and angular sectors representing thematic categories. Inner rings represent near-term items (e.g., "Now", "Next 6 months") while outer rings represent longer-term or emerging trends (e.g., "2-5 years", "Future"). Each item is placed as a labeled point within its sector and ring, with distinct markers or colors encoding categories. Inspired by ThoughtWorks Technology Radar and similar strategic planning visualizations.
""" anyplot.ai
radar-innovation-timeline: Innovation Radar with Time-Horizon Rings
Library: bokeh 3.9.0 | Python 3.13.13
Quality: 87/100 | Updated: 2026-05-29
"""

import os
import time
from collections import defaultdict
from pathlib import Path

import numpy as np
from bokeh.io import output_file, save
from bokeh.models import ColumnDataSource, HoverTool, Label, Legend, LegendItem
from bokeh.plotting import figure
from selenium import webdriver
from selenium.webdriver.chrome.options import Options


THEME = os.getenv("ANYPLOT_THEME", "light")

# Imprint palette — theme-adaptive chrome
PAGE_BG = "#FAF8F1" if THEME == "light" else "#1A1A17"
ELEVATED_BG = "#FFFDF6" if THEME == "light" else "#242420"
INK = "#1A1A17" if THEME == "light" else "#F0EFE8"
INK_SOFT = "#4A4A44" if THEME == "light" else "#B8B7B0"

# Imprint categorical palette — 8 hues, canonical order, theme-independent
IMPRINT_PALETTE = ["#009E73", "#C475FD", "#4467A3", "#BD8233", "#AE3030", "#2ABCCD", "#954477", "#99B314"]

# Sector colors: first 4 Imprint positions (#009E73 is always first series)
sector_colors = IMPRINT_PALETTE[:4]

# Data — Technology innovation radar
np.random.seed(42)

sectors = ["AI & ML", "Cloud & Infra", "Sustainability", "Biotech"]
rings = ["Adopt", "Trial", "Assess", "Hold"]

ring_inner = [0, 105, 200, 295]
ring_outer = [105, 200, 295, 390]
ring_mid = [(i + o) / 2 for i, o in zip(ring_inner, ring_outer, strict=True)]

# Visual hierarchy: near-term items are larger/bolder
ring_marker_sizes = [28, 22, 18, 14]

items = [
    # AI & ML (sector 0) — Imprint green #009E73
    ("LLM Agents", 0, 0),
    ("RAG Pipelines", 0, 0),
    ("Vision Models", 1, 0),
    ("AI Code Review", 1, 0),
    ("Neuro-Symbolic AI", 2, 0),
    ("Quantum ML", 3, 0),
    ("Autonomous Research", 3, 0),
    # Cloud & Infra (sector 1) — Imprint lavender #C475FD
    ("K8s GitOps", 0, 1),
    ("Edge Computing", 0, 1),
    ("WebAssembly", 1, 1),
    ("Serverless GPUs", 1, 1),
    ("eBPF Networking", 2, 1),
    ("Confidential Compute", 2, 1),
    ("Satellite Internet", 3, 1),
    # Sustainability (sector 2) — Imprint blue #4467A3
    ("Carbon Tracking", 0, 2),
    ("Green Cloud", 1, 2),
    ("Circular Supply Chain", 1, 2),
    ("Smart Grid AI", 2, 2),
    ("Ocean Carbon Capture", 3, 2),
    ("Fusion Energy", 3, 2),
    # Biotech (sector 3) — Imprint ochre #BD8233
    ("mRNA Therapeutics", 0, 3),
    ("CRISPR Diagnostics", 1, 3),
    ("Digital Twins (Health)", 2, 3),
    ("Organ-on-Chip", 2, 3),
    ("Synthetic Biology", 3, 3),
    ("Brain-Computer Interface", 3, 3),
]

n_sectors = len(sectors)

# 270-degree layout; gap in upper-right holds ring labels and legend
total_angle = 3 * np.pi / 2
start_angle = np.pi / 4
sector_width = total_angle / n_sectors
sector_starts = [start_angle + i * sector_width for i in range(n_sectors)]
sector_ends = [start_angle + (i + 1) * sector_width for i in range(n_sectors)]

# Square canvas 2400×2400 (symmetric radar)
W, H = 2400, 2400

p = figure(
    width=W,
    height=H,
    title="radar-innovation-timeline · python · bokeh · anyplot.ai",
    x_range=(-470, 470),
    y_range=(-460, 480),
    tools="",
    toolbar_location=None,  # omit toolbar so PNG height matches H exactly
    min_border_top=120,
    min_border_bottom=60,
    min_border_left=60,
    min_border_right=60,
)

# Theme-adaptive chrome
p.axis.visible = False
p.grid.visible = False
p.outline_line_color = None
p.background_fill_color = PAGE_BG
p.border_fill_color = PAGE_BG
p.title.text_font_size = "50pt"
p.title.align = "center"
p.title.text_color = INK

# Alternating ring background fills — subtle bands separate time horizons
for ring_idx in range(len(rings)):
    r_out = ring_outer[ring_idx]
    r_in = ring_inner[ring_idx]
    theta = np.linspace(start_angle, start_angle + total_angle, 200)
    x_out = r_out * np.cos(theta)
    y_out = r_out * np.sin(theta)
    x_in = r_in * np.cos(theta[::-1])
    y_in = r_in * np.sin(theta[::-1])
    fill_alpha = 0.10 if ring_idx % 2 == 0 else 0.04
    p.patch(
        np.concatenate([x_out, x_in]).tolist(),
        np.concatenate([y_out, y_in]).tolist(),
        fill_color=INK_SOFT,
        fill_alpha=fill_alpha,
        line_color=None,
    )

# Sector-colored overlays per ring-sector cell for visual grouping
for ring_idx in range(len(rings)):
    for sector_idx in range(n_sectors):
        r_out = ring_outer[ring_idx]
        r_in = ring_inner[ring_idx]
        theta_seg = np.linspace(sector_starts[sector_idx], sector_ends[sector_idx], 50)
        x_out = r_out * np.cos(theta_seg)
        y_out = r_out * np.sin(theta_seg)
        x_in = r_in * np.cos(theta_seg[::-1])
        y_in = r_in * np.sin(theta_seg[::-1])
        p.patch(
            np.concatenate([x_out, x_in]).tolist(),
            np.concatenate([y_out, y_in]).tolist(),
            fill_color=sector_colors[sector_idx],
            fill_alpha=0.06,
            line_color=None,
        )

# Ring boundary arcs (dashed)
for r in ring_outer:
    theta = np.linspace(start_angle, start_angle + total_angle, 200)
    p.line(
        (r * np.cos(theta)).tolist(),
        (r * np.sin(theta)).tolist(),
        line_color=INK_SOFT,
        line_width=2,
        line_alpha=0.4,
        line_dash=[6, 4],
    )

# Sector divider lines from center to outer ring
for i in range(n_sectors + 1):
    angle = start_angle + i * sector_width
    p.line(
        [0, ring_outer[-1] * np.cos(angle)],
        [0, ring_outer[-1] * np.sin(angle)],
        line_color=INK_SOFT,
        line_width=1.5,
        line_alpha=0.45,
    )

# Ring labels in the gap area (upper-right, just beyond the arc end)
end_angle = start_angle + total_angle
label_angle = end_angle + 0.08
for ring_idx, ring_name in enumerate(rings):
    r = ring_mid[ring_idx]
    p.add_layout(
        Label(
            x=r * np.cos(label_angle),
            y=r * np.sin(label_angle),
            text=ring_name,
            text_font_size="22pt",
            text_color=INK_SOFT,
            text_font_style="bold",
            text_align="center",
            text_baseline="middle",
            background_fill_color=ELEVATED_BG,
            background_fill_alpha=0.85,
        )
    )

# Sector header labels along the outer edge
for i, sector_name in enumerate(sectors):
    mid_angle = (sector_starts[i] + sector_ends[i]) / 2
    label_r = ring_outer[-1] + 45
    x_pos = label_r * np.cos(mid_angle)
    y_pos = label_r * np.sin(mid_angle)
    cos_val = np.cos(mid_angle)
    text_align = "center" if abs(cos_val) < 0.3 else ("left" if cos_val > 0 else "right")
    p.add_layout(
        Label(
            x=x_pos,
            y=y_pos,
            text=sector_name,
            text_font_size="26pt",
            text_color=sector_colors[i],
            text_font_style="bold",
            text_align=text_align,
            text_baseline="middle",
        )
    )

# Precompute item positions
groups: dict = defaultdict(list)
for idx, (_name, ring_idx, sector_idx) in enumerate(items):
    groups[(ring_idx, sector_idx)].append(idx)

xs, ys, colors, sizes, names, ring_names, sector_names = [], [], [], [], [], [], []

for idx, (name, ring_idx, sector_idx) in enumerate(items):
    group = groups[(ring_idx, sector_idx)]
    pos_in_group = group.index(idx)
    n_in_group = len(group)

    s_start = sector_starts[sector_idx]
    margin = sector_width * 0.15  # wider margin reduces crowding near sector edges
    usable_start = s_start + margin
    usable_end = sector_ends[sector_idx] - margin

    if n_in_group == 1:
        angle = (usable_start + usable_end) / 2
    else:
        angle = usable_start + (usable_end - usable_start) * pos_in_group / (n_in_group - 1)

    r_base = ring_mid[ring_idx]
    ring_hw = (ring_outer[ring_idx] - ring_inner[ring_idx]) / 2
    r = r_base + np.random.uniform(-ring_hw * 0.35, ring_hw * 0.35)

    x = r * np.cos(angle)
    y = r * np.sin(angle)

    xs.append(x)
    ys.append(y)
    colors.append(sector_colors[sector_idx])
    sizes.append(ring_marker_sizes[ring_idx])
    names.append(name)
    ring_names.append(rings[ring_idx])
    sector_names.append(sectors[sector_idx])

    # Label placement: alternate inward/outward in crowded inner rings
    base_offsets = [26, 20, 16, 13]
    if ring_idx == 0 and n_in_group > 1:
        direction = 1 if pos_in_group % 2 == 0 else -0.6
        label_r_offset = base_offsets[ring_idx] * direction
    else:
        label_r_offset = base_offsets[ring_idx]

    lx = x + label_r_offset * np.cos(angle)
    ly = y + label_r_offset * np.sin(angle)

    cos_val = np.cos(angle)
    text_align = "center" if abs(cos_val) < 0.3 else ("left" if cos_val > 0 else "right")
    sin_val = np.sin(angle)
    text_baseline = "middle" if abs(sin_val) < 0.3 else ("bottom" if sin_val > 0 else "top")

    p.add_layout(
        Label(
            x=lx,
            y=ly,
            text=name,
            text_font_size="16pt",
            text_color=INK,
            text_align=text_align,
            text_baseline=text_baseline,
        )
    )

# Scatter markers per sector (needed for per-sector legend items)
legend_items_list = []
for si, sector_name in enumerate(sectors):
    indices = [i for i, (_, _, sec_idx) in enumerate(items) if sec_idx == si]
    sector_source = ColumnDataSource(
        data={
            "x": [xs[i] for i in indices],
            "y": [ys[i] for i in indices],
            "color": [colors[i] for i in indices],
            "size": [sizes[i] for i in indices],
            "name": [names[i] for i in indices],
            "ring": [ring_names[i] for i in indices],
            "sector": [sector_names[i] for i in indices],
        }
    )
    renderer = p.scatter(
        "x",
        "y",
        source=sector_source,
        size="size",
        fill_color="color",
        line_color=PAGE_BG,  # theme-adaptive marker edge
        line_width=2.5,
        alpha=0.9,
    )
    legend_items_list.append(LegendItem(label=sector_name, renderers=[renderer]))

# HoverTool — Bokeh's distinctive interactive feature
hover = HoverTool(
    tooltips=[("Technology", "@name"), ("Horizon", "@ring"), ("Sector", "@sector")], point_policy="snap_to_data"
)
p.add_tools(hover)

# Legend inside the figure, placed in the upper-right gap area
legend = Legend(
    items=legend_items_list,
    location="top_right",
    label_text_font_size="22pt",
    label_text_color=INK_SOFT,
    glyph_height=32,
    glyph_width=32,
    spacing=16,
    padding=22,
    background_fill_color=ELEVATED_BG,
    background_fill_alpha=0.92,
    border_line_color=INK_SOFT,
    border_line_width=1.5,
)
p.add_layout(legend)  # inside figure, not side panel — fits within 2400×2400 canvas

# Save interactive HTML
output_file(f"plot-{THEME}.html", title="radar-innovation-timeline · python · bokeh · anyplot.ai")
save(p)

# Screenshot with headless Chrome (avoids export_png / chromedriver snap issues)
opts = Options()
for arg in (
    "--headless=new",
    "--no-sandbox",
    "--disable-dev-shm-usage",
    "--disable-gpu",
    f"--window-size={W},{H + 200}",  # outer window larger; CDP overrides inner viewport
    "--hide-scrollbars",
):
    opts.add_argument(arg)
driver = webdriver.Chrome(options=opts)
# Force exact viewport via CDP — set_window_size sets the outer window, which
# leaves the inner viewport ~139px shorter than requested on this environment.
driver.execute_cdp_cmd(
    "Emulation.setDeviceMetricsOverride", {"width": W, "height": H, "deviceScaleFactor": 1, "mobile": False}
)
driver.get(f"file://{Path(f'plot-{THEME}.html').resolve()}")
time.sleep(3)  # let bokeh's JS render the canvas
driver.save_screenshot(f"plot-{THEME}.png")
driver.quit()
Runnable source as JSON, for any HTTP client: https://api.anyplot.ai/specs/radar-innovation-timeline/bokeh/code. Any spec id and library id listed in llms-full.txt fit the same URL shape; every URL below is complete and callable.
{
  "spec_id": "radar-innovation-timeline",
  "language": "python",
  "library": "bokeh",
  "page": "https://anyplot.ai/radar-innovation-timeline/python/bokeh",
  "hub": "https://anyplot.ai/radar-innovation-timeline",
  "code_json": "https://api.anyplot.ai/specs/radar-innovation-timeline/bokeh/code",
  "spec_json": "https://api.anyplot.ai/specs/radar-innovation-timeline",
  "render_light_png": "https://storage.googleapis.com/anyplot-images/plots/radar-innovation-timeline/python/bokeh/plot-light.png",
  "render_dark_png": "https://storage.googleapis.com/anyplot-images/plots/radar-innovation-timeline/python/bokeh/plot-dark.png",
  "interactive_light_html": "https://storage.googleapis.com/anyplot-images/plots/radar-innovation-timeline/python/bokeh/plot-light.html",
  "interactive_dark_html": "https://storage.googleapis.com/anyplot-images/plots/radar-innovation-timeline/python/bokeh/plot-dark.html",
  "quality_score": 87.0,
  "license": "MIT",
  "guide": "https://anyplot.ai/llms.txt"
}
Part of Innovation Radar with Time-Horizon Rings on anyplot.ai.