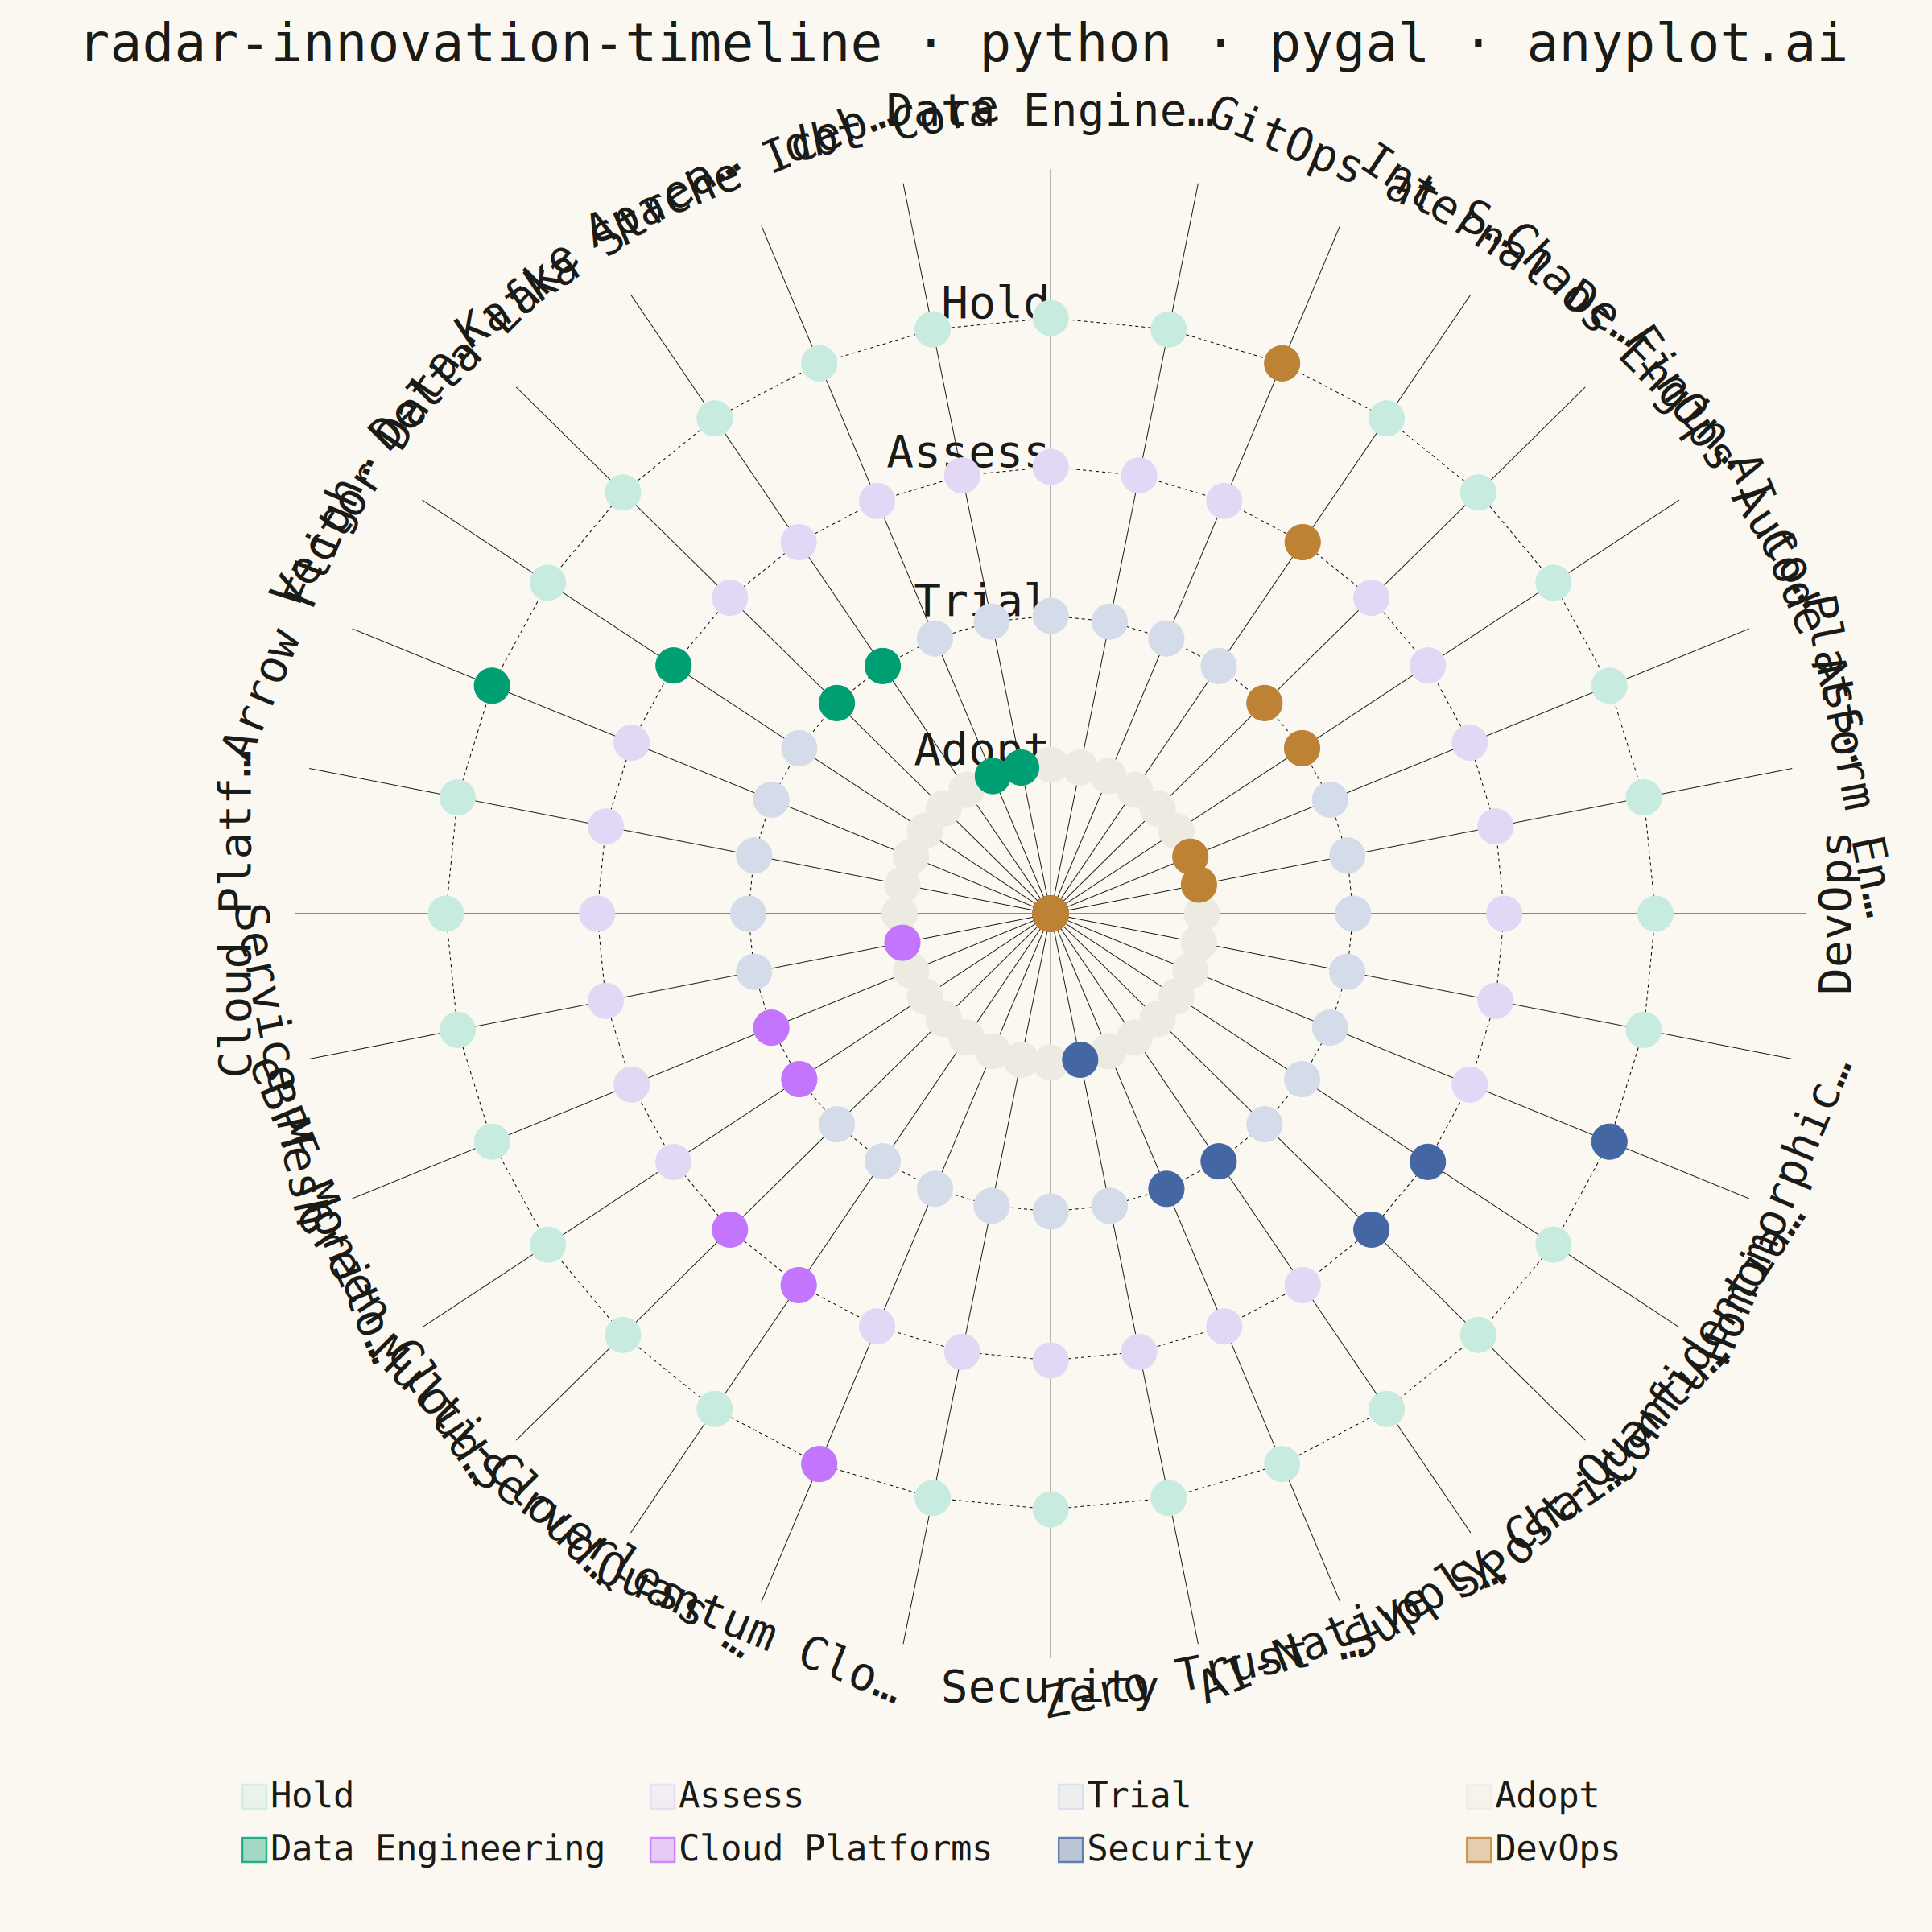
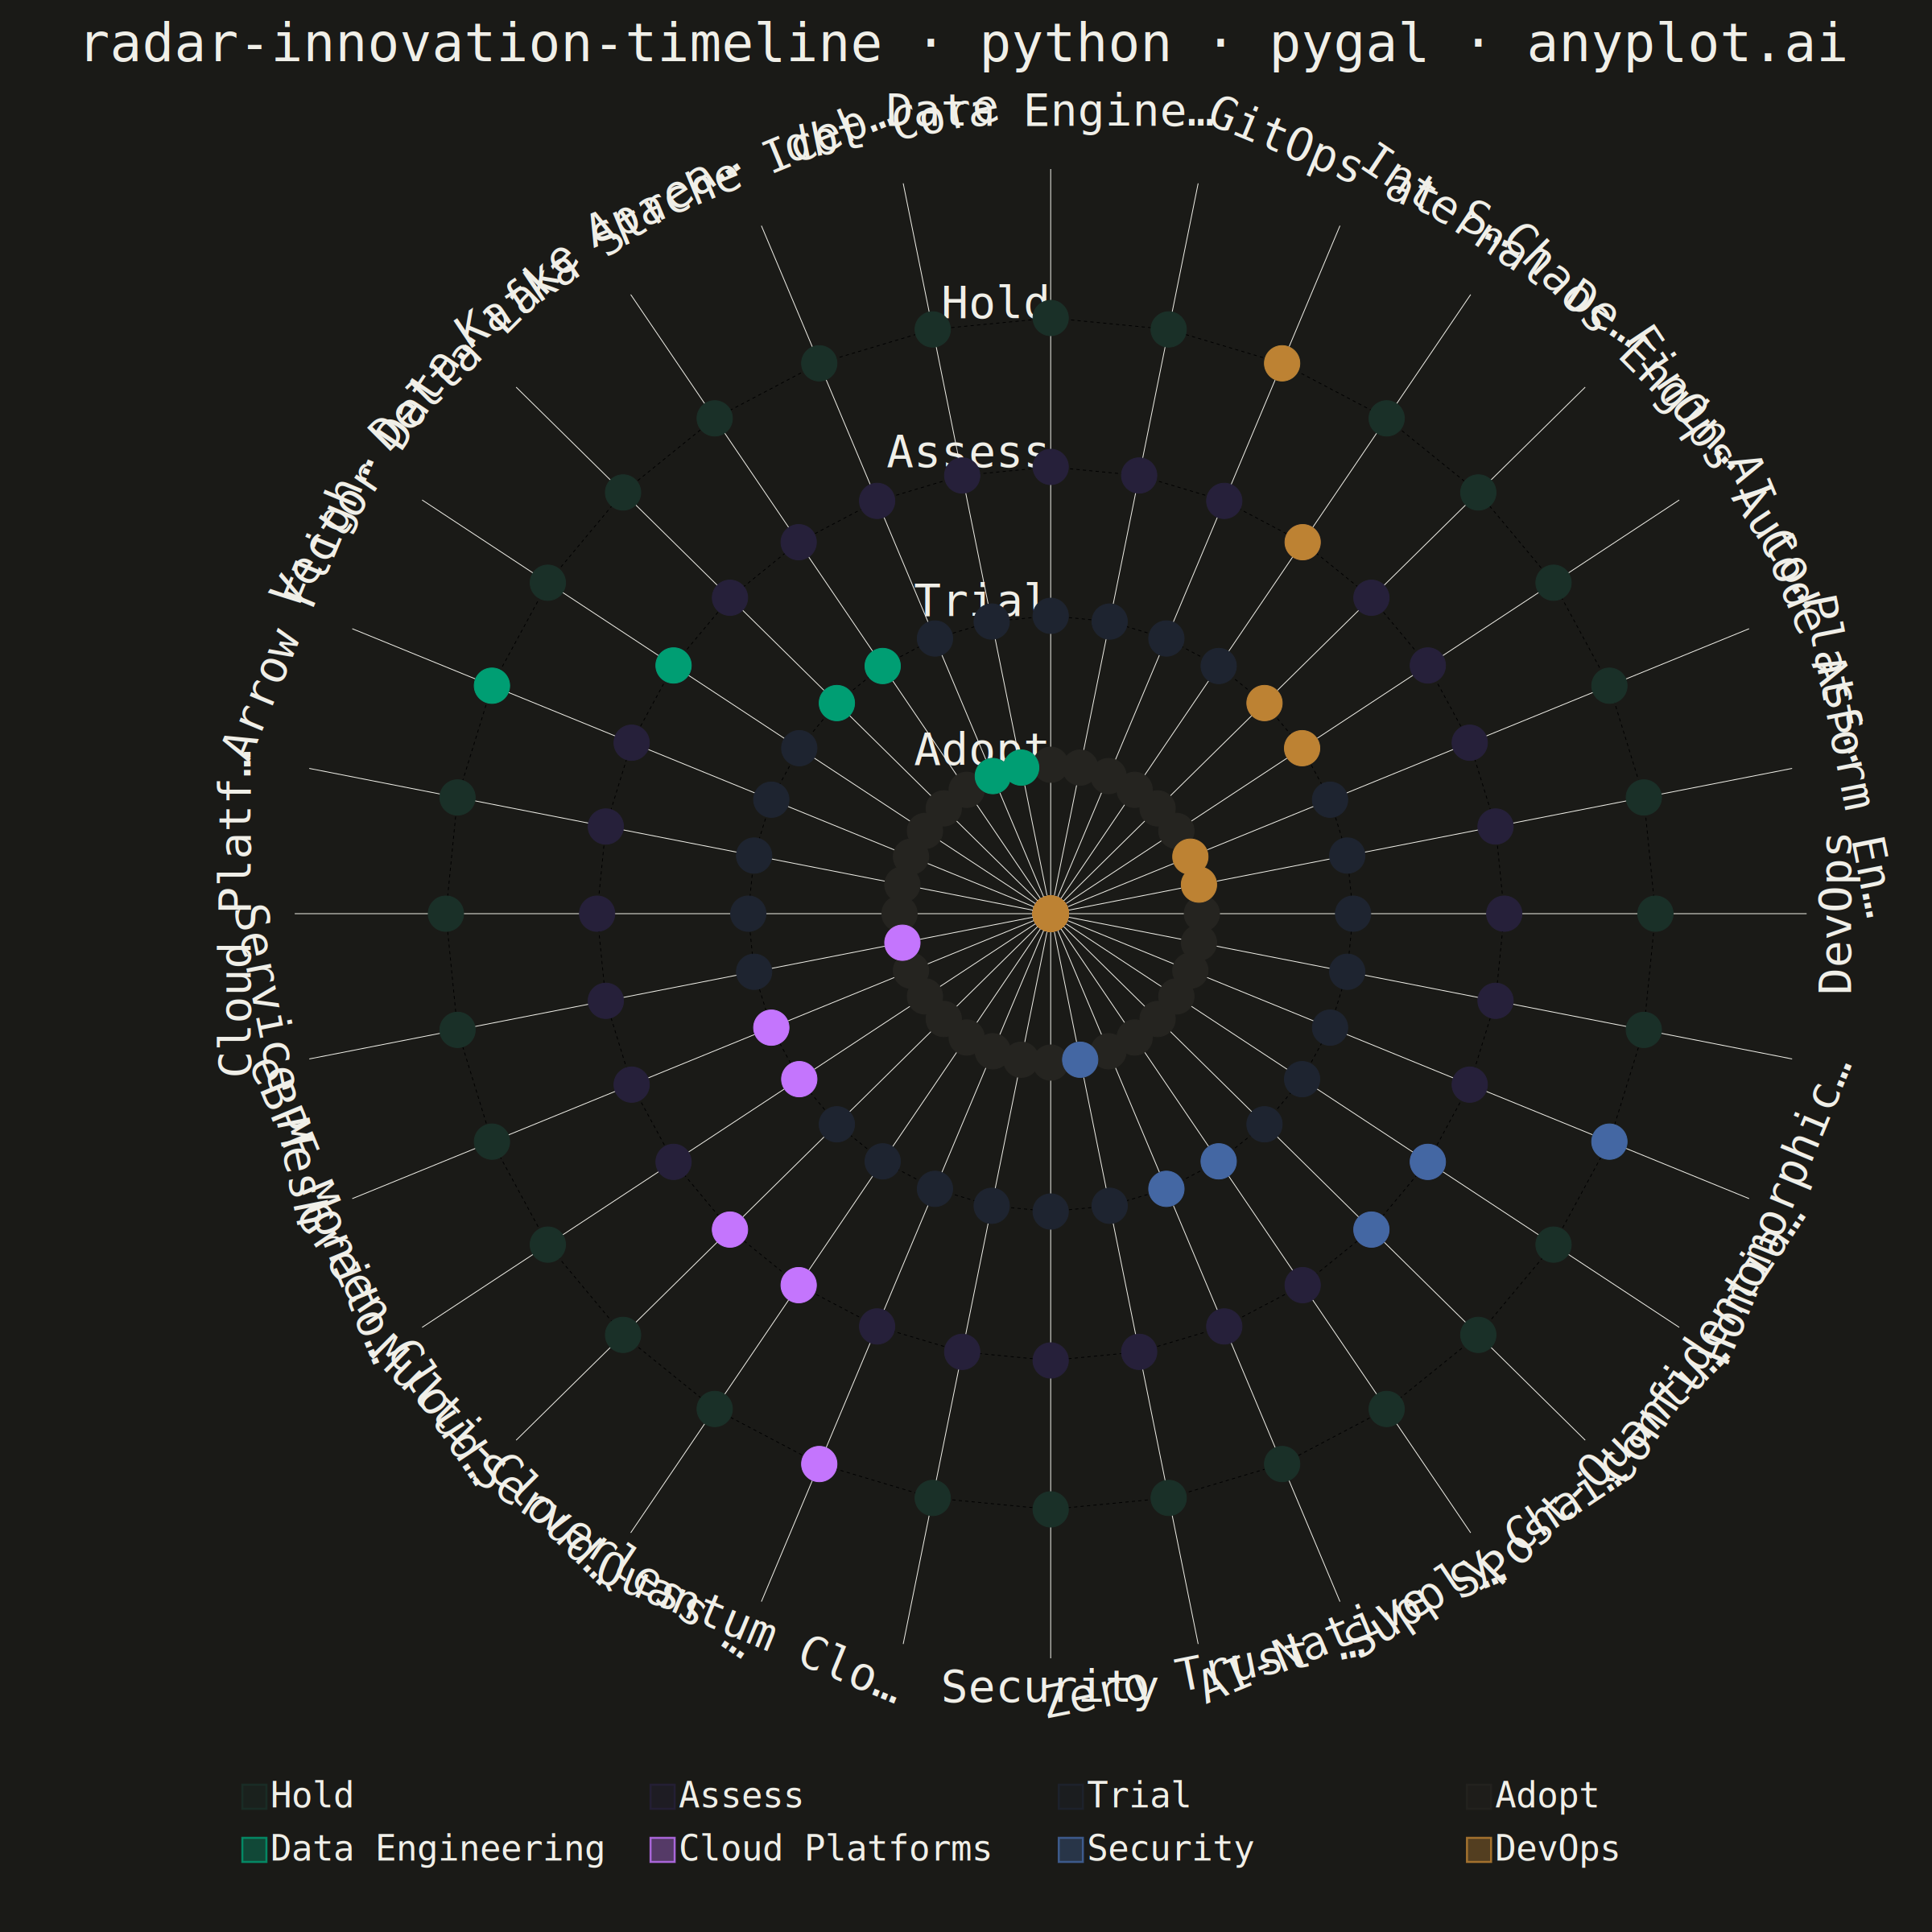
A radial chart that maps innovations, technologies, or trends onto concentric rings representing time horizons and angular sectors representing thematic categories. Inner rings represent near-term items (e.g., "Now", "Next 6 months") while outer rings represent longer-term or emerging trends (e.g., "2-5 years", "Future"). Each item is placed as a labeled point within its sector and ring, with distinct markers or colors encoding categories. Inspired by ThoughtWorks Technology Radar and similar strategic planning visualizations.
""" anyplot.ai
radar-innovation-timeline: Innovation Radar with Time-Horizon Rings
Library: pygal 3.1.0 | Python 3.13.13
Quality: 73/100 | Updated: 2026-05-29
"""

import os
import sys


# Prevent this file (pygal.py) from shadowing the pygal package on sys.path
_this_dir = os.path.abspath(os.path.dirname(__file__))
sys.path[:] = [p for p in sys.path if os.path.realpath(p or ".") != _this_dir]

import pygal
from pygal.style import Style


# Theme tokens
THEME = os.getenv("ANYPLOT_THEME", "light")
PAGE_BG = "#FAF8F1" if THEME == "light" else "#1A1A17"
INK = "#1A1A17" if THEME == "light" else "#F0EFE8"
INK_MUTED = "#6B6A63" if THEME == "light" else "#A8A79F"

# Subtle ring zone fill colors — drawn first (positions 0–3 in color_sequence),
# then Imprint sector colors at positions 4–7.
# Light theme: warm tints graduating from pale green (Adopt) to off-white (Hold)
# Dark theme: dark tints graduating from dark green to near-background
if THEME == "light":
    zone_colors = ("#C8EBE0", "#E2D8F5", "#D4DCEA", "#EDEAE2")  # Adopt/Trial/Assess/Hold
else:
    zone_colors = ("#1A3028", "#26203A", "#1E2430", "#252420")  # Adopt/Trial/Assess/Hold

# Imprint palette — first 4 positions mapped to sectors (positions 4–7 in full palette)
sectors = ["Data Engineering", "Cloud Platforms", "Security", "DevOps"]
sector_colors_tuple = ("#009E73", "#C475FD", "#4467A3", "#BD8233")
sector_colors = dict(zip(sectors, sector_colors_tuple, strict=False))
ring_values = {"Adopt": 1, "Trial": 2, "Assess": 3, "Hold": 4}
rings_ordered = ["Adopt", "Trial", "Assess", "Hold"]

# Data — 24 innovations across 4 sectors and 4 time-horizon rings
innovations = [
    ("dbt Core", "Data Engineering", "Adopt"),
    ("Apache Iceberg", "Data Engineering", "Adopt"),
    ("Kafka Streams", "Data Engineering", "Trial"),
    ("Delta Lake", "Data Engineering", "Trial"),
    ("Vector Databases", "Data Engineering", "Assess"),
    ("Arrow Flight RPC", "Data Engineering", "Hold"),
    ("Service Mesh", "Cloud Platforms", "Adopt"),
    ("eBPF Monitoring", "Cloud Platforms", "Trial"),
    ("Green Cloud APIs", "Cloud Platforms", "Trial"),
    ("Multi-Cloud Orch.", "Cloud Platforms", "Assess"),
    ("Serverless Edge", "Cloud Platforms", "Assess"),
    ("Quantum Cloud", "Cloud Platforms", "Hold"),
    ("Zero Trust Network", "Security", "Adopt"),
    ("AI-Native SOC", "Security", "Trial"),
    ("Supply Chain Sec.", "Security", "Trial"),
    ("Post-Quantum Crypto", "Security", "Assess"),
    ("Confidential Compute", "Security", "Assess"),
    ("Homomorphic Encrypt.", "Security", "Hold"),
    ("Platform Engineering", "DevOps", "Adopt"),
    ("AI Code Assistants", "DevOps", "Adopt"),
    ("FinOps Automation", "DevOps", "Trial"),
    ("Chaos Engineering", "DevOps", "Trial"),
    ("Internal Dev Portal", "DevOps", "Assess"),
    ("GitOps at Scale", "DevOps", "Hold"),
]

# Sort items within each sector by ring (near-term first for visual clarity)
sector_items = {s: [] for s in sectors}
for name, sector, ring in innovations:
    sector_items[sector].append((name, ring))
for s in sectors:
    sector_items[s].sort(key=lambda x: ring_values[x[1]])

# Angular layout: [header_slot, item_slots x6, gap_slot] per sector = 8 slots × 4 = 32
slots_per_sector = 8
total_slots = len(sectors) * slots_per_sector

x_labels = []
item_placements = []
for sector_idx, sector in enumerate(sectors):
    start_slot = sector_idx * slots_per_sector
    x_labels.append(sector)  # Sector header shown as major label
    for i, (name, ring) in enumerate(sector_items[sector]):
        x_labels.append(name)
        item_placements.append((name, sector, ring, start_slot + 1 + i))
    x_labels.append("")  # Gap slot between sectors

# Build series: one per sector, None for positions belonging to other sectors
series_data = {s: [None] * total_slots for s in sectors}
for name, sector, ring, slot in item_placements:
    series_data[sector][slot] = {"value": ring_values[ring], "label": name}

# Ring zone background fill series — all spokes set to ring boundary value.
# Drawn outermost-first (Hold=4) so each inner fill layers on top, creating
# distinct concentric bands: Hold → Assess → Trial → Adopt from outer to inner.
ring_zone_data = {ring: [ring_values[ring]] * total_slots for ring in rings_ordered}

# Full color sequence: zone fills first (4), then sector data colors (4)
color_sequence = zone_colors + sector_colors_tuple

title_str = "radar-innovation-timeline · python · pygal · anyplot.ai"
n_chars = len(title_str)
title_font_size = round(66 * 67 / n_chars) if n_chars > 67 else 66
title_font_size = max(title_font_size, 44)

custom_style = Style(
    background=PAGE_BG,
    plot_background=PAGE_BG,
    foreground=INK,
    foreground_strong=INK,
    foreground_subtle=INK_MUTED,
    colors=color_sequence,
    title_font_size=title_font_size,
    label_font_size=56,
    major_label_font_size=56,
    legend_font_size=44,
    value_font_size=36,
    opacity=0.35,  # Low opacity so zone fills are subtle background tints
    opacity_hover=0.7,
    stroke_width=2.5,
)

chart = pygal.Radar(
    width=2400,
    height=2400,
    style=custom_style,
    title=title_str,
    show_legend=True,
    legend_at_bottom=True,
    legend_at_bottom_columns=4,
    legend_box_size=30,
    fill=True,  # fill=True enables zone fills; sector series dots still show on top
    stroke=False,
    show_dots=True,
    dots_size=22,
    show_y_guides=True,
    show_x_guides=False,
    range=(0, 5),
    inner_radius=0.12,
    y_labels=[
        {"value": 1, "label": "Adopt"},
        {"value": 2, "label": "Trial"},
        {"value": 3, "label": "Assess"},
        {"value": 4, "label": "Hold"},
    ],
    show_minor_x_labels=True,
    x_labels_major=sectors,
    x_label_rotation=0,
    margin_bottom=80,
    margin_left=80,
    margin_right=80,
    margin_top=60,
    truncate_label=12,
)

chart.x_labels = x_labels

# Add ring zone fills first (drawn behind sector data) — outermost (Hold) to innermost (Adopt)
for ring in reversed(rings_ordered):
    chart.add(ring, ring_zone_data[ring])

# Add sector data series on top of zone fills
for sector in sectors:
    chart.add(sector, series_data[sector])

chart.render_to_png(f"plot-{THEME}.png")
chart.render_to_file(f"plot-{THEME}.html")
Runnable source as JSON, for any HTTP client: https://api.anyplot.ai/specs/radar-innovation-timeline/pygal/code. Any spec id and library id listed in llms-full.txt fit the same URL shape; every URL below is complete and callable.
{
  "spec_id": "radar-innovation-timeline",
  "language": "python",
  "library": "pygal",
  "page": "https://anyplot.ai/radar-innovation-timeline/python/pygal",
  "hub": "https://anyplot.ai/radar-innovation-timeline",
  "code_json": "https://api.anyplot.ai/specs/radar-innovation-timeline/pygal/code",
  "spec_json": "https://api.anyplot.ai/specs/radar-innovation-timeline",
  "render_light_png": "https://storage.googleapis.com/anyplot-images/plots/radar-innovation-timeline/python/pygal/plot-light.png",
  "render_dark_png": "https://storage.googleapis.com/anyplot-images/plots/radar-innovation-timeline/python/pygal/plot-dark.png",
  "interactive_light_html": "https://storage.googleapis.com/anyplot-images/plots/radar-innovation-timeline/python/pygal/plot-light.html",
  "interactive_dark_html": "https://storage.googleapis.com/anyplot-images/plots/radar-innovation-timeline/python/pygal/plot-dark.html",
  "quality_score": 73.0,
  "license": "MIT",
  "guide": "https://anyplot.ai/llms.txt"
}
Part of Innovation Radar with Time-Horizon Rings on anyplot.ai.