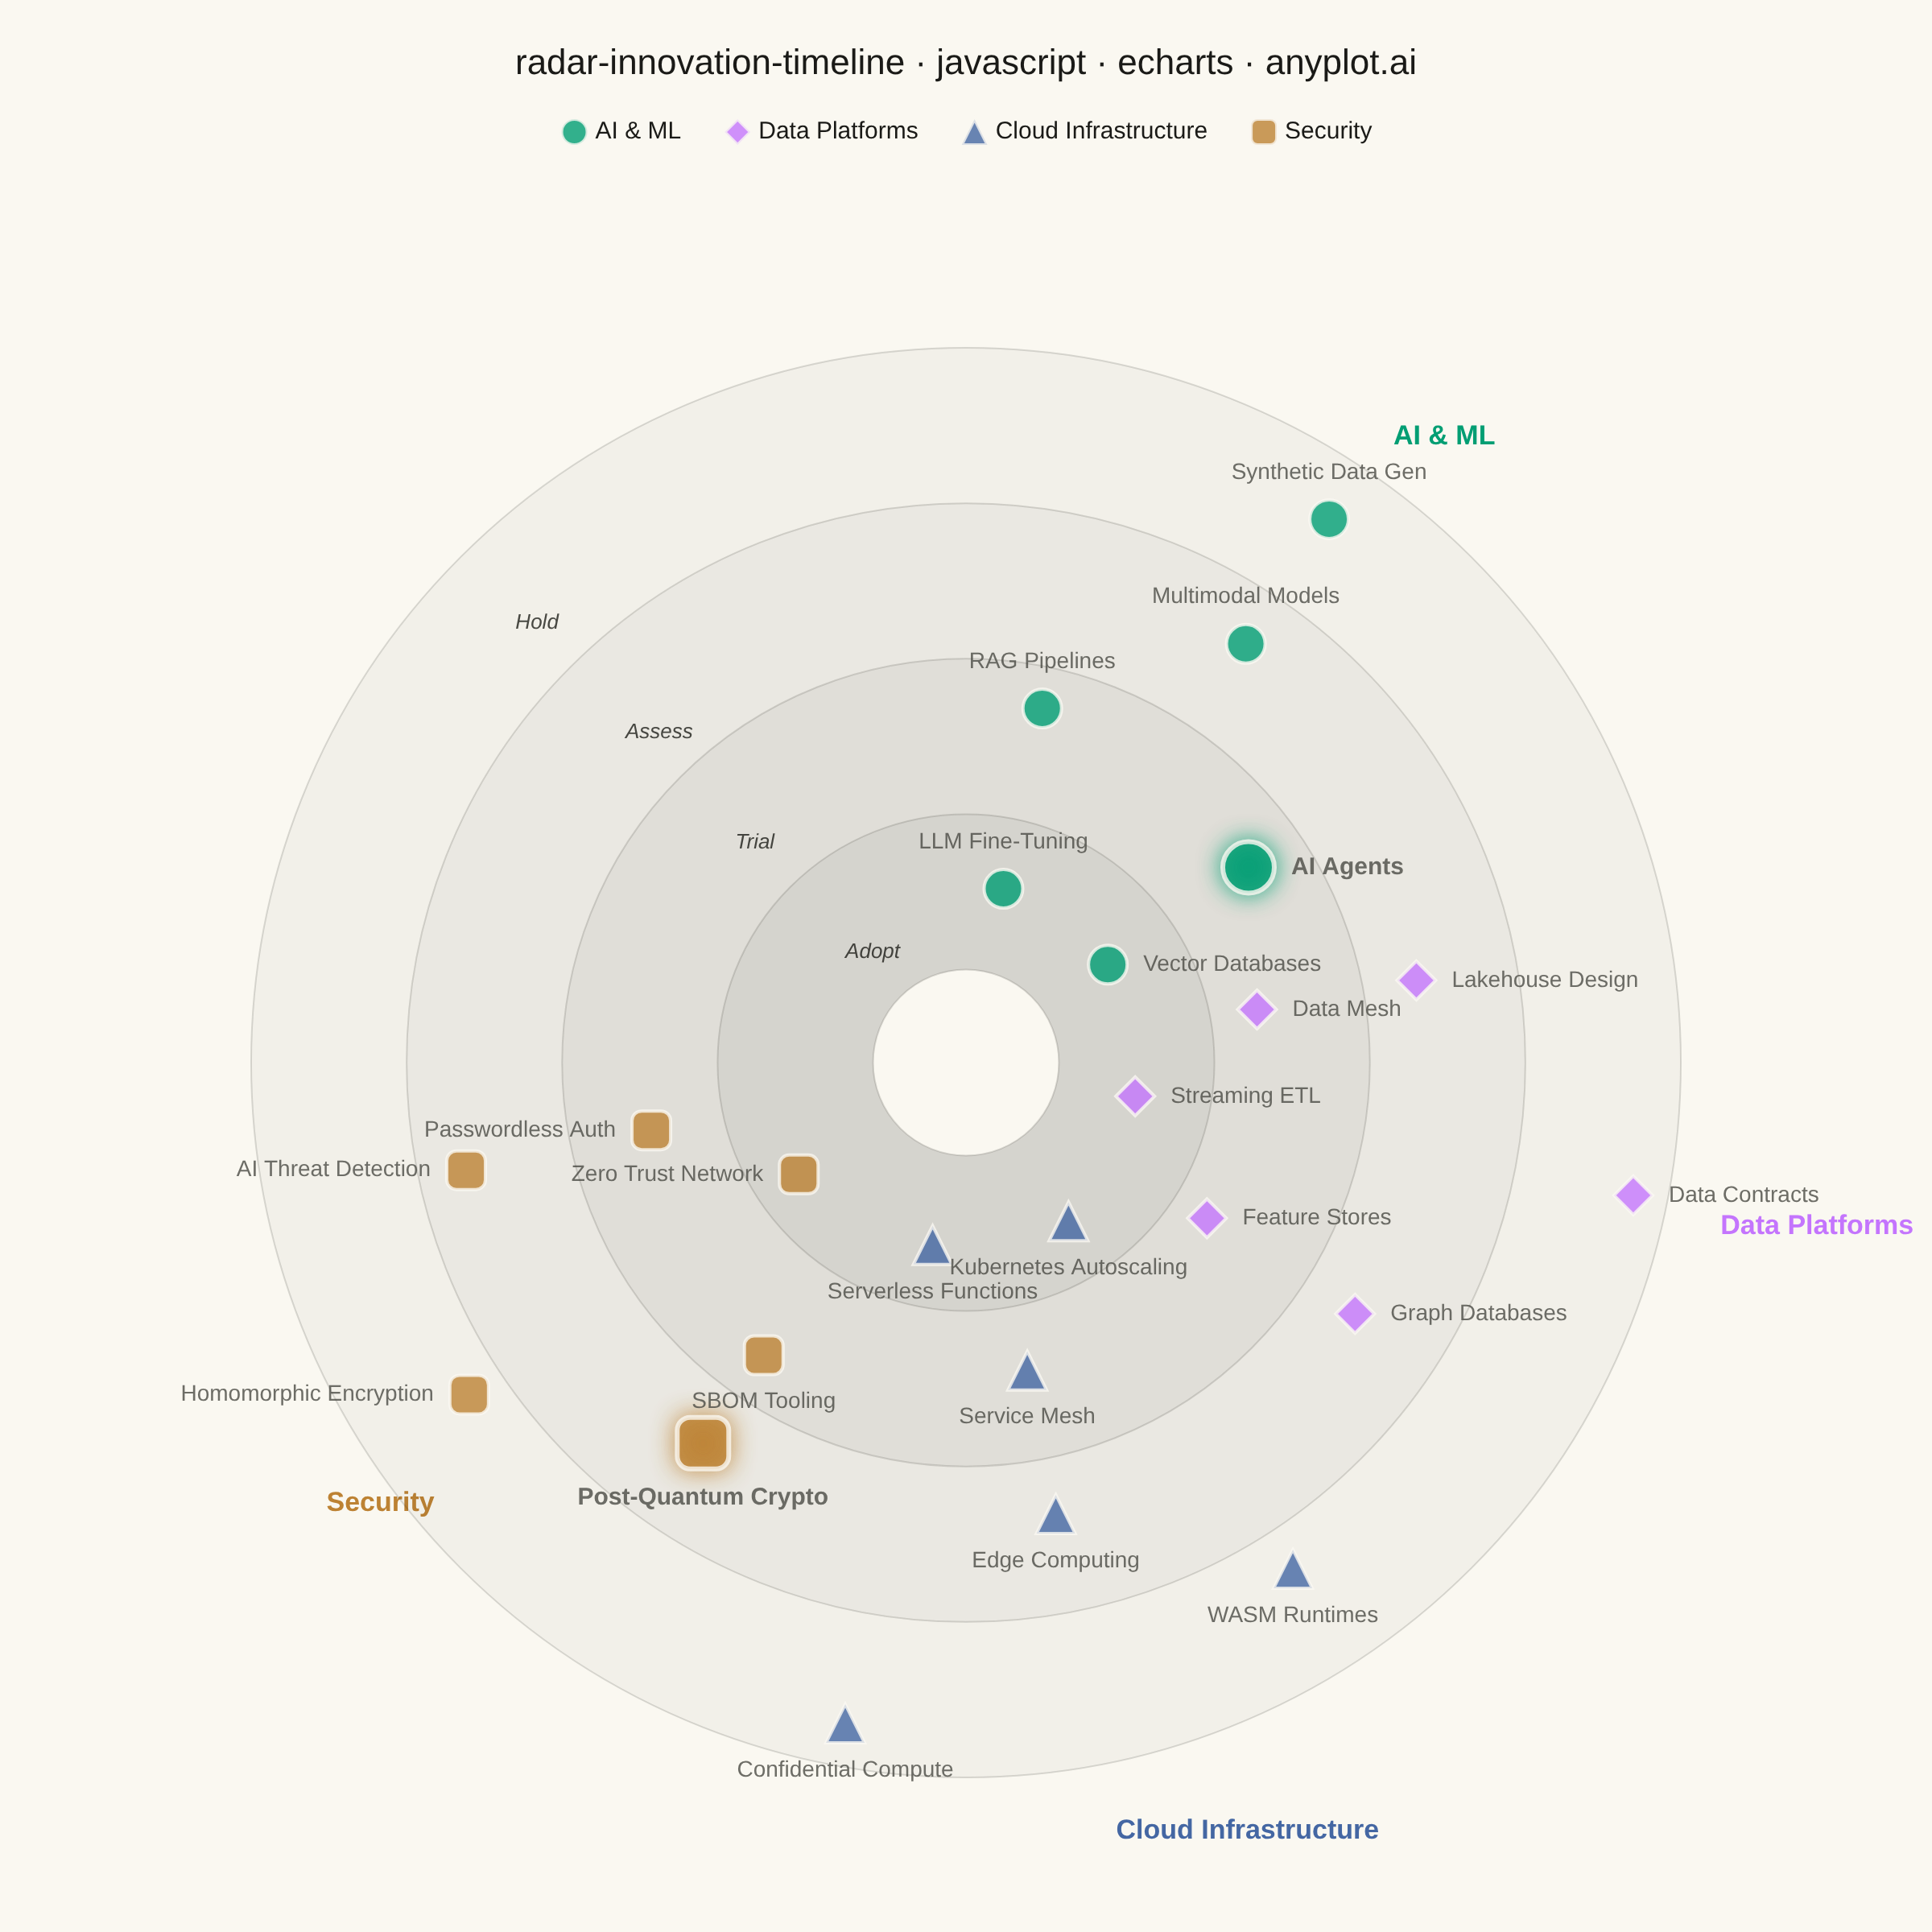
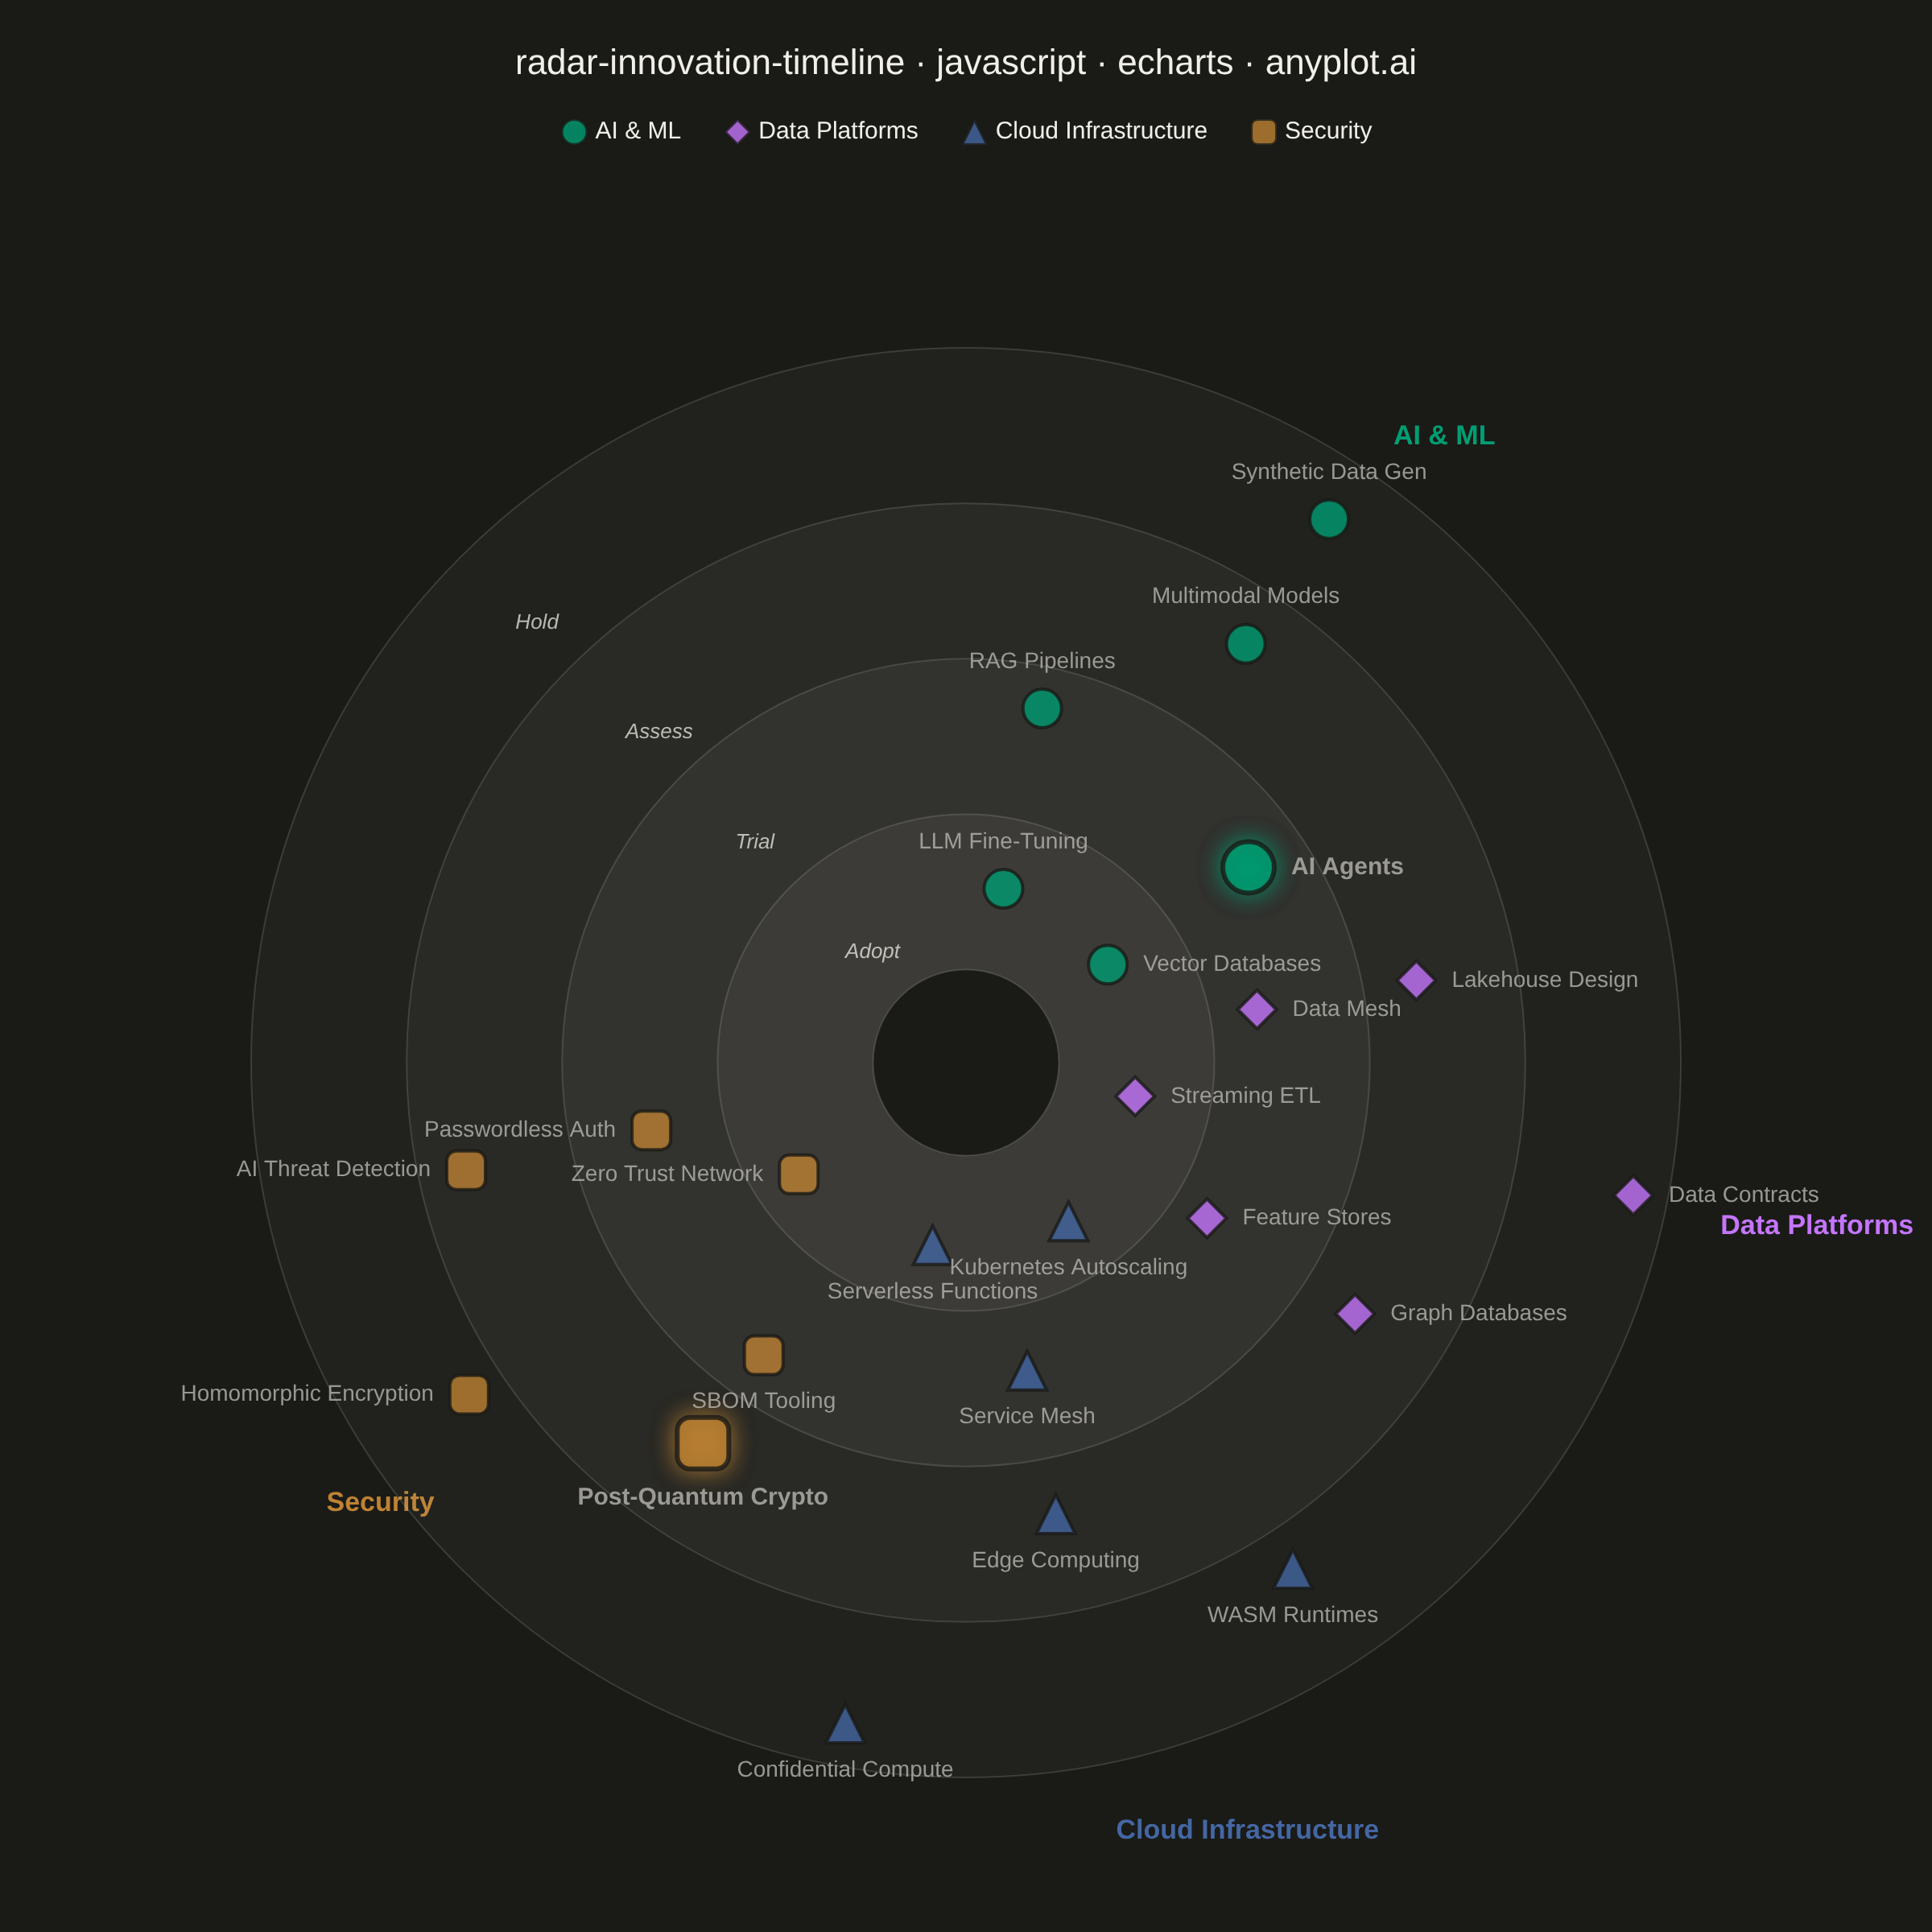
The same plot in 14 other libraries — JavaScript: Chart.js, D3.js, Highcharts, MUI X Charts; Python: Altair, Bokeh, lets-plot, Matplotlib, Plotly, plotnine, Pygal, Seaborn; R: ggplot2; Julia: Makie.jl. Compare all 15 side by side: Innovation Radar with Time-Horizon Rings in Python, R, Julia and JavaScript.
A radial chart that maps innovations, technologies, or trends onto concentric rings representing time horizons and angular sectors representing thematic categories. Inner rings represent near-term items (e.g., "Now", "Next 6 months") while outer rings represent longer-term or emerging trends (e.g., "2-5 years", "Future"). Each item is placed as a labeled point within its sector and ring, with distinct markers or colors encoding categories. Inspired by ThoughtWorks Technology Radar and similar strategic planning visualizations.
// anyplot.ai
// radar-innovation-timeline: Innovation Radar with Time-Horizon Rings
// Library: echarts 6.1.0 | JavaScript 22.23.2
// Quality: 93/100 | Created: 2026-08-26

//# anyplot-orientation: square

const t = window.ANYPLOT_TOKENS;
const size = window.ANYPLOT_SIZE;

// --- Deterministic PRNG (LCG) so radial jitter is reproducible --------------
let seed = 42;
function rand() {
  seed = (seed * 1103515245 + 12345) & 0x7fffffff;
  return seed / 0x7fffffff;
}

// --- Data: rings = adoption horizon (inner = now), sectors = theme ---------
const RINGS = ["Adopt", "Trial", "Assess", "Hold"];
const SECTORS = ["AI & ML", "Data Platforms", "Cloud Infrastructure", "Security"];
const SYMBOLS = ["circle", "diamond", "triangle", "roundRect"];

const ITEMS = [
  { name: "LLM Fine-Tuning", sector: "AI & ML", ring: "Adopt" },
  { name: "Vector Databases", sector: "AI & ML", ring: "Adopt" },
  { name: "RAG Pipelines", sector: "AI & ML", ring: "Trial" },
  { name: "AI Agents", sector: "AI & ML", ring: "Trial" },
  { name: "Multimodal Models", sector: "AI & ML", ring: "Assess" },
  { name: "Synthetic Data Gen", sector: "AI & ML", ring: "Hold" },
  { name: "Streaming ETL", sector: "Data Platforms", ring: "Adopt" },
  { name: "Data Mesh", sector: "Data Platforms", ring: "Trial" },
  { name: "Feature Stores", sector: "Data Platforms", ring: "Trial" },
  { name: "Lakehouse Design", sector: "Data Platforms", ring: "Assess" },
  { name: "Graph Databases", sector: "Data Platforms", ring: "Assess" },
  { name: "Data Contracts", sector: "Data Platforms", ring: "Hold" },
  { name: "Kubernetes Autoscaling", sector: "Cloud Infrastructure", ring: "Adopt" },
  { name: "Serverless Functions", sector: "Cloud Infrastructure", ring: "Adopt" },
  { name: "Service Mesh", sector: "Cloud Infrastructure", ring: "Trial" },
  { name: "Edge Computing", sector: "Cloud Infrastructure", ring: "Assess" },
  { name: "WASM Runtimes", sector: "Cloud Infrastructure", ring: "Hold" },
  { name: "Confidential Compute", sector: "Cloud Infrastructure", ring: "Hold" },
  { name: "Zero Trust Network", sector: "Security", ring: "Adopt" },
  { name: "SBOM Tooling", sector: "Security", ring: "Trial" },
  { name: "Passwordless Auth", sector: "Security", ring: "Trial" },
  { name: "Post-Quantum Crypto", sector: "Security", ring: "Assess" },
  { name: "AI Threat Detection", sector: "Security", ring: "Assess" },
  { name: "Homomorphic Encryption", sector: "Security", ring: "Hold" },
];

// A couple of items get a small visual accent (bigger halo-bordered marker +
// bold label) so the chart points toward a specific insight beyond the base
// ring/sector position encoding: the fastest-advancing item, and one facing
// a looming regulatory deadline.
const HIGHLIGHTS = new Set(["AI Agents", "Post-Quantum Crypto"]);

// --- Angular layout: three-quarter circle, the remaining 90° carries the ---
// --- legend + ring labels instead of a sector, per the spec's guidance -----
const SWEEP = 270;
const SECTOR_WIDTH = SWEEP / SECTORS.length;
const ringIndexOf = (ring) => RINGS.indexOf(ring);

const groups = new Map();
ITEMS.forEach((item) => {
  const key = `${item.sector}|${item.ring}`;
  if (!groups.has(key)) groups.set(key, []);
  groups.get(key).push(item);
});

ITEMS.forEach((item) => {
  const sectorIdx = SECTORS.indexOf(item.sector);
  const siblings = groups.get(`${item.sector}|${item.ring}`);
  const pos = siblings.indexOf(item);
  const n = siblings.length;
  const margin = SECTOR_WIDTH * 0.18;
  const usable = SECTOR_WIDTH - margin * 2;
  const spread = n === 1 ? usable / 2 : (pos / (n - 1)) * usable;
  item.angle = sectorIdx * SECTOR_WIDTH + margin + spread;
  const band = ringIndexOf(item.ring);
  item.radius = band + 0.22 + rand() * 0.56; // stay clear of ring boundaries
});

// --- Polar geometry, shared between the ECharts polar grid and the manual --
// --- pixel math used to place the sector/ring text labels ------------------
const CENTER_X = size.width * 0.5;
const CENTER_Y = size.height * 0.55;
const OUTER_R = Math.min(size.width, size.height) * 0.37;
const INNER_R = OUTER_R * 0.13;

function polarPoint(radiusValue, angleValue) {
  const std = ((90 - angleValue) * Math.PI) / 180;
  const r = INNER_R + (radiusValue / 4) * (OUTER_R - INNER_R);
  return [CENTER_X + r * Math.cos(std), CENTER_Y - r * Math.sin(std)];
}

// labels point outward from the ring/sector they belong to instead of all
// defaulting to one side, so they stay legible around the full sweep
function outwardLabelPosition(angleValue) {
  const std = ((90 - angleValue) * Math.PI) / 180;
  const dx = Math.cos(std);
  const dy = Math.sin(std);
  if (Math.abs(dx) > Math.abs(dy)) return dx >= 0 ? "right" : "left";
  return dy >= 0 ? "top" : "bottom";
}

// text-graphic labels near the canvas edge must anchor away from that edge
// (not centered on it) or long names clip past the frame
function edgeSafeAlign(angleValue) {
  const std = ((90 - angleValue) * Math.PI) / 180;
  const dx = Math.cos(std);
  const dy = Math.sin(std);
  return {
    align: dx > 0.25 ? "right" : dx < -0.25 ? "left" : "center",
    verticalAlign: dy > 0.25 ? "top" : dy < -0.25 ? "bottom" : "middle",
  };
}

// --- Subtle per-ring background, fading from the near-term core outward ----
const inkRgb = t.theme === "light" ? "26,26,23" : "240,239,232";
const ringFills = [0.16, 0.115, 0.07, 0.035].map((a) => `rgba(${inkRgb},${a})`);

// --- Sector header + ring labels, placed via graphic elements so they can --
// --- sit beyond the axis's own radius domain and read outward -------------
const sectorLabels = SECTORS.map((sector, i) => {
  const angle = i * SECTOR_WIDTH + SECTOR_WIDTH / 2;
  const [x, y] = polarPoint(4.35, angle);
  return {
    type: "text",
    left: x,
    top: y,
    style: {
      text: sector,
      fill: t.palette[i],
      fontSize: 17,
      fontWeight: 600,
      ...edgeSafeAlign(angle),
    },
  };
});

const ringLabels = RINGS.map((ring, i) => {
  const angle = 315; // mid-gap, the empty quarter
  const [x, y] = polarPoint(i + 0.5, angle);
  return {
    type: "text",
    left: x,
    top: y,
    style: {
      text: ring,
      fill: t.inkSoft,
      fontSize: 13,
      fontStyle: "italic",
      ...edgeSafeAlign(angle),
    },
  };
});

// --- One series per sector so color + legend map 1:1 to the category -------
const series = SECTORS.map((sector, i) => ({
  name: sector,
  type: "scatter",
  coordinateSystem: "polar",
  symbol: SYMBOLS[i % SYMBOLS.length],
  symbolSize: 24,
  itemStyle: { color: t.palette[i], borderColor: t.pageBg, borderWidth: 2 },
  label: {
    show: true,
    formatter: (p) => p.data.name,
    distance: 9,
    fontSize: 14,
    color: t.inkSoft,
  },
  labelLayout: { hideOverlap: true },
  data: ITEMS.filter((item) => item.sector === sector).map((item) => {
    const highlighted = HIGHLIGHTS.has(item.name);
    return {
      name: item.name,
      value: [item.radius, item.angle],
      symbolSize: highlighted ? 32 : 24,
      itemStyle: highlighted
        ? { borderWidth: 3, shadowBlur: 14, shadowColor: t.palette[i] }
        : undefined,
      label: {
        position: outwardLabelPosition(item.angle),
        fontWeight: highlighted ? 700 : 400,
        fontSize: highlighted ? 15 : 14,
      },
    };
  }),
}));

// --- Init --------------------------------------------------------------------
const chart = echarts.init(document.getElementById("container"));

// --- Option -----------------------------------------------------------------
chart.setOption({
  animation: false,
  color: t.palette,
  backgroundColor: "transparent",
  title: {
    text: "radar-innovation-timeline · javascript · echarts · anyplot.ai",
    left: "center",
    top: 24,
    textStyle: { color: t.ink, fontSize: 22, fontWeight: 500 },
  },
  legend: {
    data: SECTORS,
    orient: "horizontal",
    left: "center",
    top: 68,
    itemWidth: 16,
    itemHeight: 16,
    itemGap: 26,
    textStyle: { color: t.ink, fontSize: 15 },
  },
  tooltip: {
    trigger: "item",
    formatter: (p) => `${p.data.name}<br/>${p.seriesName} · ${RINGS[Math.floor(p.data.value[0])]}`,
  },
  polar: { center: [CENTER_X, CENTER_Y], radius: [INNER_R, OUTER_R] },
  angleAxis: {
    type: "value",
    min: 0,
    max: 360,
    startAngle: 90,
    clockwise: true,
    axisLine: { show: false },
    axisTick: { show: false },
    axisLabel: { show: false },
    splitLine: { show: false },
  },
  radiusAxis: {
    type: "value",
    min: 0,
    max: 4,
    interval: 1,
    axisLine: { show: false },
    axisTick: { show: false },
    axisLabel: { show: false },
    splitLine: { lineStyle: { color: t.grid } },
    splitArea: { show: true, areaStyle: { color: ringFills } },
  },
  graphic: [...sectorLabels, ...ringLabels],
  series,
});
Runnable source as JSON, for any HTTP client: https://api.anyplot.ai/specs/radar-innovation-timeline/echarts/code. Any spec id and library id listed in llms-full.txt fit the same URL shape; every URL below is complete and callable.
{
  "spec_id": "radar-innovation-timeline",
  "language": "javascript",
  "library": "echarts",
  "page": "https://anyplot.ai/radar-innovation-timeline/javascript/echarts",
  "hub": "https://anyplot.ai/radar-innovation-timeline",
  "code_json": "https://api.anyplot.ai/specs/radar-innovation-timeline/echarts/code",
  "spec_json": "https://api.anyplot.ai/specs/radar-innovation-timeline",
  "render_light_png": "https://storage.googleapis.com/anyplot-images/plots/radar-innovation-timeline/javascript/echarts/plot-light.png",
  "render_dark_png": "https://storage.googleapis.com/anyplot-images/plots/radar-innovation-timeline/javascript/echarts/plot-dark.png",
  "interactive_light_html": "https://storage.googleapis.com/anyplot-images/plots/radar-innovation-timeline/javascript/echarts/plot-light.html",
  "interactive_dark_html": "https://storage.googleapis.com/anyplot-images/plots/radar-innovation-timeline/javascript/echarts/plot-dark.html",
  "quality_score": 93.0,
  "license": "MIT",
  "guide": "https://anyplot.ai/llms.txt"
}
Part of Innovation Radar with Time-Horizon Rings on anyplot.ai.