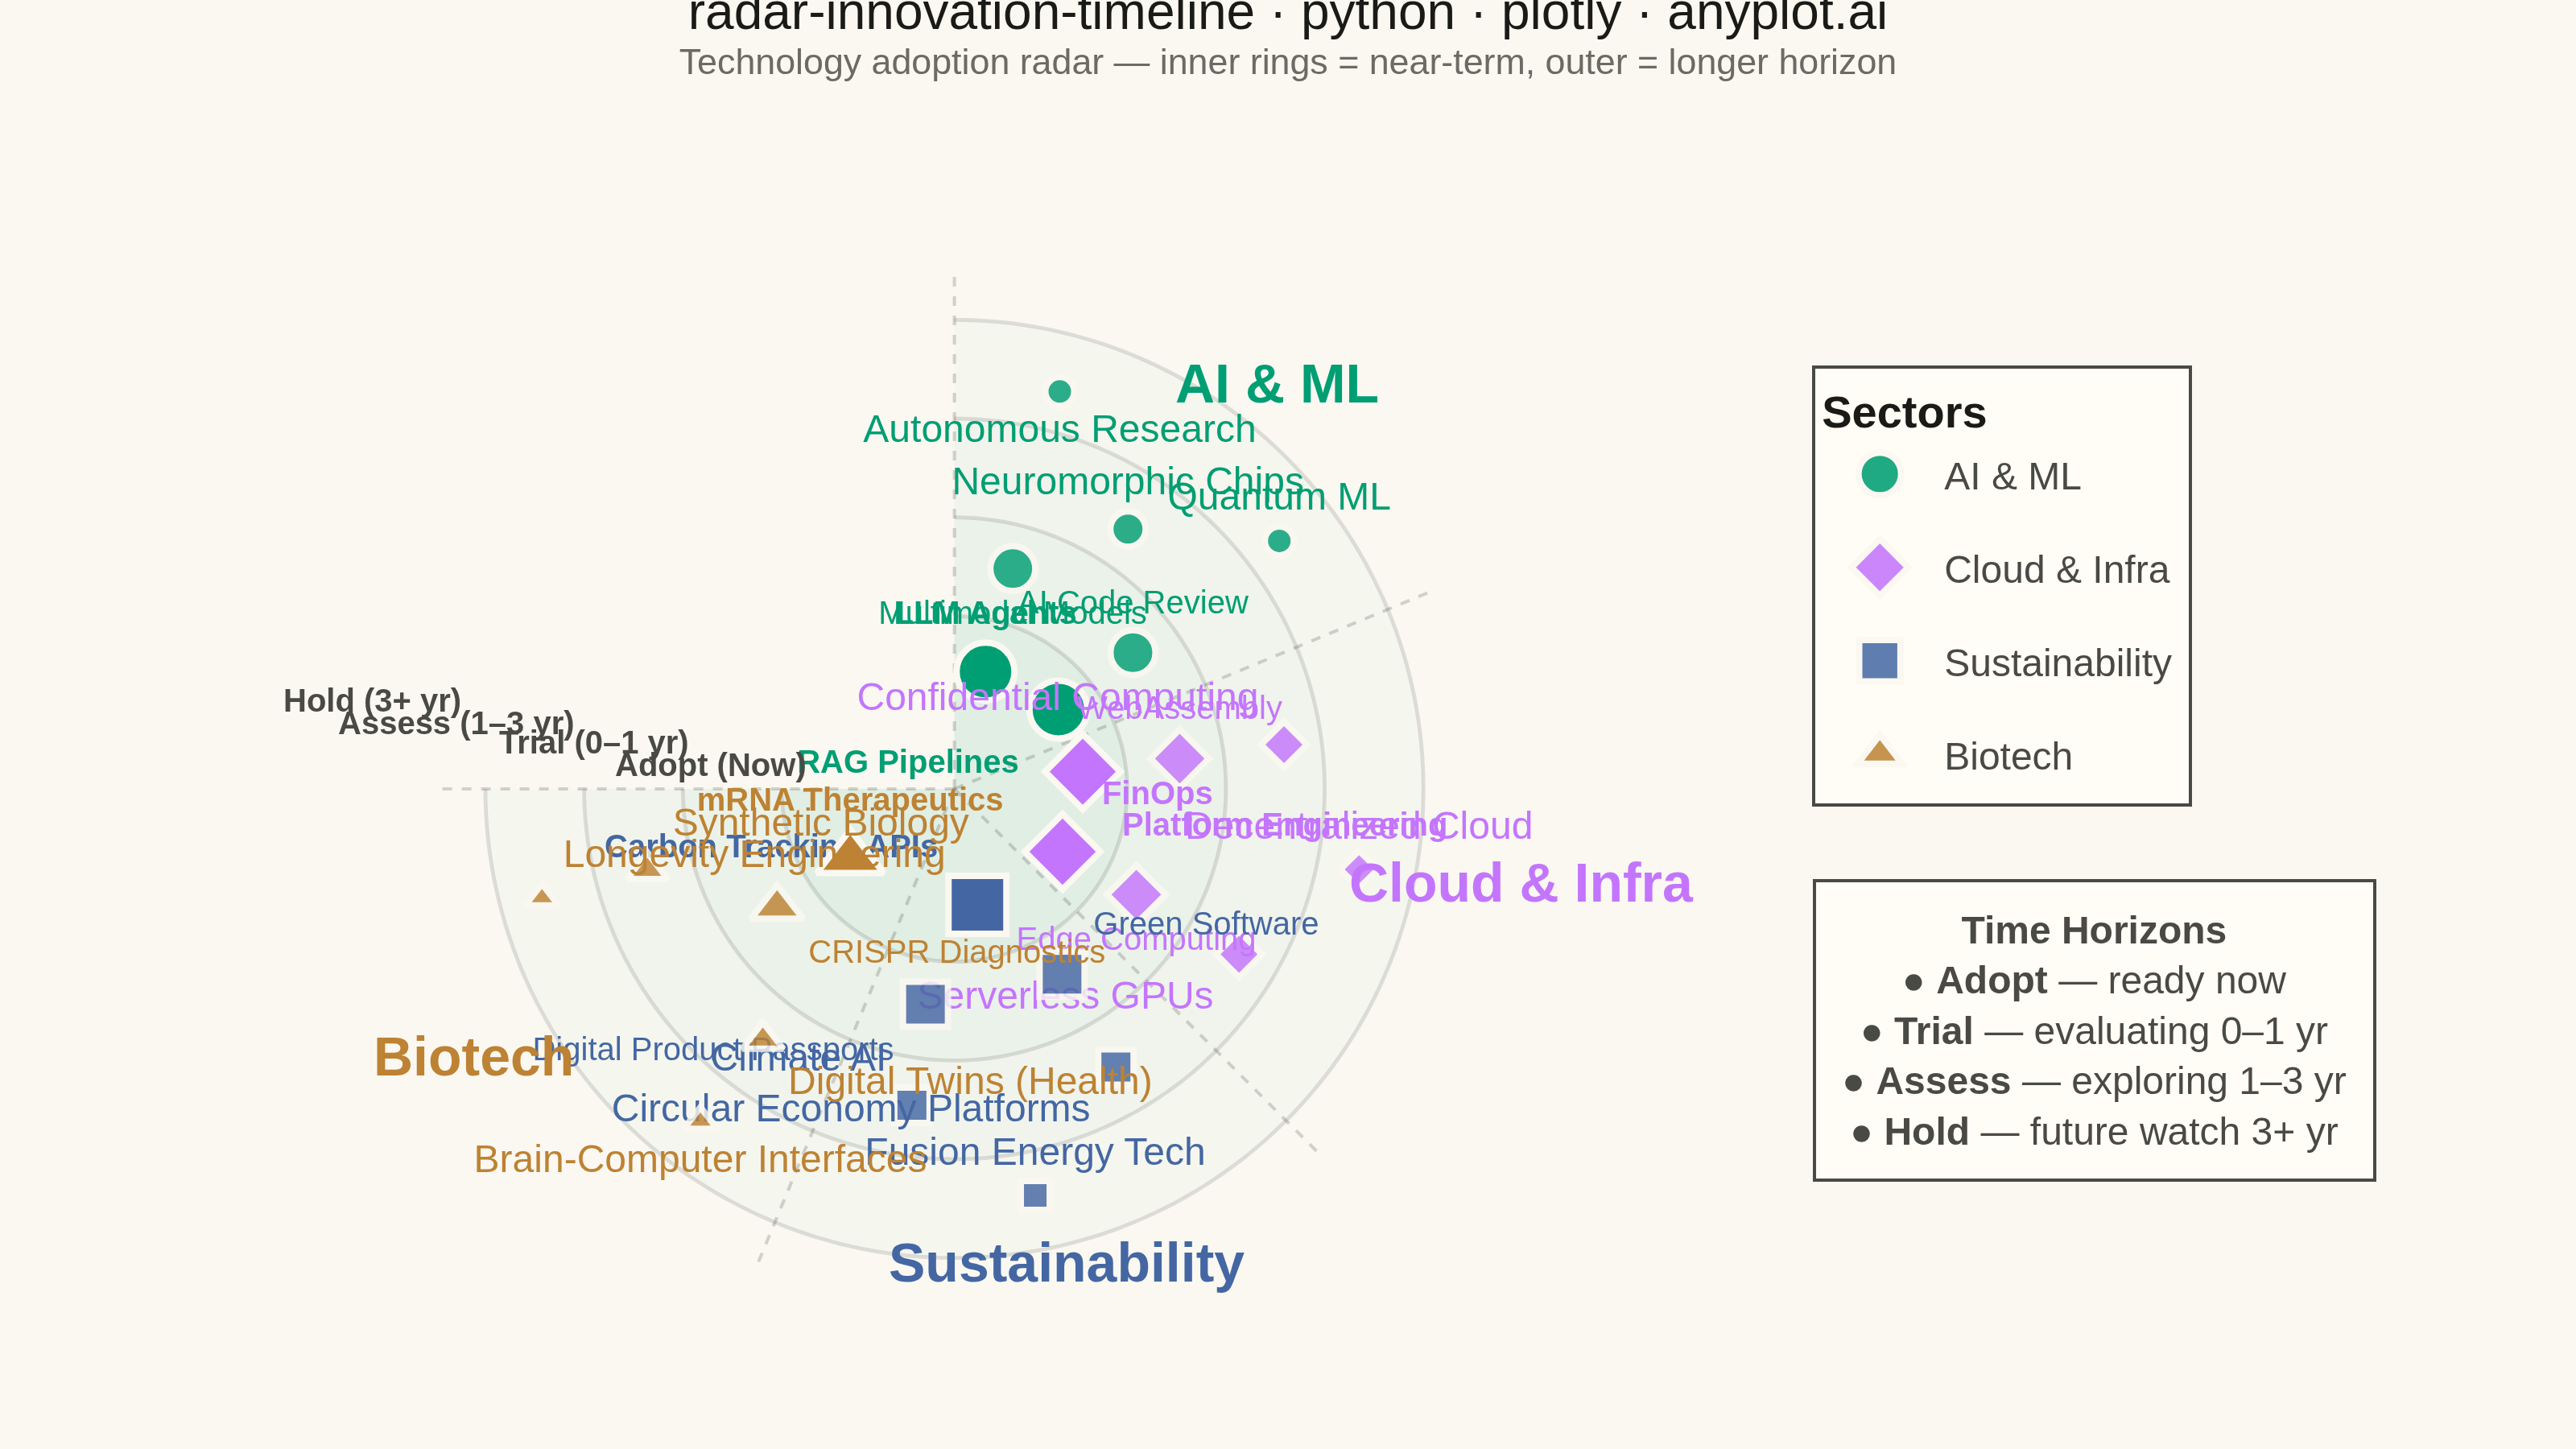
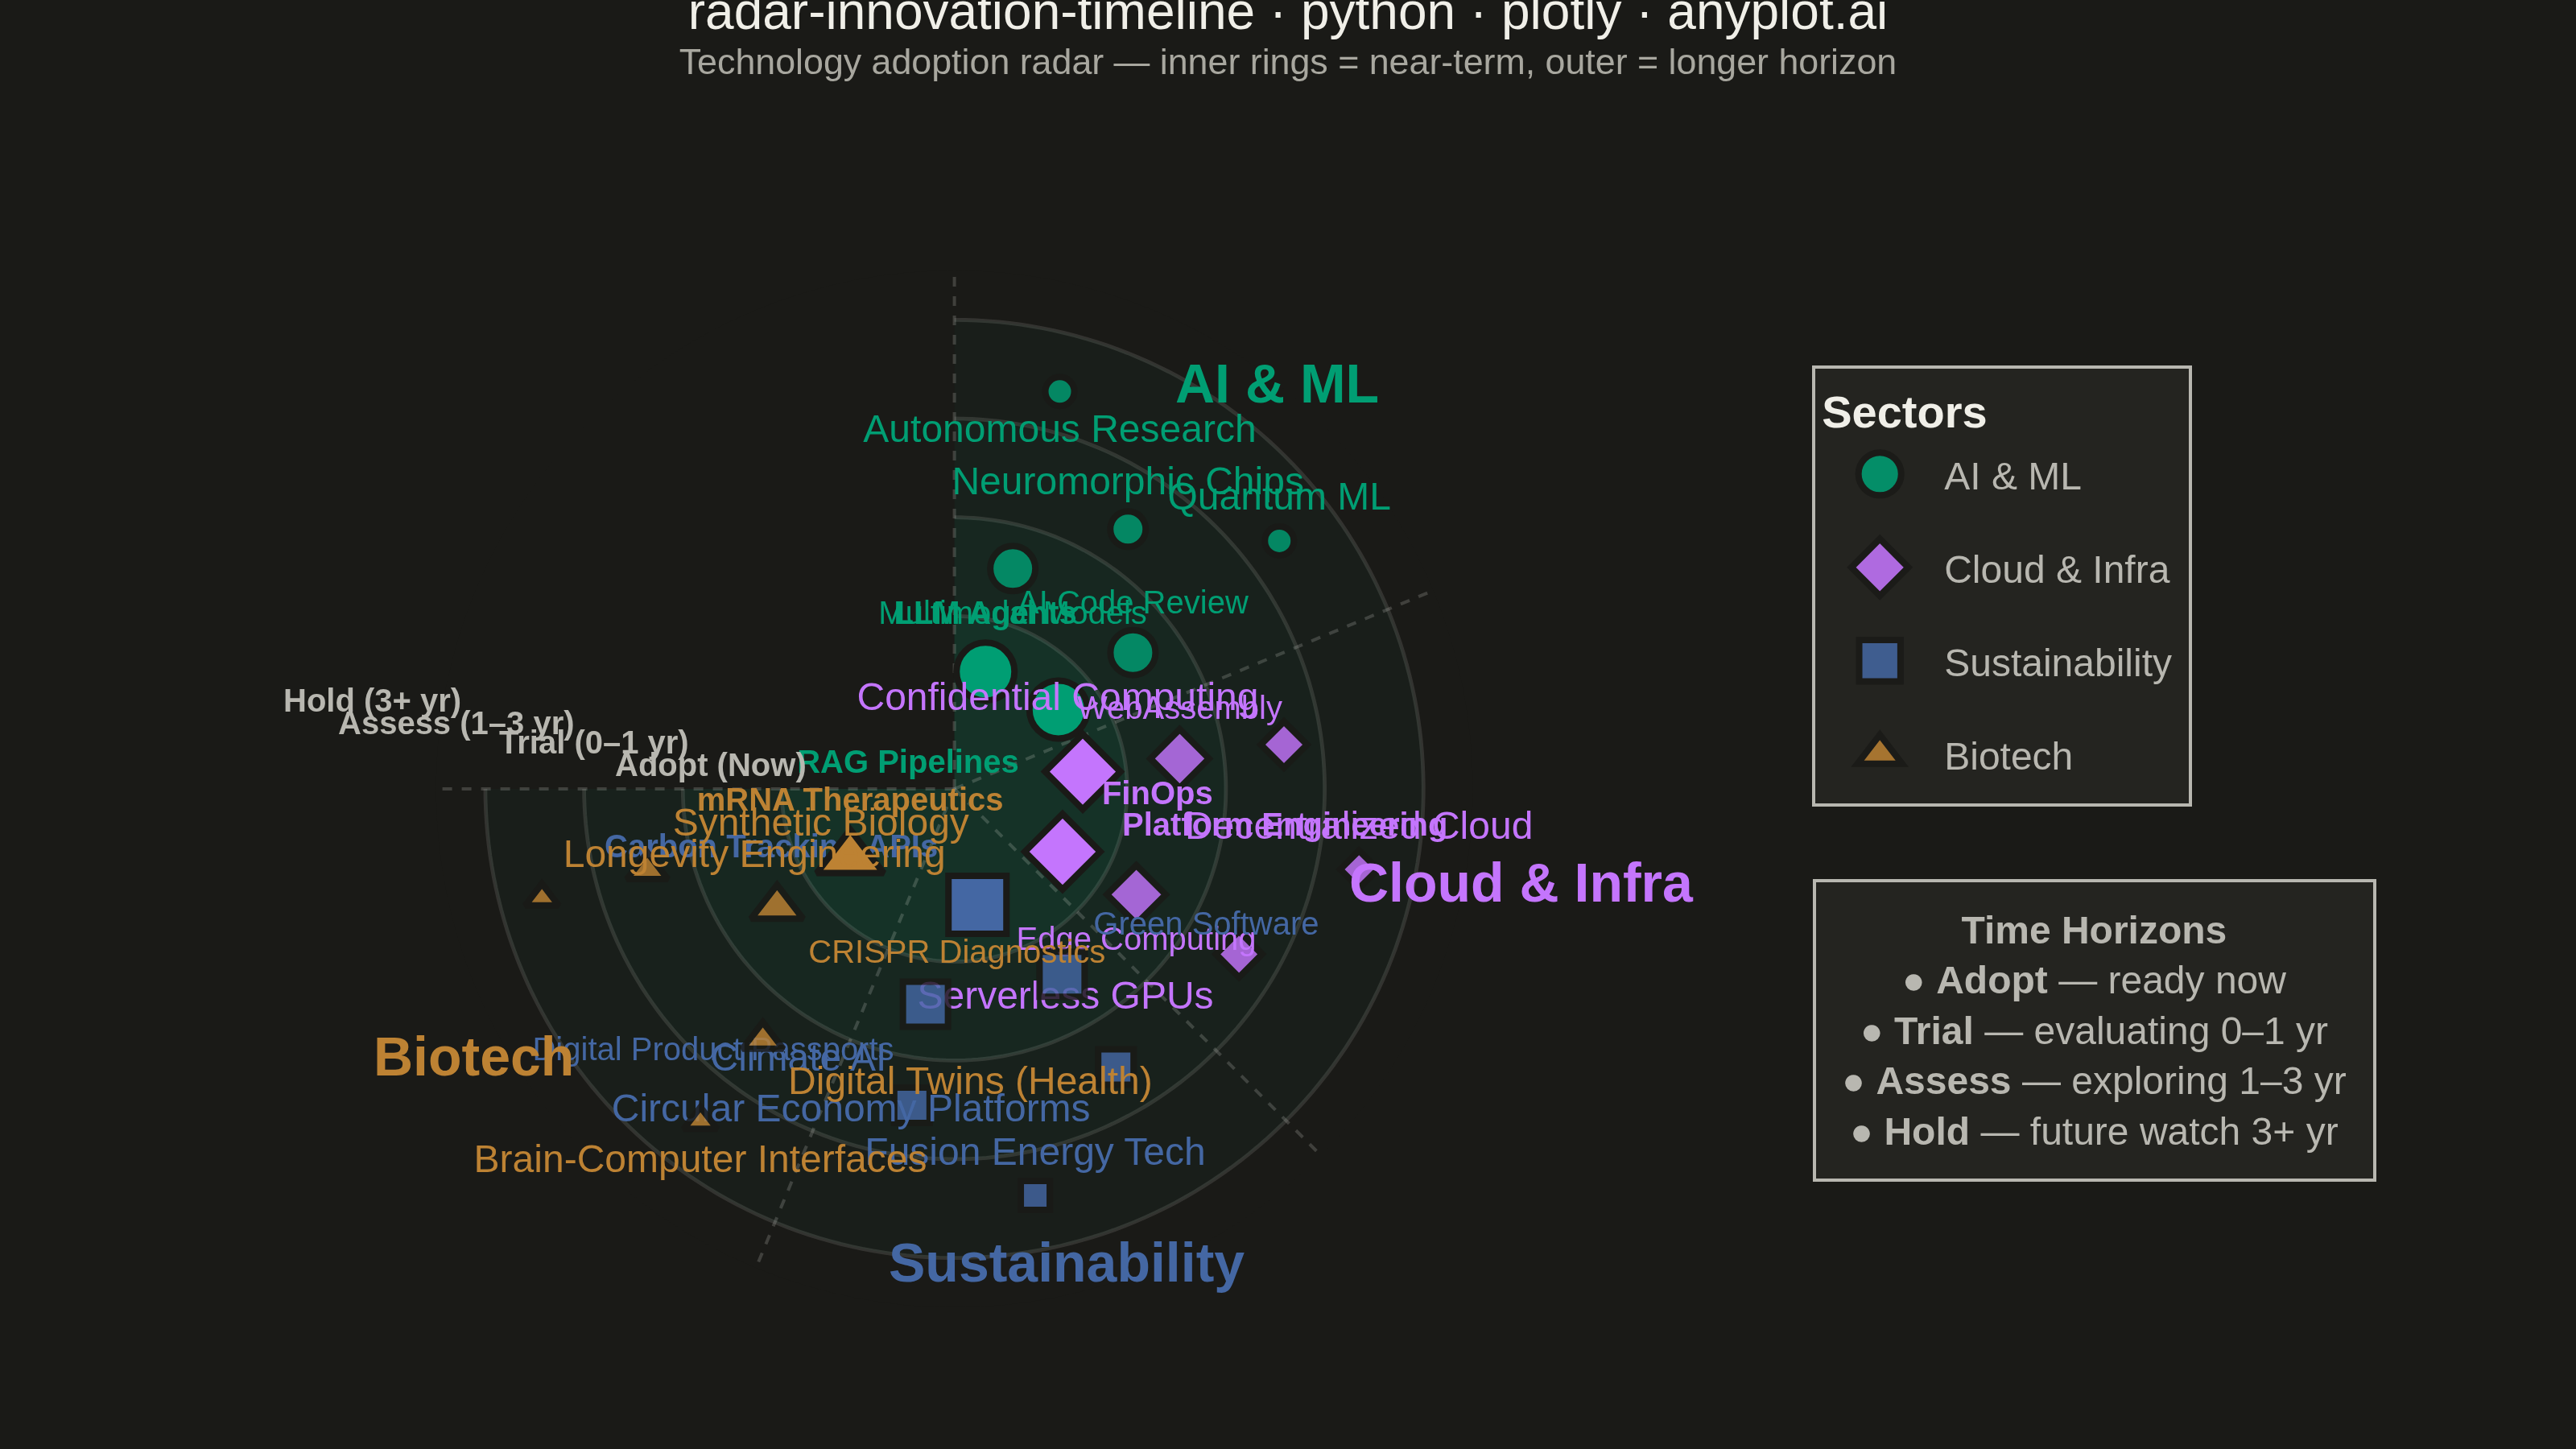
A radial chart that maps innovations, technologies, or trends onto concentric rings representing time horizons and angular sectors representing thematic categories. Inner rings represent near-term items (e.g., "Now", "Next 6 months") while outer rings represent longer-term or emerging trends (e.g., "2-5 years", "Future"). Each item is placed as a labeled point within its sector and ring, with distinct markers or colors encoding categories. Inspired by ThoughtWorks Technology Radar and similar strategic planning visualizations.
""" anyplot.ai
radar-innovation-timeline: Innovation Radar with Time-Horizon Rings
Library: plotly 6.7.0 | Python 3.13.13
Quality: 85/100 | Updated: 2026-05-29
"""

import sys


sys.path = sys.path[1:]  # prevent this file from shadowing the installed plotly package

import os

import numpy as np
import plotly.graph_objects as go


# Theme tokens (Imprint palette — see prompts/default-style-guide.md)
THEME = os.getenv("ANYPLOT_THEME", "light")
PAGE_BG = "#FAF8F1" if THEME == "light" else "#1A1A17"
ELEVATED_BG = "#FFFDF6" if THEME == "light" else "#242420"
INK = "#1A1A17" if THEME == "light" else "#F0EFE8"
INK_SOFT = "#4A4A44" if THEME == "light" else "#B8B7B0"
INK_MUTED = "#6B6A63" if THEME == "light" else "#A8A79F"

IMPRINT_PALETTE = ["#009E73", "#C475FD", "#4467A3", "#BD8233", "#AE3030", "#2ABCCD", "#954477", "#99B314"]

np.random.seed(42)

# Data — technology innovations across sectors and time horizons
sectors = ["AI & ML", "Cloud & Infra", "Sustainability", "Biotech"]
rings = ["Adopt", "Trial", "Assess", "Hold"]
# Wider spread separates rings to reduce inner-zone label collision
ring_radii = {"Adopt": 1.5, "Trial": 2.7, "Assess": 3.9, "Hold": 5.1}
ring_marker_sizes = {"Adopt": 18, "Trial": 14, "Assess": 11, "Hold": 9}
ring_boundaries = [2.1, 3.3, 4.5, 5.7]
R_MAX = 6.3

# Polar domain (landscape): x=[0.02, 0.70], y=[0.04, 0.96]
# radius limited by y: min(0.34*800, 0.46*450)=min(272,207)=207 px
POLAR_CX = 0.36
POLAR_CY = 0.50
POLAR_RX = 0.259  # paper-x per radial unit (207/800)
POLAR_RY = 0.460  # paper-y per radial unit (207/450)
HEADER_R = 5.9

innovations = [
    # AI & ML — "AI Code Review" flipped to left textpos to prevent right-boundary clipping
    {"name": "LLM Agents", "sector": "AI & ML", "ring": "Adopt", "textpos": "top center"},
    {"name": "RAG Pipelines", "sector": "AI & ML", "ring": "Adopt", "textpos": "bottom left"},
    {"name": "Multimodal Models", "sector": "AI & ML", "ring": "Trial", "textpos": "bottom center"},
    {"name": "AI Code Review", "sector": "AI & ML", "ring": "Trial", "textpos": "top center"},
    {"name": "Neuromorphic Chips", "sector": "AI & ML", "ring": "Assess", "textpos": "top center"},
    {"name": "Autonomous Research", "sector": "AI & ML", "ring": "Hold", "textpos": "bottom center"},
    {"name": "Quantum ML", "sector": "AI & ML", "ring": "Hold", "textpos": "top center"},
    # Cloud & Infra — right-edge items flipped to left textpos to prevent boundary clipping
    {"name": "Platform Engineering", "sector": "Cloud & Infra", "ring": "Adopt", "textpos": "bottom right"},
    {"name": "FinOps", "sector": "Cloud & Infra", "ring": "Adopt", "textpos": "top right"},
    {"name": "WebAssembly", "sector": "Cloud & Infra", "ring": "Trial", "textpos": "top center"},
    {"name": "Edge Computing", "sector": "Cloud & Infra", "ring": "Trial", "textpos": "bottom center"},
    {"name": "Confidential Computing", "sector": "Cloud & Infra", "ring": "Assess", "textpos": "top left"},
    {"name": "Serverless GPUs", "sector": "Cloud & Infra", "ring": "Assess", "textpos": "bottom left"},
    {"name": "Decentralized Cloud", "sector": "Cloud & Infra", "ring": "Hold", "textpos": "top center"},
    # Sustainability — "Circular Economy Platforms" flipped to left to avoid right clipping
    {"name": "Carbon Tracking APIs", "sector": "Sustainability", "ring": "Adopt", "textpos": "top left"},
    {"name": "Green Software", "sector": "Sustainability", "ring": "Trial", "textpos": "top right"},
    {"name": "Digital Product Passports", "sector": "Sustainability", "ring": "Trial", "textpos": "bottom left"},
    {"name": "Circular Economy Platforms", "sector": "Sustainability", "ring": "Assess", "textpos": "bottom left"},
    {"name": "Climate AI", "sector": "Sustainability", "ring": "Assess", "textpos": "top left"},
    {"name": "Fusion Energy Tech", "sector": "Sustainability", "ring": "Hold", "textpos": "top center"},
    # Biotech — text positions flipped inward to prevent left-edge clipping
    {"name": "mRNA Therapeutics", "sector": "Biotech", "ring": "Adopt", "textpos": "top center"},
    {"name": "CRISPR Diagnostics", "sector": "Biotech", "ring": "Trial", "textpos": "bottom right"},
    {"name": "Digital Twins (Health)", "sector": "Biotech", "ring": "Assess", "textpos": "bottom right"},
    {"name": "Synthetic Biology", "sector": "Biotech", "ring": "Assess", "textpos": "top right"},
    {"name": "Brain-Computer Interfaces", "sector": "Biotech", "ring": "Hold", "textpos": "bottom center"},
    {"name": "Longevity Engineering", "sector": "Biotech", "ring": "Hold", "textpos": "top right"},
]

# Sector colors using Imprint palette canonical order
sector_colors = {
    "AI & ML": IMPRINT_PALETTE[0],  # #009E73 brand green
    "Cloud & Infra": IMPRINT_PALETTE[1],  # #C475FD lavender
    "Sustainability": IMPRINT_PALETTE[2],  # #4467A3 blue
    "Biotech": IMPRINT_PALETTE[3],  # #BD8233 ochre
}

sector_symbols = {"AI & ML": "circle", "Cloud & Infra": "diamond", "Sustainability": "square", "Biotech": "triangle-up"}

# 270° layout, 4 equal sectors
sector_span = 270 / len(sectors)
sector_starts = {s: i * sector_span for i, s in enumerate(sectors)}

# Compute item positions within each sector ring
items_by_sector = {s: [] for s in sectors}

for sector in sectors:
    start_angle = sector_starts[sector]
    sector_items = [inn for inn in innovations if inn["sector"] == sector]

    for ring in rings:
        ring_items = [it for it in sector_items if it["ring"] == ring]
        if not ring_items:
            continue
        n = len(ring_items)
        padding = sector_span * 0.22
        usable_span = sector_span - 2 * padding
        for idx, item in enumerate(ring_items):
            if n == 1:
                angle = start_angle + sector_span / 2
            else:
                angle = start_angle + padding + usable_span * idx / (n - 1)
            base_r = ring_radii[ring]
            jitter_range = 0.10 if ring == "Adopt" else 0.15
            jitter = np.random.uniform(-jitter_range, jitter_range)
            items_by_sector[sector].append(
                {"name": item["name"], "ring": ring, "angle": angle, "r": base_r + jitter, "textpos": item["textpos"]}
            )

# Ring fill colors — theme-adaptive, Imprint green tinted bands
if THEME == "light":
    ring_fill_colors = ["rgba(0,158,115,0.10)", "rgba(0,158,115,0.06)", "rgba(0,158,115,0.04)", "rgba(0,158,115,0.02)"]
else:
    ring_fill_colors = ["rgba(0,158,115,0.18)", "rgba(0,158,115,0.10)", "rgba(0,158,115,0.06)", "rgba(0,158,115,0.03)"]

ring_line_color = "rgba(26,26,23,0.12)" if THEME == "light" else "rgba(240,239,232,0.12)"
sector_line_color = "rgba(26,26,23,0.18)" if THEME == "light" else "rgba(240,239,232,0.18)"

# Plot
fig = go.Figure()

# Ring background fills — non-overlapping bands from center outward
theta_fill = np.linspace(0, 270, 200).tolist()
ring_bands = [(0, ring_boundaries[0])] + list(zip(ring_boundaries[:-1], ring_boundaries[1:], strict=False))
for i, (r_inner, r_outer) in enumerate(ring_bands):
    fig.add_trace(
        go.Scatterpolar(
            r=[r_outer] * len(theta_fill) + [r_inner] * len(theta_fill),
            theta=theta_fill + theta_fill[::-1],
            fill="toself",
            fillcolor=ring_fill_colors[i],
            line={"width": 0},
            showlegend=False,
            hoverinfo="skip",
        )
    )

# Ring boundary lines
for radius in ring_boundaries:
    theta_circle = np.linspace(0, 270, 200)
    fig.add_trace(
        go.Scatterpolar(
            r=np.full_like(theta_circle, radius).tolist(),
            theta=theta_circle.tolist(),
            mode="lines",
            line={"color": ring_line_color, "width": 1.2},
            showlegend=False,
            hoverinfo="skip",
        )
    )

# Sector divider lines
for angle in [sector_starts[s] for s in sectors] + [270]:
    fig.add_trace(
        go.Scatterpolar(
            r=[0, R_MAX],
            theta=[angle, angle],
            mode="lines",
            line={"color": sector_line_color, "width": 1, "dash": "dot"},
            showlegend=False,
            hoverinfo="skip",
        )
    )

# Innovation items per sector — marker size encodes time horizon priority;
# inner rings (Adopt/Trial) use smaller textfont (10px) to reduce label crowding
for sector in sectors:
    items = items_by_sector[sector]
    color = sector_colors[sector]
    fig.add_trace(
        go.Scatterpolar(
            r=[it["r"] for it in items],
            theta=[it["angle"] for it in items],
            mode="markers+text",
            marker={
                "size": [ring_marker_sizes[it["ring"]] for it in items],
                "color": color,
                "symbol": sector_symbols[sector],
                "line": {"color": PAGE_BG, "width": 2},
                "opacity": [1.0 if it["ring"] == "Adopt" else 0.82 for it in items],
            },
            text=[f"<b>{it['name']}</b>" if it["ring"] == "Adopt" else it["name"] for it in items],
            textposition=[it["textpos"] for it in items],
            textfont={"size": [10 if it["ring"] in ("Adopt", "Trial") else 12 for it in items], "color": color},
            name=sector,
            legendgroup=sector,
            hovertemplate="%{text}<br>Ring: %{customdata}<extra>" + sector + "</extra>",
            customdata=[it["ring"] for it in items],
        )
    )

# Ring labels as paper-coordinate annotations in the empty arc gap (270°–360°).
# Placed at angle=282° (well inside the gap, upper-left of the circle) with
# xanchor="right" so text extends leftward into the unoccupied region.
# sin(282°) ≈ -0.978, cos(282°) ≈ 0.208
_gap_sin = np.sin(np.radians(282))
_gap_cos = np.cos(np.radians(282))
ring_label_annotations = []
for ring_name, label in [
    ("Adopt", "Adopt (Now)"),
    ("Trial", "Trial (0–1 yr)"),
    ("Assess", "Assess (1–3 yr)"),
    ("Hold", "Hold (3+ yr)"),
]:
    r = ring_radii[ring_name]
    frac = r / R_MAX
    lx = float(POLAR_CX + frac * POLAR_RX * _gap_sin)
    ly = float(POLAR_CY + frac * POLAR_RY * _gap_cos)
    ring_label_annotations.append(
        {
            "text": f"<b>{label}</b>",
            "x": lx,
            "y": ly,
            "xref": "paper",
            "yref": "paper",
            "xanchor": "right",
            "yanchor": "middle",
            "showarrow": False,
            "font": {"size": 10, "color": INK_SOFT},
        }
    )

# Sector header labels in paper coordinates to avoid polar-domain clipping.

sector_header_annotations = []
for sector in sectors:
    mid_deg = sector_starts[sector] + sector_span / 2
    mid_rad = np.radians(mid_deg)
    frac = HEADER_R / R_MAX
    px = float(POLAR_CX + frac * POLAR_RX * np.sin(mid_rad))
    py = float(POLAR_CY + frac * POLAR_RY * np.cos(mid_rad))
    sector_header_annotations.append(
        {
            "text": f"<b>{sector}</b>",
            "x": px,
            "y": py,
            "xref": "paper",
            "yref": "paper",
            "xanchor": "center",
            "yanchor": "middle",
            "showarrow": False,
            "font": {"size": 17, "color": sector_colors[sector]},
        }
    )

# Title
title_text = "radar-innovation-timeline · python · plotly · anyplot.ai"
n_chars = len(title_text)
title_fontsize = max(11, round(16 * 67 / n_chars)) if n_chars > 67 else 16

fig.update_layout(
    autosize=False,
    title={
        "text": (
            title_text + "<br><sup style='color:" + INK_MUTED + "; font-weight:normal'>"
            "Technology adoption radar — inner rings = near-term, outer = longer horizon"
            "</sup>"
        ),
        "font": {"size": title_fontsize, "color": INK},
        "x": 0.5,
        "xanchor": "center",
        "y": 0.98,
    },
    polar={
        "radialaxis": {"visible": False, "range": [0, R_MAX]},
        "angularaxis": {"visible": False, "direction": "clockwise", "rotation": 90},
        "bgcolor": PAGE_BG,
        "domain": {"x": [0.02, 0.70], "y": [0.04, 0.96]},
    },
    legend={
        "font": {"size": 12, "color": INK_SOFT},
        "x": 0.72,
        "y": 0.68,
        "xanchor": "left",
        "yanchor": "middle",
        "bgcolor": ELEVATED_BG,
        "bordercolor": INK_SOFT,
        "borderwidth": 1,
        "title": {"text": "<b>Sectors</b>", "font": {"size": 14, "color": INK}},
    },
    paper_bgcolor=PAGE_BG,
    margin={"l": 30, "r": 30, "t": 70, "b": 30},
    annotations=sector_header_annotations
    + ring_label_annotations
    + [
        {
            "text": (
                "<b>Time Horizons</b><br>"
                "● <b>Adopt</b> — ready now<br>"
                "● <b>Trial</b> — evaluating 0–1 yr<br>"
                "● <b>Assess</b> — exploring 1–3 yr<br>"
                "● <b>Hold</b> — future watch 3+ yr"
            ),
            "x": 0.72,
            "y": 0.42,
            "xref": "paper",
            "yref": "paper",
            "xanchor": "left",
            "yanchor": "top",
            "showarrow": False,
            "font": {"size": 12, "color": INK_SOFT},
            "bgcolor": ELEVATED_BG,
            "bordercolor": INK_SOFT,
            "borderwidth": 1,
            "borderpad": 8,
        }
    ],
)

# Save — landscape canvas (3200×1800) reduces empty top space and gives more room for labels
fig.write_image(f"plot-{THEME}.png", width=800, height=450, scale=4)
fig.write_html(f"plot-{THEME}.html", include_plotlyjs="cdn")
Runnable source as JSON, for any HTTP client: https://api.anyplot.ai/specs/radar-innovation-timeline/plotly/code. Any spec id and library id listed in llms-full.txt fit the same URL shape; every URL below is complete and callable.
{
  "spec_id": "radar-innovation-timeline",
  "language": "python",
  "library": "plotly",
  "page": "https://anyplot.ai/radar-innovation-timeline/python/plotly",
  "hub": "https://anyplot.ai/radar-innovation-timeline",
  "code_json": "https://api.anyplot.ai/specs/radar-innovation-timeline/plotly/code",
  "spec_json": "https://api.anyplot.ai/specs/radar-innovation-timeline",
  "render_light_png": "https://storage.googleapis.com/anyplot-images/plots/radar-innovation-timeline/python/plotly/plot-light.png",
  "render_dark_png": "https://storage.googleapis.com/anyplot-images/plots/radar-innovation-timeline/python/plotly/plot-dark.png",
  "interactive_light_html": "https://storage.googleapis.com/anyplot-images/plots/radar-innovation-timeline/python/plotly/plot-light.html",
  "interactive_dark_html": "https://storage.googleapis.com/anyplot-images/plots/radar-innovation-timeline/python/plotly/plot-dark.html",
  "quality_score": 85.0,
  "license": "MIT",
  "guide": "https://anyplot.ai/llms.txt"
}
Part of Innovation Radar with Time-Horizon Rings on anyplot.ai.