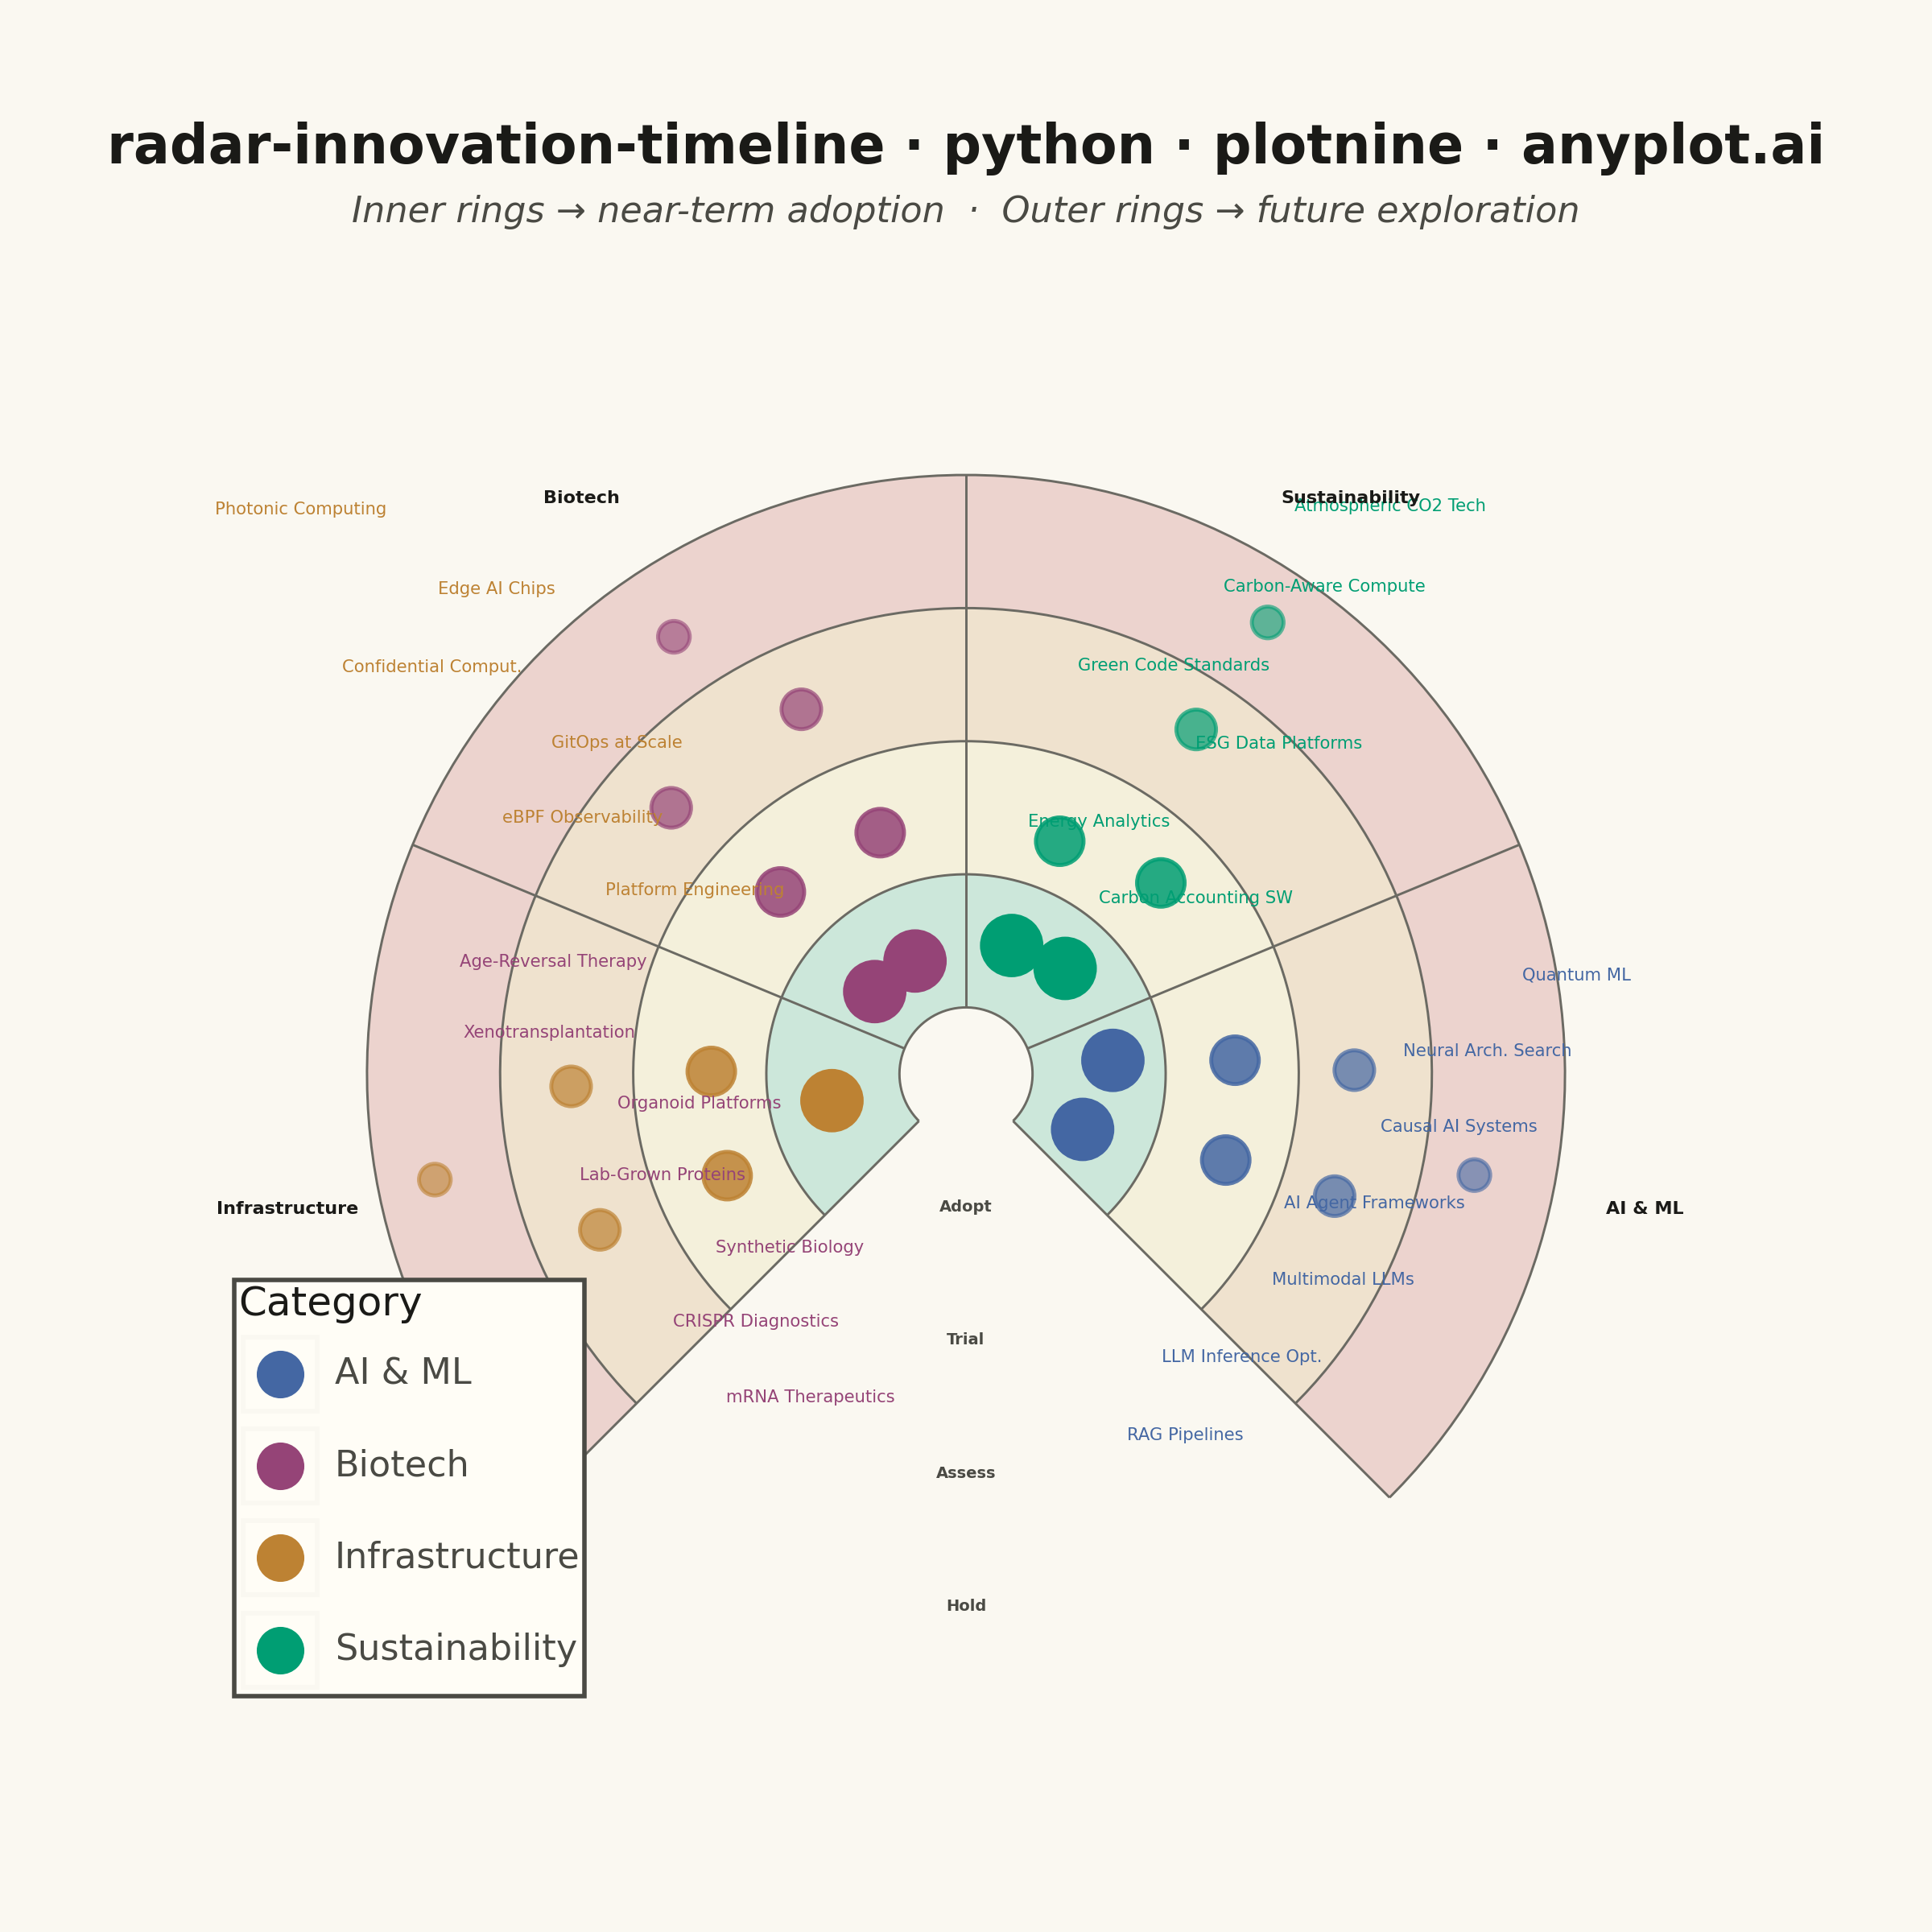
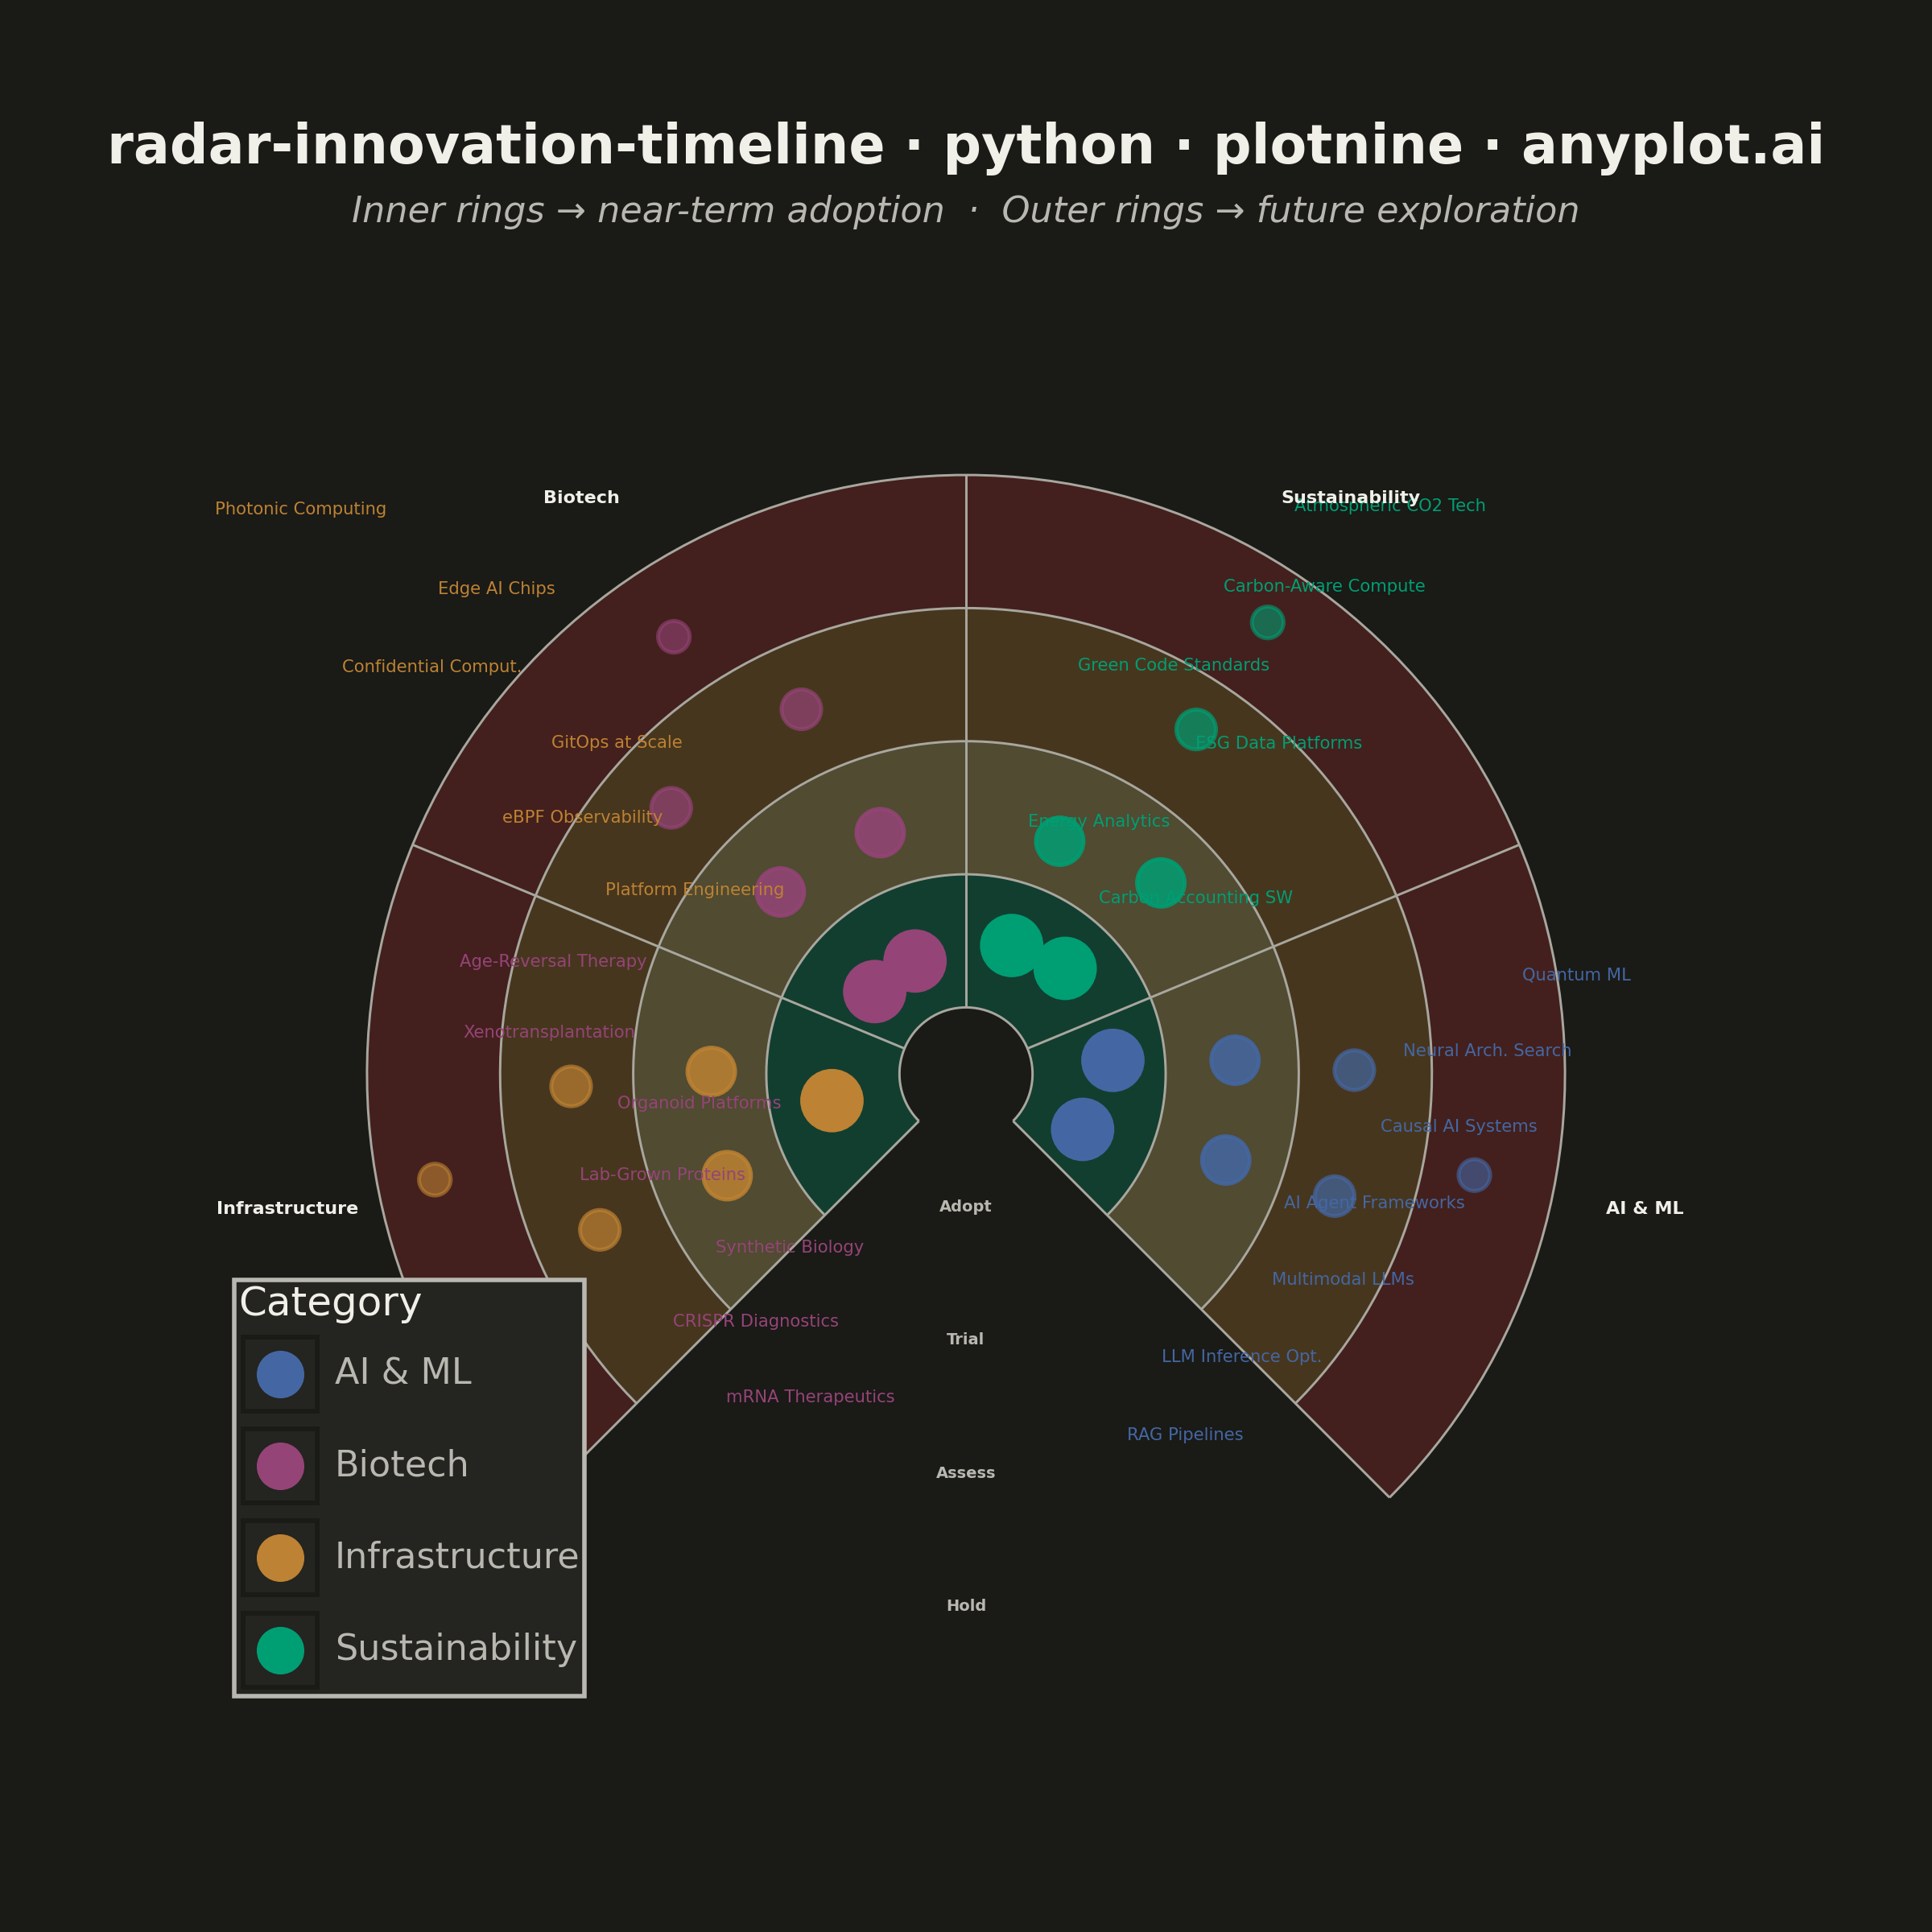
A radial chart that maps innovations, technologies, or trends onto concentric rings representing time horizons and angular sectors representing thematic categories. Inner rings represent near-term items (e.g., "Now", "Next 6 months") while outer rings represent longer-term or emerging trends (e.g., "2-5 years", "Future"). Each item is placed as a labeled point within its sector and ring, with distinct markers or colors encoding categories. Inspired by ThoughtWorks Technology Radar and similar strategic planning visualizations.
""" anyplot.ai
radar-innovation-timeline: Innovation Radar with Time-Horizon Rings
Library: plotnine 0.15.4 | Python 3.13.13
Quality: 85/100 | Updated: 2026-05-29
"""

import math
import os

import numpy as np
import pandas as pd
from plotnine import (
    aes,
    coord_fixed,
    element_blank,
    element_rect,
    element_text,
    geom_path,
    geom_point,
    geom_polygon,
    geom_segment,
    geom_text,
    ggplot,
    guide_legend,
    guides,
    labs,
    scale_alpha_manual,
    scale_color_manual,
    scale_fill_identity,
    scale_size_manual,
    scale_x_continuous,
    scale_y_continuous,
    theme,
)


THEME = os.getenv("ANYPLOT_THEME", "light")

# Imprint theme-adaptive chrome
PAGE_BG = "#FAF8F1" if THEME == "light" else "#1A1A17"
ELEVATED_BG = "#FFFDF6" if THEME == "light" else "#242420"
INK = "#1A1A17" if THEME == "light" else "#F0EFE8"
INK_SOFT = "#4A4A44" if THEME == "light" else "#B8B7B0"
INK_MUTED = "#6B6A63" if THEME == "light" else "#A8A79F"

# Imprint categorical palette — hybrid-v3 sort
IMPRINT = ["#009E73", "#C475FD", "#4467A3", "#BD8233", "#AE3030", "#2ABCCD", "#954477", "#99B314"]
ANYPLOT_AMBER = "#DDCC77"

np.random.seed(42)

# Layout: 270° arc open at bottom
RINGS = ["Adopt", "Trial", "Assess", "Hold"]
R_IN = [0.75, 2.25, 3.75, 5.25]
R_OUT = [2.25, 3.75, 5.25, 6.75]
R_MID = [1.5, 3.0, 4.5, 6.0]

# Semantic ring fills from Imprint palette — green=ready, amber=caution, ochre=assess, red=hold
RING_FILL_COLOR = {
    "Adopt": IMPRINT[0],  # green — ready for adoption
    "Trial": ANYPLOT_AMBER,  # amber — trial/caution
    "Assess": IMPRINT[3],  # ochre — assess carefully
    "Hold": IMPRINT[4],  # matte red — hold/avoid
}
RING_FILL_ALPHA = 0.18 if THEME == "light" else 0.28

RING_SIZE = {"Adopt": 7, "Trial": 5.5, "Assess": 4.5, "Hold": 3.5}
RING_ALPHA_PT = {"Adopt": 1.0, "Trial": 0.85, "Assess": 0.7, "Hold": 0.6}

# Sectors: distinct from AI/Cloud/Security/DataEng per cross-library divergence requirement
SECTORS = ["AI & ML", "Sustainability", "Biotech", "Infrastructure"]
# Semantic Imprint assignments: green=nature, blue=tech, rose=health, ochre=industrial
SEC_COLOR = {
    "Sustainability": IMPRINT[0],  # #009E73 green — nature/environment
    "AI & ML": IMPRINT[2],  # #4467A3 blue — digital/tech
    "Biotech": IMPRINT[6],  # #954477 rose — wellness/health/life sciences
    "Infrastructure": IMPRINT[3],  # #BD8233 ochre — industrial/construction
}

ARC_TOTAL = 1.5 * math.pi  # 270°
ARC_START = -math.pi / 4  # -45°
SEC_SPAN = ARC_TOTAL / len(SECTORS)
SEC_START = {s: ARC_START + i * SEC_SPAN for i, s in enumerate(SECTORS)}

# Innovation data: (name, sector, ring, angular_fraction)
innovations = [
    # AI & ML — digital intelligence technologies
    ("RAG Pipelines", "AI & ML", "Adopt", 0.20),
    ("LLM Inference Opt.", "AI & ML", "Adopt", 0.85),
    ("Multimodal LLMs", "AI & ML", "Trial", 0.35),
    ("AI Agent Frameworks", "AI & ML", "Trial", 0.80),
    ("Causal AI Systems", "AI & ML", "Assess", 0.35),
    ("Neural Arch. Search", "AI & ML", "Assess", 0.75),
    ("Quantum ML", "AI & ML", "Hold", 0.50),
    # Sustainability — environmental & climate technologies
    ("Carbon Accounting SW", "Sustainability", "Adopt", 0.30),
    ("Energy Analytics", "Sustainability", "Adopt", 0.80),
    ("ESG Data Platforms", "Sustainability", "Trial", 0.25),
    ("Green Code Standards", "Sustainability", "Trial", 0.75),
    ("Carbon-Aware Compute", "Sustainability", "Assess", 0.50),
    ("Atmospheric CO2 Tech", "Sustainability", "Hold", 0.50),
    # Biotech — life sciences & biology
    ("mRNA Therapeutics", "Biotech", "Adopt", 0.30),
    ("CRISPR Diagnostics", "Biotech", "Adopt", 0.80),
    ("Synthetic Biology", "Biotech", "Trial", 0.20),
    ("Lab-Grown Proteins", "Biotech", "Trial", 0.75),
    ("Organoid Platforms", "Biotech", "Assess", 0.30),
    ("Xenotransplantation", "Biotech", "Assess", 0.80),
    ("Age-Reversal Therapy", "Biotech", "Hold", 0.50),
    # Infrastructure — foundational computing platforms
    ("Platform Engineering", "Infrastructure", "Adopt", 0.50),
    ("eBPF Observability", "Infrastructure", "Trial", 0.25),
    ("GitOps at Scale", "Infrastructure", "Trial", 0.75),
    ("Confidential Comput.", "Infrastructure", "Assess", 0.30),
    ("Edge AI Chips", "Infrastructure", "Assess", 0.75),
    ("Photonic Computing", "Infrastructure", "Hold", 0.50),
]

# Compute polar point positions
ri_map = {r: i for i, r in enumerate(RINGS)}
rows = []
for name, sector, ring, frac in innovations:
    ri = ri_map[ring]
    pad = SEC_SPAN * 0.15
    angle = SEC_START[sector] + pad + frac * (SEC_SPAN - 2 * pad)
    r = R_MID[ri] + np.random.uniform(-0.18, 0.18)
    rows.append(
        {
            "name": name,
            "sector": sector,
            "ring": ring,
            "angle": angle,
            "radius": r,
            "x": r * math.cos(angle),
            "y": r * math.sin(angle),
        }
    )

df = pd.DataFrame(rows)
df["ring"] = pd.Categorical(df["ring"], categories=RINGS, ordered=True)

# Ring fill polygons (annular wedges — outer arc then reversed inner arc)
arc_angles = np.linspace(ARC_START, ARC_START + ARC_TOTAL, 150)
fill_rows = []
for i, rname in enumerate(RINGS):
    fc = RING_FILL_COLOR[rname]
    outer = [{"x": R_OUT[i] * math.cos(a), "y": R_OUT[i] * math.sin(a), "ring_g": rname, "fc": fc} for a in arc_angles]
    inner = [
        {"x": R_IN[i] * math.cos(a), "y": R_IN[i] * math.sin(a), "ring_g": rname, "fc": fc}
        for a in reversed(arc_angles)
    ]
    fill_rows.extend(outer + inner)
fill_df = pd.DataFrame(fill_rows)

# Ring boundary arcs
circ_rows = [
    {"x": rb * math.cos(a), "y": rb * math.sin(a), "r": rb} for rb in [0.75, 2.25, 3.75, 5.25, 6.75] for a in arc_angles
]
circ_df = pd.DataFrame(circ_rows)

# Sector dividing spokes
spoke_angles = [ARC_START + i * SEC_SPAN for i in range(len(SECTORS) + 1)]
spoke_df = pd.DataFrame(
    [
        {"x1": 0.75 * math.cos(a), "y1": 0.75 * math.sin(a), "x2": 6.75 * math.cos(a), "y2": 6.75 * math.sin(a)}
        for a in spoke_angles
    ]
)

# Sector header labels along outer edge
slbl_df = pd.DataFrame(
    [
        {"label": s, "x": 7.8 * math.cos(SEC_START[s] + SEC_SPAN / 2), "y": 7.8 * math.sin(SEC_START[s] + SEC_SPAN / 2)}
        for s in SECTORS
    ]
)

# Ring labels in the bottom gap (270° open arc → 3π/2 angle)
gap_angle = 3 * math.pi / 2
rlbl_df = pd.DataFrame(
    [
        {"label": r, "x": R_MID[i] * math.cos(gap_angle), "y": R_MID[i] * math.sin(gap_angle)}
        for i, r in enumerate(RINGS)
    ]
)

# Innovation labels with text-width-aware collision avoidance
lbl_offset = 0.55
char_w = 0.32  # estimated data units per character at geom_text size=3.8mm
labels = []
for _, row in df.iterrows():
    lx = (row["radius"] + lbl_offset) * math.cos(row["angle"])
    ly = (row["radius"] + lbl_offset) * math.sin(row["angle"])
    w = len(row["name"]) * char_w
    x_min = lx if lx >= 0 else lx - w
    x_max = (lx + w) if lx >= 0 else lx
    labels.append({"name": row["name"], "x": lx, "y": ly, "sector": row["sector"], "x_min": x_min, "x_max": x_max})

# Iterative nudge: push overlapping label bounding boxes apart vertically
min_sep = 0.90
for _ in range(40):
    moved = False
    for i in range(len(labels)):
        for j in range(i + 1, len(labels)):
            x_overlap = labels[i]["x_max"] > labels[j]["x_min"] and labels[j]["x_max"] > labels[i]["x_min"]
            if x_overlap:
                dy = labels[j]["y"] - labels[i]["y"]
                if abs(dy) < min_sep:
                    shift = (min_sep - abs(dy)) / 2
                    labels[i]["y"] -= shift
                    labels[j]["y"] += shift
                    moved = True
    if not moved:
        break

lbl_l_df = pd.DataFrame([lb for lb in labels if lb["x"] >= 0])
lbl_r_df = pd.DataFrame([lb for lb in labels if lb["x"] < 0])

# Build plot
plot = (
    ggplot()
    + geom_polygon(aes(x="x", y="y", group="ring_g", fill="fc"), data=fill_df, size=0, alpha=RING_FILL_ALPHA)
    + scale_fill_identity()
    + geom_path(aes(x="x", y="y", group="r"), data=circ_df, color=INK_MUTED, size=0.3)
    + geom_segment(aes(x="x1", y="y1", xend="x2", yend="y2"), data=spoke_df, color=INK_MUTED, size=0.3)
    + geom_point(aes(x="x", y="y", color="sector", size="ring", alpha="ring"), data=df)
    + scale_size_manual(values=RING_SIZE)
    + scale_alpha_manual(values=RING_ALPHA_PT)
    + geom_text(
        aes(x="x", y="y", label="name", color="sector"),
        data=lbl_l_df,
        size=3.8,
        ha="left",
        va="center",
        show_legend=False,
    )
    + geom_text(
        aes(x="x", y="y", label="name", color="sector"),
        data=lbl_r_df,
        size=3.8,
        ha="right",
        va="center",
        show_legend=False,
    )
    + geom_text(aes(x="x", y="y", label="label"), data=slbl_df, size=4.0, fontweight="bold", color=INK)
    + geom_text(
        aes(x="x", y="y", label="label"), data=rlbl_df, size=3.5, fontweight="bold", color=INK_SOFT, ha="center"
    )
    + scale_color_manual(values=SEC_COLOR, name="Category")
    + guides(color=guide_legend(override_aes={"size": 5}), size=False, alpha=False)
    + coord_fixed(ratio=1)
    + scale_x_continuous(limits=(-9.5, 9.5))
    + scale_y_continuous(limits=(-7.5, 8.5))
    + labs(
        title="radar-innovation-timeline · python · plotnine · anyplot.ai",
        subtitle="Inner rings → near-term adoption  ·  Outer rings → future exploration",
    )
    + theme(
        figure_size=(6, 6),
        plot_title=element_text(size=12, ha="center", weight="bold", color=INK),
        plot_subtitle=element_text(size=8, ha="center", color=INK_SOFT, style="italic"),
        legend_title=element_text(size=9, color=INK),
        legend_text=element_text(size=8, color=INK_SOFT),
        legend_position=(0.13, 0.10),
        legend_background=element_rect(fill=ELEVATED_BG, color=INK_SOFT),
        legend_key=element_rect(fill=ELEVATED_BG),
        axis_title=element_blank(),
        axis_text=element_blank(),
        axis_ticks=element_blank(),
        axis_line=element_blank(),
        panel_grid_major=element_blank(),
        panel_grid_minor=element_blank(),
        panel_background=element_rect(fill=PAGE_BG, color=PAGE_BG),
        plot_background=element_rect(fill=PAGE_BG, color=PAGE_BG),
        plot_margin=0.02,
    )
)

plot.save(f"plot-{THEME}.png", dpi=400, width=6, height=6, units="in")
Runnable source as JSON, for any HTTP client: https://api.anyplot.ai/specs/radar-innovation-timeline/plotnine/code. Any spec id and library id listed in llms-full.txt fit the same URL shape; every URL below is complete and callable.
{
  "spec_id": "radar-innovation-timeline",
  "language": "python",
  "library": "plotnine",
  "page": "https://anyplot.ai/radar-innovation-timeline/python/plotnine",
  "hub": "https://anyplot.ai/radar-innovation-timeline",
  "code_json": "https://api.anyplot.ai/specs/radar-innovation-timeline/plotnine/code",
  "spec_json": "https://api.anyplot.ai/specs/radar-innovation-timeline",
  "render_light_png": "https://storage.googleapis.com/anyplot-images/plots/radar-innovation-timeline/python/plotnine/plot-light.png",
  "render_dark_png": "https://storage.googleapis.com/anyplot-images/plots/radar-innovation-timeline/python/plotnine/plot-dark.png",
  "quality_score": 85.0,
  "license": "MIT",
  "guide": "https://anyplot.ai/llms.txt"
}
Part of Innovation Radar with Time-Horizon Rings on anyplot.ai.