The same plot in 14 other libraries — JavaScript: D3.js, Apache ECharts, Highcharts, MUI X Charts; Python: Altair, Bokeh, lets-plot, Matplotlib, Plotly, plotnine, Pygal, Seaborn; R: ggplot2; Julia: Makie.jl. Compare all 15 side by side: Innovation Radar with Time-Horizon Rings in Python, R, Julia and JavaScript.
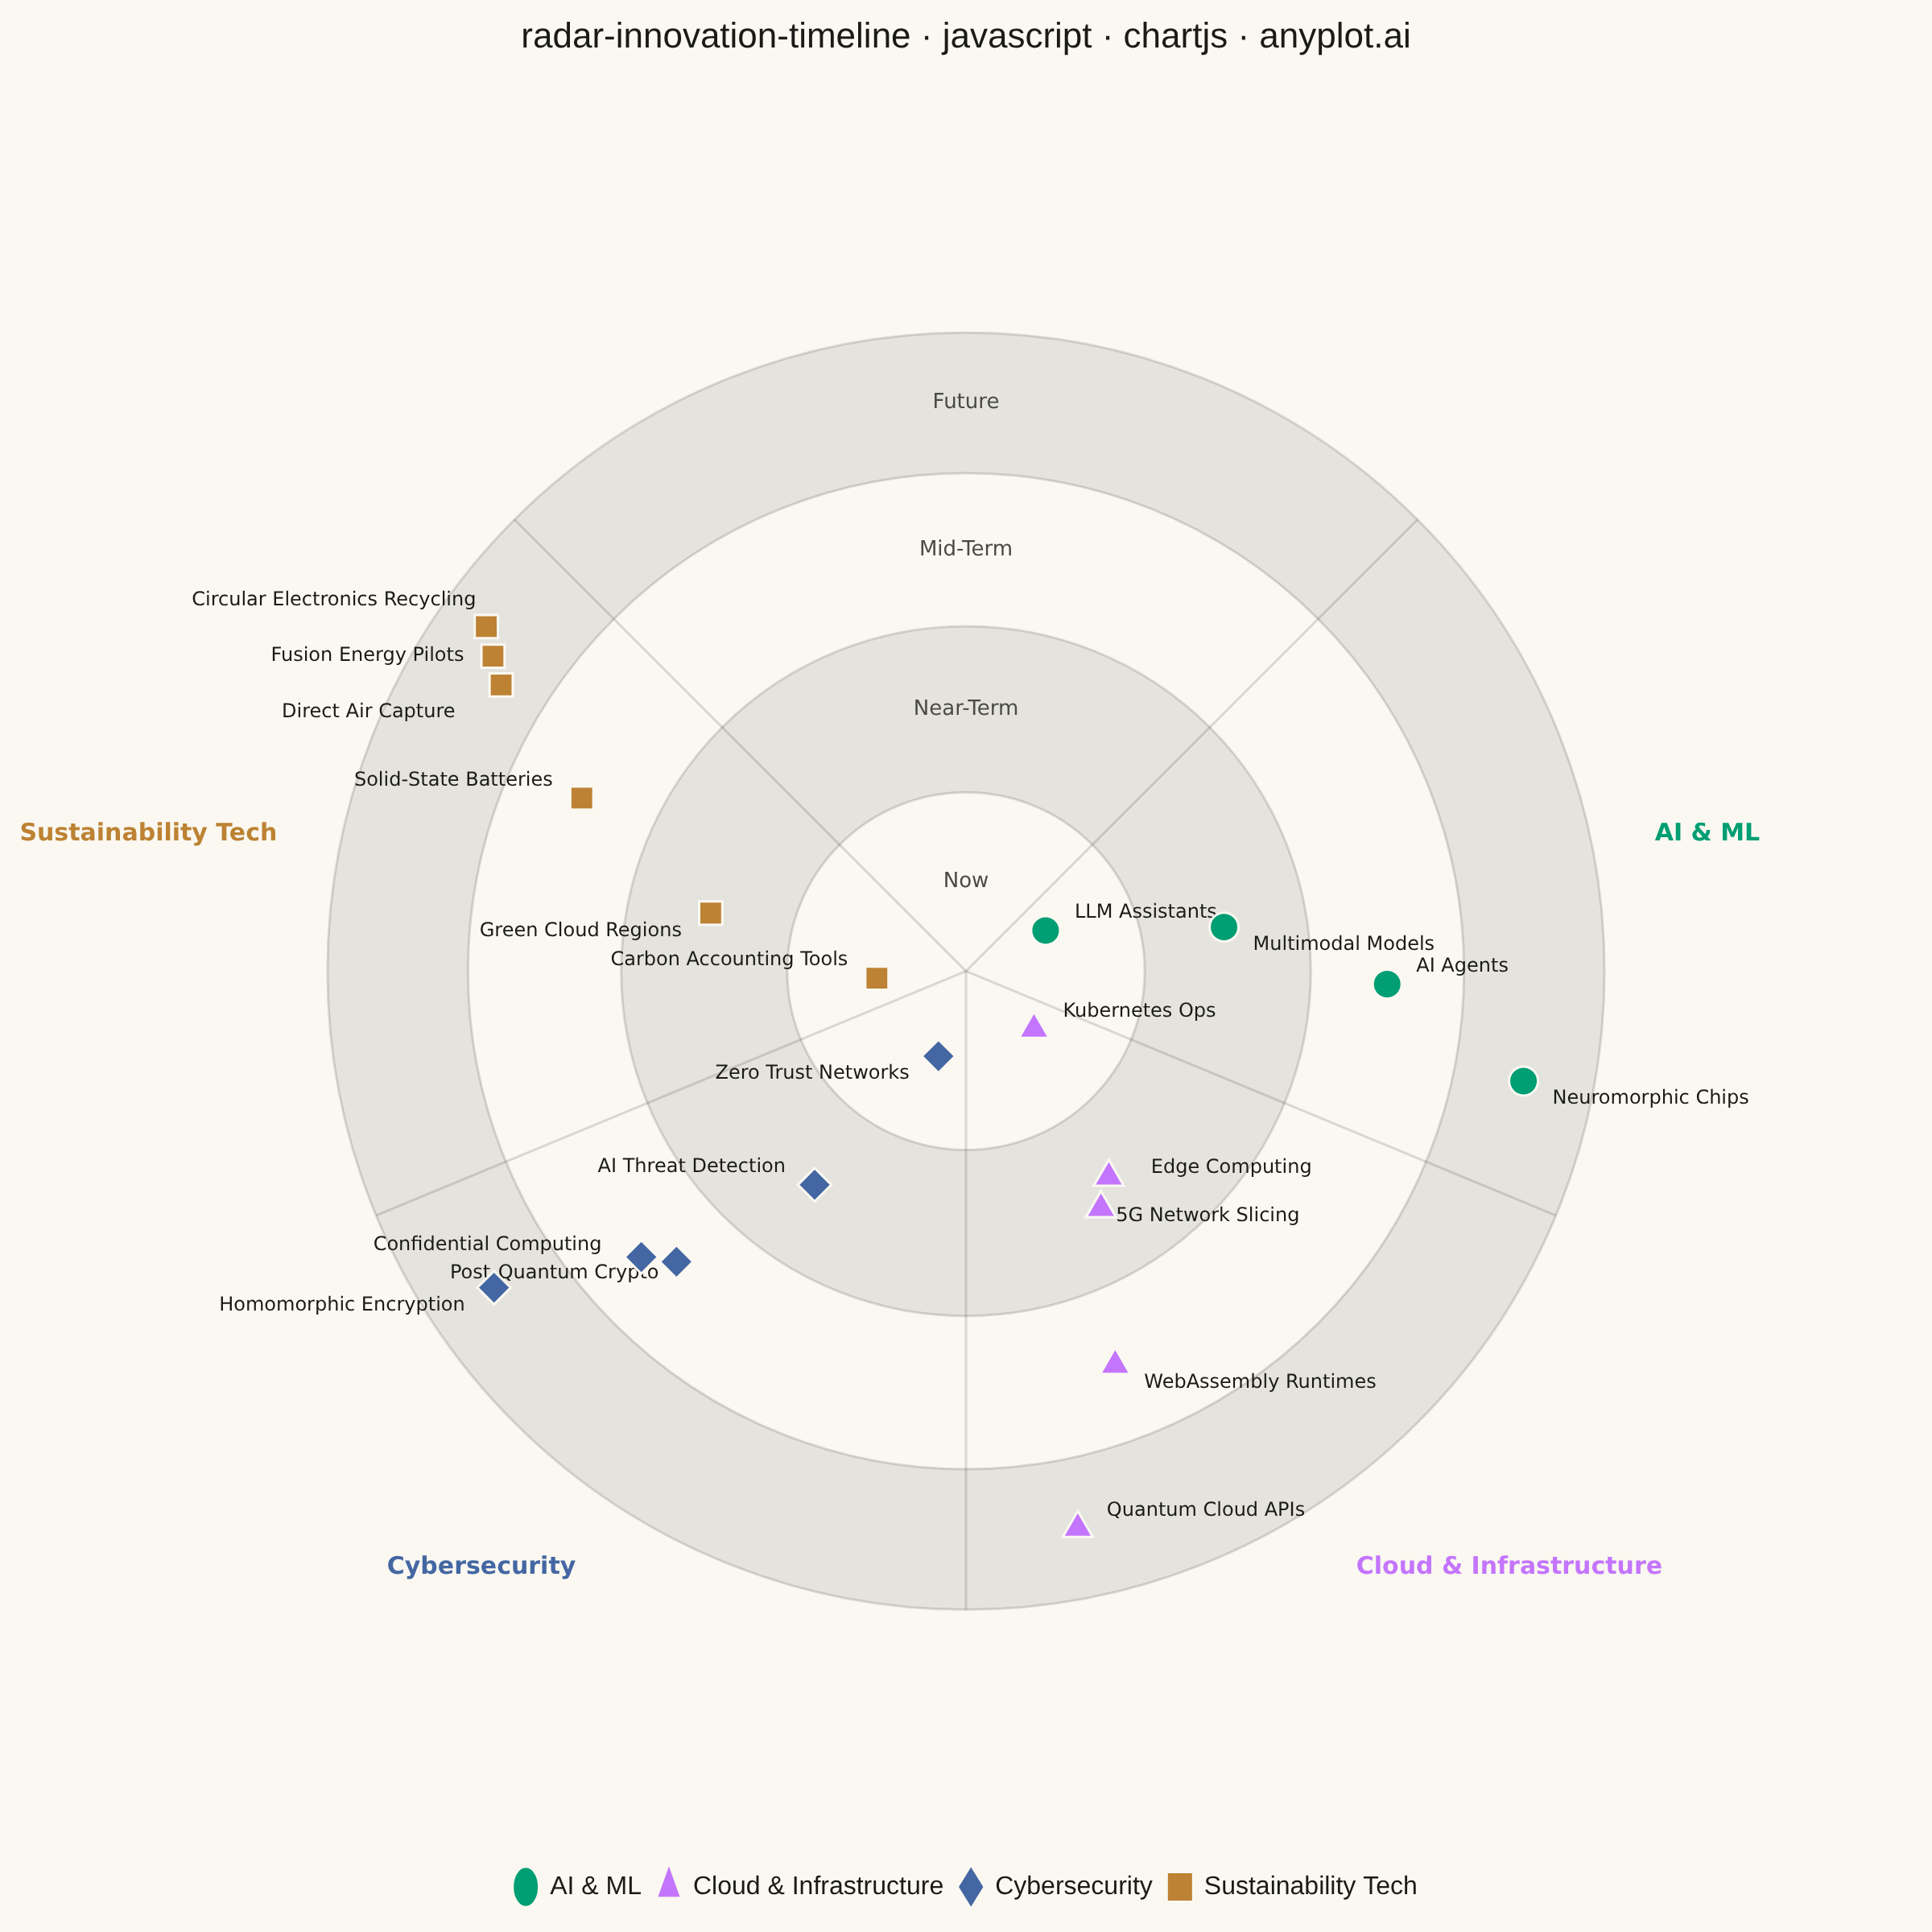
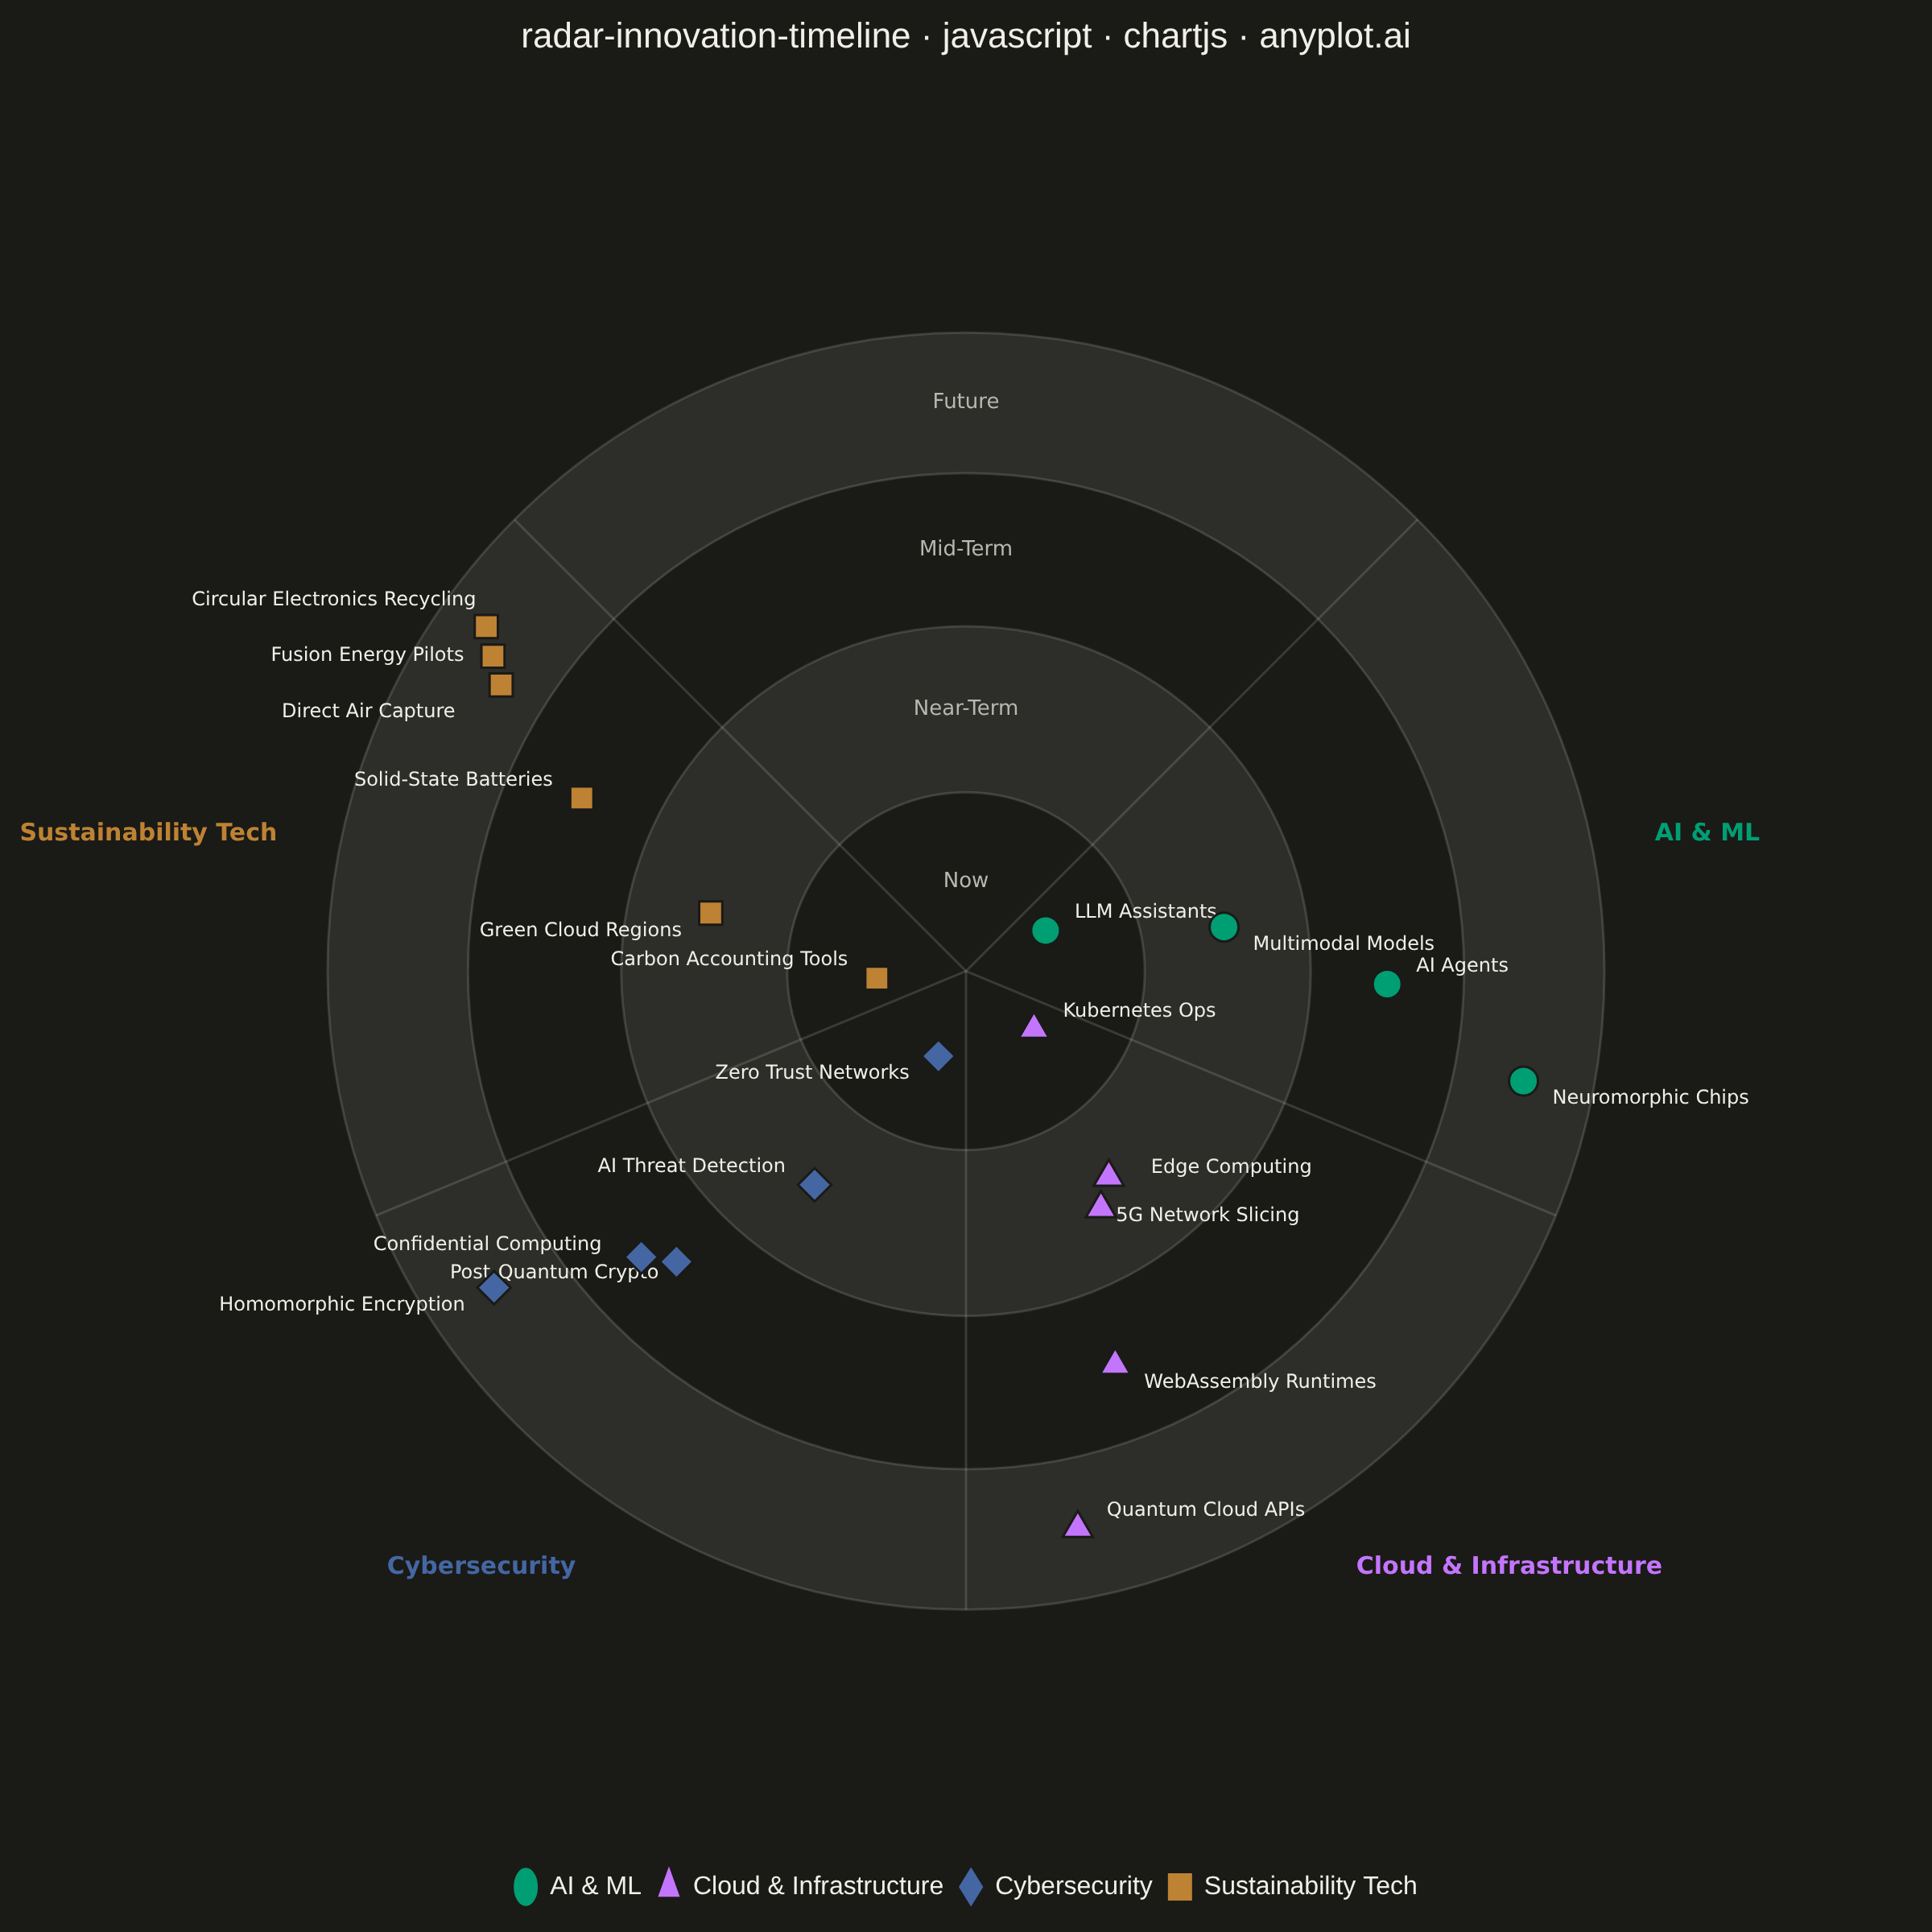
A radial chart that maps innovations, technologies, or trends onto concentric rings representing time horizons and angular sectors representing thematic categories. Inner rings represent near-term items (e.g., "Now", "Next 6 months") while outer rings represent longer-term or emerging trends (e.g., "2-5 years", "Future"). Each item is placed as a labeled point within its sector and ring, with distinct markers or colors encoding categories. Inspired by ThoughtWorks Technology Radar and similar strategic planning visualizations.
// anyplot.ai
// radar-innovation-timeline: Innovation Radar with Time-Horizon Rings
// Library: chartjs 4.4.7 | JavaScript 22.23.2
// Quality: 93/100 | Created: 2026-08-26

//# anyplot-orientation: square
const t = window.ANYPLOT_TOKENS;
const FONT = "system-ui, -apple-system, 'Segoe UI', sans-serif";

// --- Data (in-memory, deterministic) ----------------------------------------
// Rings = time-to-impact horizon (inner = nearer term), sectors = theme.
const RINGS = ["Now", "Near-Term", "Mid-Term", "Future"];
const RING_BOUNDS = [0, 0.28, 0.54, 0.78, 1.0]; // radius fractions, inner -> outer

const SECTORS = ["AI & ML", "Cloud & Infrastructure", "Cybersecurity", "Sustainability Tech"];
const SECTOR_SHAPES = ["circle", "triangle", "rectRot", "rect"];

// Most cells hold exactly one item, but a few (the ones with the roomiest
// angular lanes — Near-Term/Mid-Term/Future, where ring radius is larger)
// deliberately host 2-3 items to exercise the shared-cell crowding-avoidance
// logic below (lane subdivision + radial stagger), matching the spec's Notes
// on jittering/offsetting labels within a ring.
const ITEMS = [
  { name: "LLM Assistants", sector: "AI & ML", ring: "Now" },
  { name: "Multimodal Models", sector: "AI & ML", ring: "Near-Term" },
  { name: "AI Agents", sector: "AI & ML", ring: "Mid-Term" },
  { name: "Neuromorphic Chips", sector: "AI & ML", ring: "Future" },

  { name: "Kubernetes Ops", sector: "Cloud & Infrastructure", ring: "Now" },
  { name: "Edge Computing", sector: "Cloud & Infrastructure", ring: "Near-Term" },
  { name: "5G Network Slicing", sector: "Cloud & Infrastructure", ring: "Near-Term" },
  { name: "WebAssembly Runtimes", sector: "Cloud & Infrastructure", ring: "Mid-Term" },
  { name: "Quantum Cloud APIs", sector: "Cloud & Infrastructure", ring: "Future" },

  { name: "Zero Trust Networks", sector: "Cybersecurity", ring: "Now" },
  { name: "AI Threat Detection", sector: "Cybersecurity", ring: "Near-Term" },
  { name: "Post-Quantum Crypto", sector: "Cybersecurity", ring: "Mid-Term" },
  { name: "Confidential Computing", sector: "Cybersecurity", ring: "Mid-Term" },
  { name: "Homomorphic Encryption", sector: "Cybersecurity", ring: "Future" },

  { name: "Carbon Accounting Tools", sector: "Sustainability Tech", ring: "Now" },
  { name: "Green Cloud Regions", sector: "Sustainability Tech", ring: "Near-Term" },
  { name: "Solid-State Batteries", sector: "Sustainability Tech", ring: "Mid-Term" },
  { name: "Direct Air Capture", sector: "Sustainability Tech", ring: "Future" },
  { name: "Fusion Energy Pilots", sector: "Sustainability Tech", ring: "Future" },
  { name: "Circular Electronics Recycling", sector: "Sustainability Tech", ring: "Future" },
];

// --- Angular layout: three-quarter circle, 90deg gap at top for ring labels -
const SECTOR_START_DEG = -45; // sector band runs from here clockwise (screen y-down)
const SECTOR_SWEEP_DEG = 270;
const SECTOR_WIDTH_DEG = SECTOR_SWEEP_DEG / SECTORS.length;
const SECTOR_MARGIN_DEG = 7; // inset from each sector's angular edges
const RING_PAD_DEG = 1.3; // inset within each ring's angular lane

// Each sector is further split into one angular lane per ring, so items from
// different rings never fall on the same ray (which would stack their labels
// radially). Lane width is weighted by 1/sqrt(ring radius): the inner rings
// have far less circumference to work with, so they get a proportionally
// wider angular share of the sector than the spacious outer rings.
const RING_MID = RINGS.map((_, i) => (RING_BOUNDS[i] + RING_BOUNDS[i + 1]) / 2);
const RING_WEIGHT = RING_MID.map((m) => 1 / Math.sqrt(m));
const RING_WEIGHT_SUM = RING_WEIGHT.reduce((a, b) => a + b, 0);
const RING_CUM = [0];
RING_WEIGHT.forEach((w) => RING_CUM.push(RING_CUM[RING_CUM.length - 1] + w / RING_WEIGHT_SUM));

// Cells that hold more than one item split their angular lane into equal
// sub-slots (one per item) and additionally stagger those items' radii
// slightly within the ring band. The combined diagonal jitter keeps
// same-cell markers — and their labels — from colliding.
const CELL_COUNTS = new Map();
ITEMS.forEach((item) => {
  const key = `${item.sector}|${item.ring}`;
  CELL_COUNTS.set(key, (CELL_COUNTS.get(key) || 0) + 1);
});
const CELL_SEEN = new Map();
const RADIAL_STAGGER = 0.035; // fraction of R, per step away from the cell's mean radius

const PLACED = ITEMS.map((item, i) => {
  const sectorIdx = SECTORS.indexOf(item.sector);
  const ringIdx = RINGS.indexOf(item.ring);
  const sectorFrom = SECTOR_START_DEG + sectorIdx * SECTOR_WIDTH_DEG + SECTOR_MARGIN_DEG;
  const sectorTo = SECTOR_START_DEG + (sectorIdx + 1) * SECTOR_WIDTH_DEG - SECTOR_MARGIN_DEG;
  const sectorSpan = sectorTo - sectorFrom;
  const laneFrom = sectorFrom + RING_CUM[ringIdx] * sectorSpan + RING_PAD_DEG;
  const laneTo = sectorFrom + RING_CUM[ringIdx + 1] * sectorSpan - RING_PAD_DEG;

  const cellKey = `${item.sector}|${item.ring}`;
  const cellCount = CELL_COUNTS.get(cellKey);
  const cellIdx = CELL_SEEN.get(cellKey) || 0;
  CELL_SEEN.set(cellKey, cellIdx + 1);

  const slotWidth = (laneTo - laneFrom) / cellCount;
  const angleDeg = laneFrom + slotWidth * (cellIdx + 0.5);
  const radialJitter = cellCount > 1 ? (cellIdx - (cellCount - 1) / 2) * RADIAL_STAGGER : 0;
  const radiusFrac = (RING_BOUNDS[ringIdx] + RING_BOUNDS[ringIdx + 1]) / 2 + radialJitter;

  return { ...item, sectorIdx, ringIdx, angleDeg, radiusFrac, cellIdx, cellCount, order: i };
});

// --- Mount -------------------------------------------------------------------
const canvas = document.createElement("canvas");
document.getElementById("container").appendChild(canvas);

// --- Custom chrome + marks plugin --------------------------------------------
// Chart.js has no built-in "rings x sectors" chart type; this plugin draws the
// radar face natively on the chart's own canvas via the core Plugin API (no
// external plugin package, no other charting library). The chart's real
// datasets below only exist to drive the legend swatches.
const innovationRadar = {
  id: "innovationRadar",
  afterDraw(chart) {
    const { ctx, chartArea } = chart;
    const side = Math.min(chartArea.width, chartArea.height);
    const cx = chartArea.left + chartArea.width / 2;
    const cy = chartArea.top + chartArea.height / 2;
    const R = side * 0.36;

    const toRad = (deg) => (deg * Math.PI) / 180;
    const at = (deg, r) => ({ x: cx + r * Math.cos(toRad(deg)), y: cy + r * Math.sin(toRad(deg)) });

    // Ring fills (subtle alternating bands)
    ctx.save();
    for (let i = RING_BOUNDS.length - 1; i > 0; i--) {
      if (i % 2 !== 0) continue;
      const rOuter = R * RING_BOUNDS[i];
      const rInner = R * RING_BOUNDS[i - 1];
      ctx.beginPath();
      ctx.arc(cx, cy, rOuter, 0, Math.PI * 2);
      ctx.arc(cx, cy, rInner, 0, Math.PI * 2, true);
      ctx.fillStyle = t.grid;
      ctx.globalAlpha = 0.6;
      ctx.fill("evenodd");
    }
    ctx.restore();

    // Ring boundary circles
    ctx.save();
    ctx.strokeStyle = t.grid;
    ctx.lineWidth = 1.5;
    for (let i = 0; i < RING_BOUNDS.length; i++) {
      ctx.beginPath();
      ctx.arc(cx, cy, R * RING_BOUNDS[i] || 0.001, 0, Math.PI * 2);
      ctx.stroke();
    }
    ctx.restore();

    // Sector divider spokes
    ctx.save();
    ctx.strokeStyle = t.grid;
    ctx.lineWidth = 1.5;
    for (let k = 0; k <= SECTORS.length; k++) {
      const deg = SECTOR_START_DEG + k * SECTOR_WIDTH_DEG;
      const outer = at(deg, R);
      ctx.beginPath();
      ctx.moveTo(cx, cy);
      ctx.lineTo(outer.x, outer.y);
      ctx.stroke();
    }
    ctx.restore();

    // Sector header labels along the outer edge
    ctx.save();
    ctx.font = `600 15px ${FONT}`;
    ctx.textBaseline = "middle";
    SECTORS.forEach((name, idx) => {
      const mid = SECTOR_START_DEG + (idx + 0.5) * SECTOR_WIDTH_DEG;
      const pos = at(mid, R * 1.1);
      const dx = Math.cos(toRad(mid));
      const dy = Math.sin(toRad(mid));
      ctx.textAlign = dx > 0.3 ? "left" : dx < -0.3 ? "right" : "center";
      ctx.textBaseline = dy > 0.3 ? "top" : dy < -0.3 ? "bottom" : "middle";
      ctx.fillStyle = t.palette[idx % t.palette.length];
      ctx.fillText(name, pos.x, pos.y);
    });
    ctx.restore();

    // Ring labels, stacked in the top gap
    ctx.save();
    ctx.font = `500 13px ${FONT}`;
    ctx.fillStyle = t.inkSoft;
    ctx.textAlign = "center";
    ctx.textBaseline = "middle";
    RINGS.forEach((name, idx) => {
      const r = (R * (RING_BOUNDS[idx] + RING_BOUNDS[idx + 1])) / 2;
      const pos = at(-90, r);
      ctx.fillText(name, pos.x, pos.y);
    });
    ctx.restore();

    // Item markers + labels
    PLACED.forEach((d) => {
      const p = at(d.angleDeg, R * d.radiusFrac);
      const color = t.palette[d.sectorIdx % t.palette.length];
      const mr = 9;

      ctx.save();
      ctx.fillStyle = color;
      ctx.strokeStyle = t.pageBg;
      ctx.lineWidth = 1.5;
      ctx.beginPath();
      const shape = SECTOR_SHAPES[d.sectorIdx];
      if (shape === "circle") {
        ctx.arc(p.x, p.y, mr, 0, Math.PI * 2);
      } else if (shape === "triangle") {
        [-90, 150, 30].forEach((a, i) => {
          const rad = toRad(a);
          const vx = p.x + mr * 1.2 * Math.cos(rad);
          const vy = p.y + mr * 1.2 * Math.sin(rad);
          if (i === 0) ctx.moveTo(vx, vy);
          else ctx.lineTo(vx, vy);
        });
        ctx.closePath();
      } else if (shape === "rectRot") {
        [0, 90, 180, 270].forEach((a, i) => {
          const rad = toRad(a);
          const vx = p.x + mr * 1.15 * Math.cos(rad);
          const vy = p.y + mr * 1.15 * Math.sin(rad);
          if (i === 0) ctx.moveTo(vx, vy);
          else ctx.lineTo(vx, vy);
        });
        ctx.closePath();
      } else {
        const s = mr * 1.6;
        ctx.rect(p.x - s / 2, p.y - s / 2, s, s);
      }
      ctx.fill();
      ctx.stroke();
      ctx.restore();

      // Label: short diagonal offset, decoupled from the radial direction so
      // labels from neighbouring rings on near-horizontal sectors don't stack.
      // The horizontal gap clears the marker itself so the glyph never sits
      // on top of its own label. Same-cell neighbours (cellCount > 1) already
      // sit spread along the ring's tangent (the lane-subdivision direction);
      // pushing each label further along that *same* signed tangent vector
      // (rather than a fixed screen-axis guess) always reinforces that spread
      // instead of risking cancelling it out on sectors where the tangent
      // points the "wrong" way on screen.
      const dx = Math.cos(toRad(d.angleDeg));
      const labelGap = mr + 9;
      let lx = p.x + (dx >= 0 ? labelGap : -labelGap);
      let ly = p.y + (d.order % 2 === 0 ? -11 : 11);
      if (d.cellCount > 1) {
        const stackRank = d.cellIdx - (d.cellCount - 1) / 2;
        const rad = toRad(d.angleDeg);
        const tangentX = -Math.sin(rad);
        const tangentY = Math.cos(rad);
        const push = stackRank * 20;
        lx = p.x + (dx >= 0 ? labelGap : -labelGap) + tangentX * push;
        ly = p.y + tangentY * push;
      }
      ctx.save();
      ctx.font = `12px ${FONT}`;
      ctx.fillStyle = t.ink;
      ctx.textAlign = dx >= 0 ? "left" : "right";
      ctx.textBaseline = "middle";
      ctx.fillText(d.name, lx, ly);
      ctx.restore();
    });
  },
};

// --- Chart ---------------------------------------------------------------
// Real datasets carry no visible marks (pointRadius 0) — they exist only to
// drive the legend swatches; the radar face itself is drawn by the plugin.
new Chart(canvas, {
  type: "scatter",
  data: {
    datasets: SECTORS.map((name, idx) => ({
      label: name,
      data: [{ x: 0, y: 0 }],
      backgroundColor: t.palette[idx % t.palette.length],
      borderColor: t.palette[idx % t.palette.length],
      pointStyle: SECTOR_SHAPES[idx],
      pointRadius: 0,
      showLine: false,
    })),
  },
  options: {
    responsive: true,
    maintainAspectRatio: false,
    animation: false,
    layout: { padding: { top: 10, right: 20, bottom: 10, left: 20 } },
    scales: {
      x: { min: -1.4, max: 1.4, display: false, grid: { display: false } },
      y: { min: -1.4, max: 1.4, display: false, grid: { display: false } },
    },
    plugins: {
      title: {
        display: true,
        text: "radar-innovation-timeline · javascript · chartjs · anyplot.ai",
        color: t.ink,
        font: { size: 22, weight: "500" },
        padding: { bottom: 16 },
      },
      legend: {
        position: "bottom",
        labels: { color: t.ink, font: { size: 16 }, usePointStyle: true, pointStyleWidth: 14 },
      },
      tooltip: { enabled: false },
    },
  },
  plugins: [innovationRadar],
});
Runnable source as JSON, for any HTTP client: https://api.anyplot.ai/specs/radar-innovation-timeline/chartjs/code. Any spec id and library id listed in llms-full.txt fit the same URL shape; every URL below is complete and callable.
{
  "spec_id": "radar-innovation-timeline",
  "language": "javascript",
  "library": "chartjs",
  "page": "https://anyplot.ai/radar-innovation-timeline/javascript/chartjs",
  "hub": "https://anyplot.ai/radar-innovation-timeline",
  "code_json": "https://api.anyplot.ai/specs/radar-innovation-timeline/chartjs/code",
  "spec_json": "https://api.anyplot.ai/specs/radar-innovation-timeline",
  "render_light_png": "https://storage.googleapis.com/anyplot-images/plots/radar-innovation-timeline/javascript/chartjs/plot-light.png",
  "render_dark_png": "https://storage.googleapis.com/anyplot-images/plots/radar-innovation-timeline/javascript/chartjs/plot-dark.png",
  "interactive_light_html": "https://storage.googleapis.com/anyplot-images/plots/radar-innovation-timeline/javascript/chartjs/plot-light.html",
  "interactive_dark_html": "https://storage.googleapis.com/anyplot-images/plots/radar-innovation-timeline/javascript/chartjs/plot-dark.html",
  "quality_score": 93.0,
  "license": "MIT",
  "guide": "https://anyplot.ai/llms.txt"
}
Part of Innovation Radar with Time-Horizon Rings on anyplot.ai.