The same plot in 14 other libraries — Python: Altair, Bokeh, lets-plot, Matplotlib, Plotly, plotnine, Pygal, Seaborn; R: ggplot2; JavaScript: Chart.js, D3.js, Apache ECharts, Highcharts, MUI X Charts. Compare all 15 side by side: Innovation Radar with Time-Horizon Rings in Python, R, Julia and JavaScript.
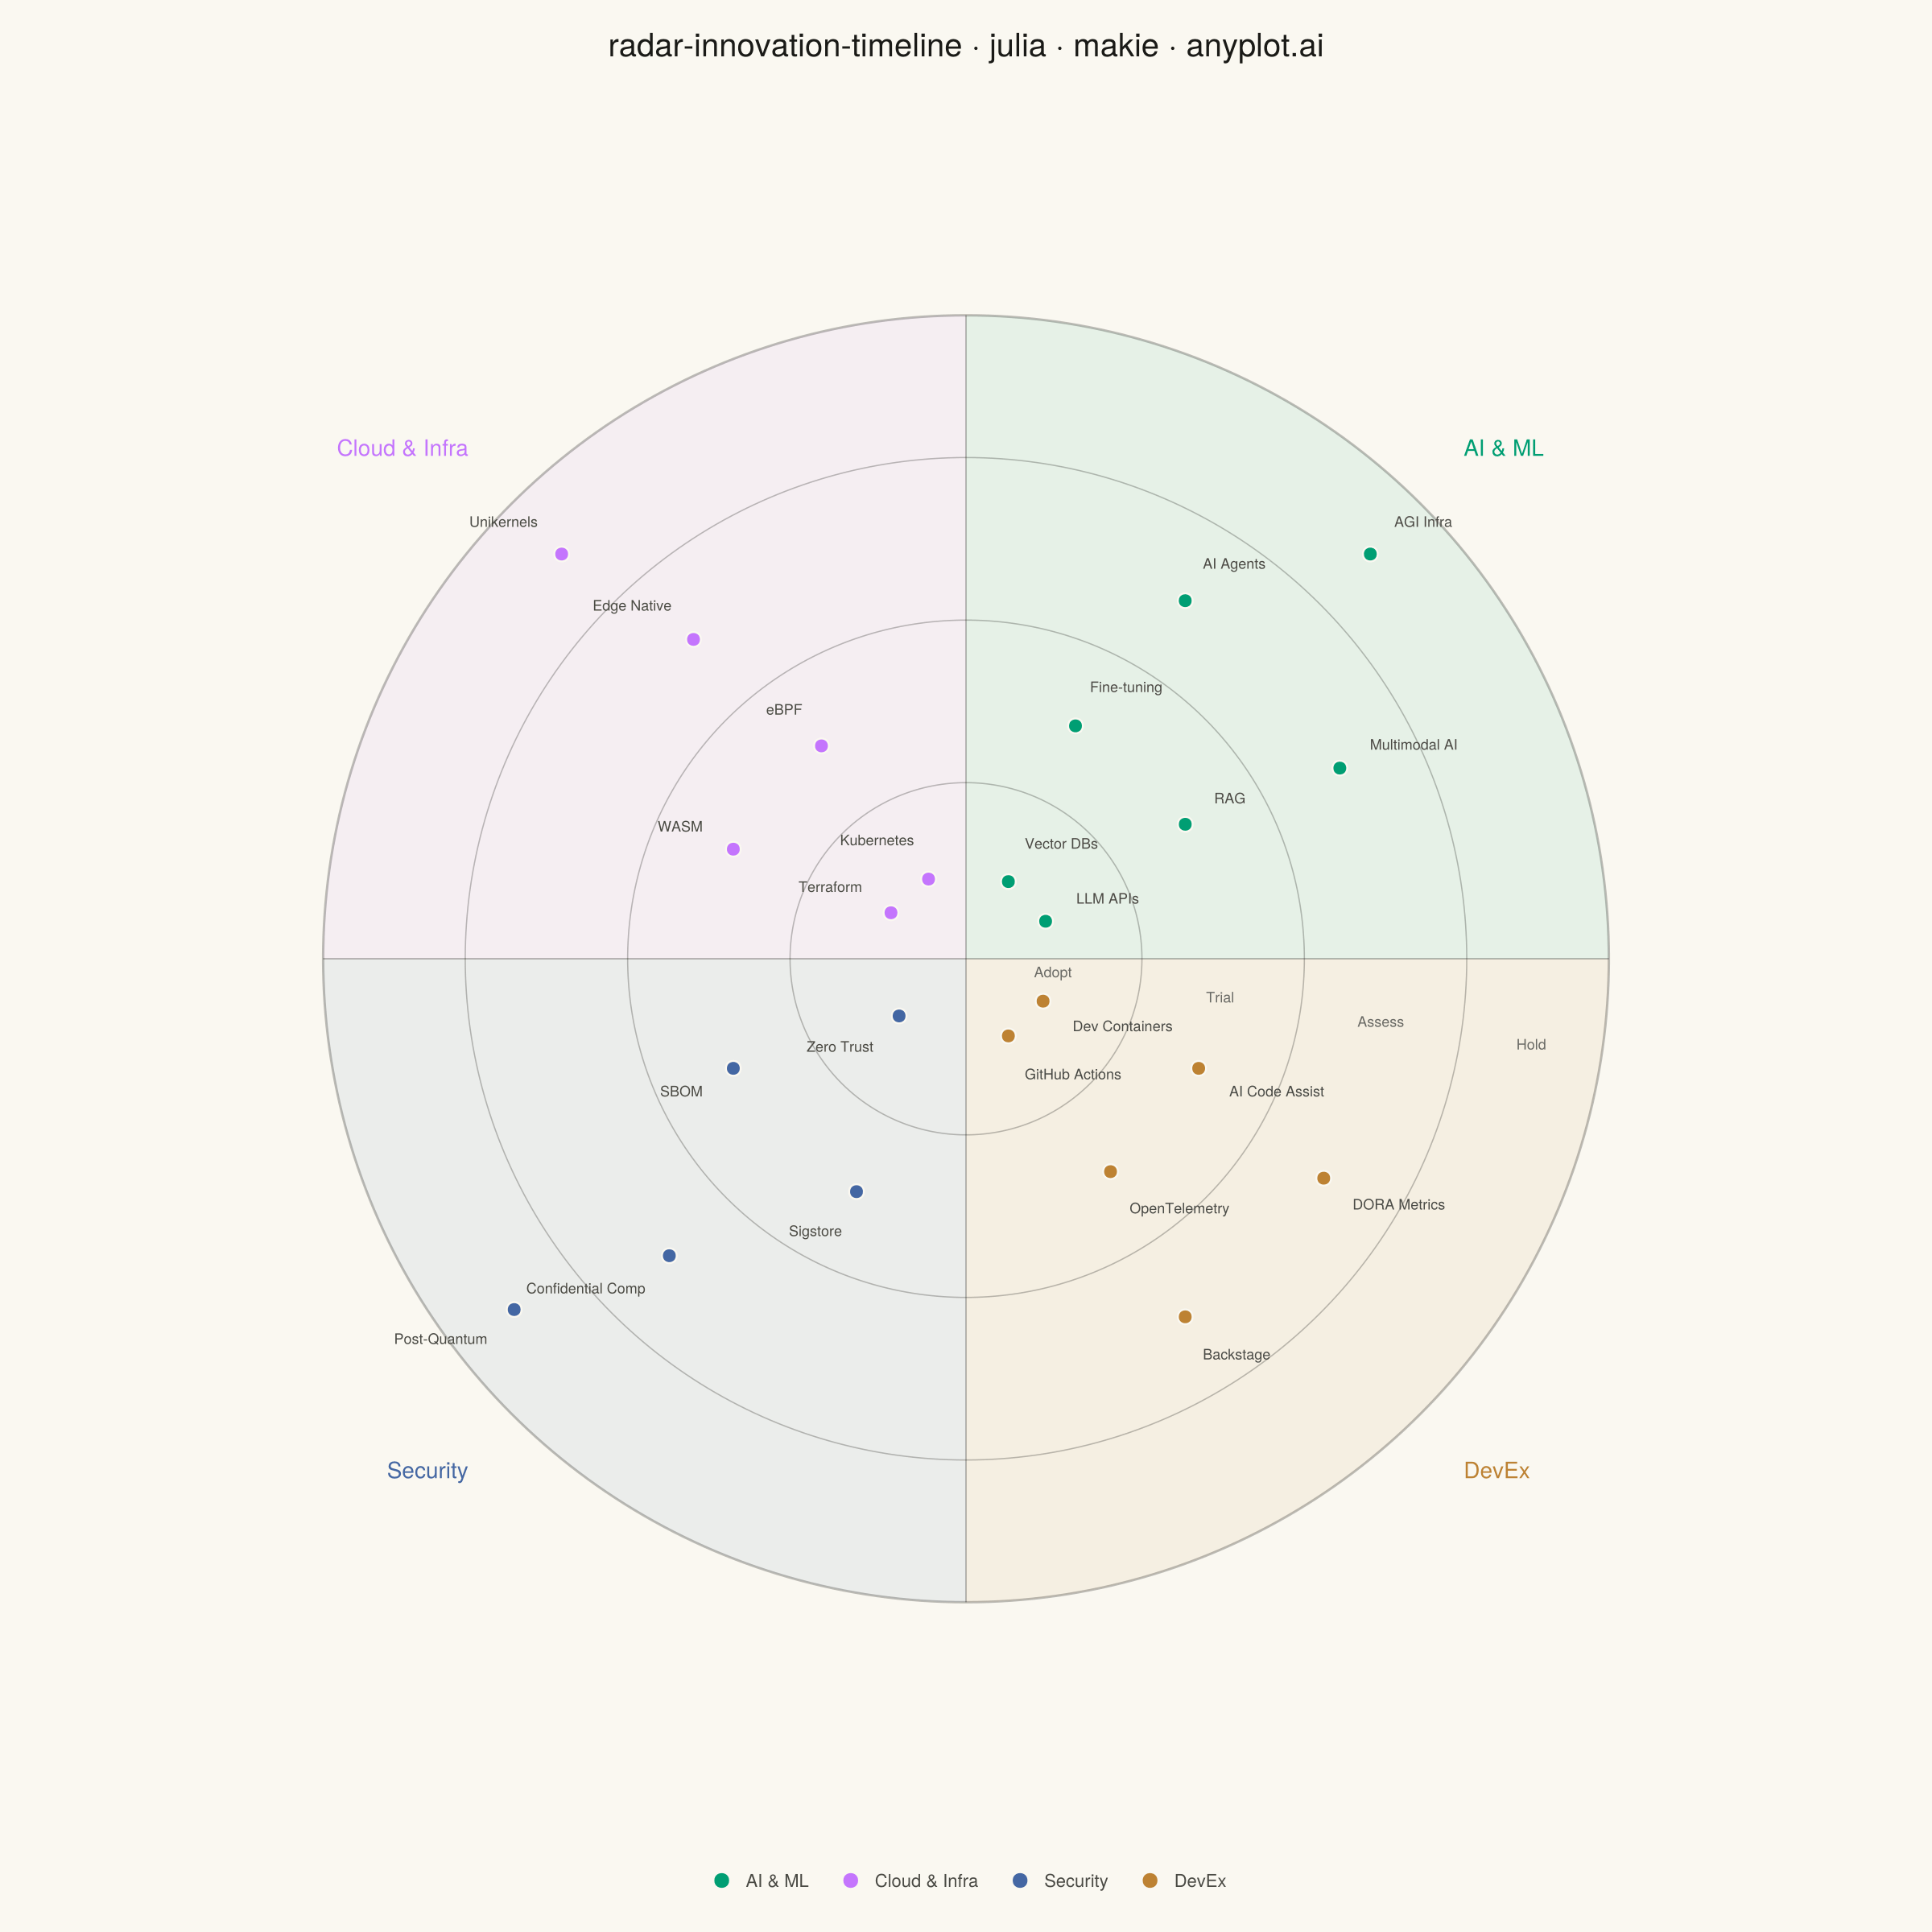
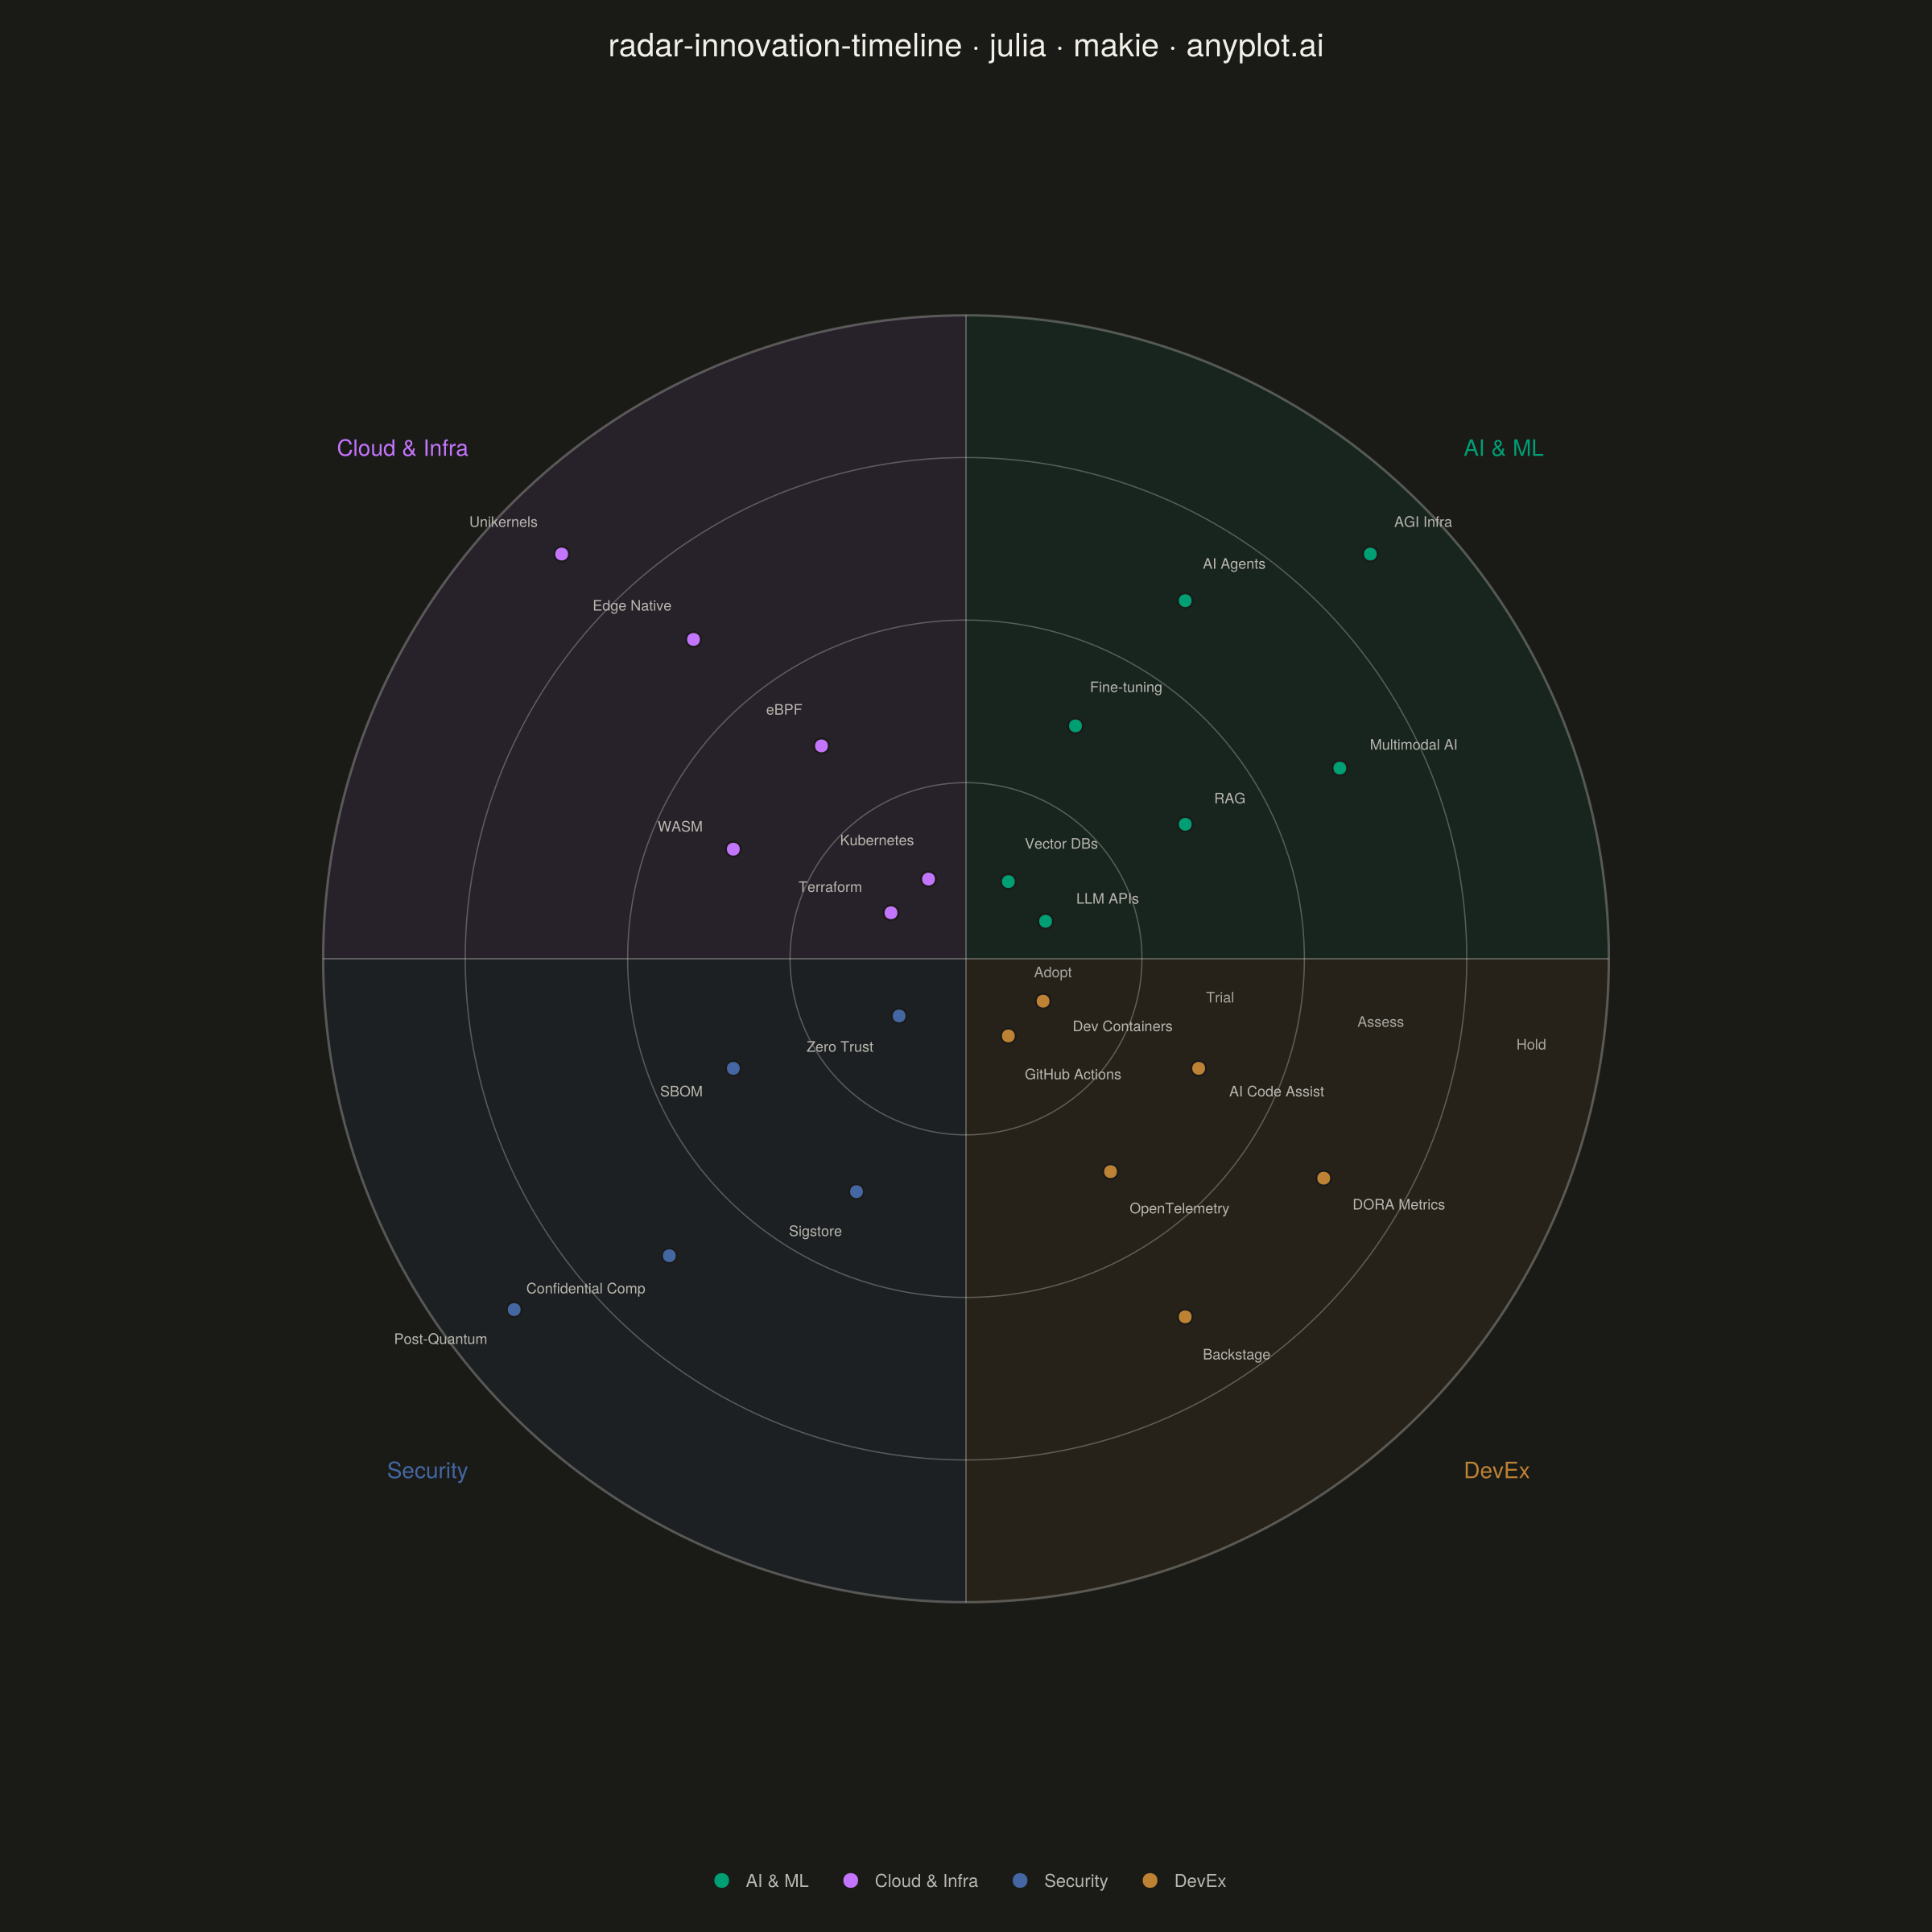
A radial chart that maps innovations, technologies, or trends onto concentric rings representing time horizons and angular sectors representing thematic categories. Inner rings represent near-term items (e.g., "Now", "Next 6 months") while outer rings represent longer-term or emerging trends (e.g., "2-5 years", "Future"). Each item is placed as a labeled point within its sector and ring, with distinct markers or colors encoding categories. Inspired by ThoughtWorks Technology Radar and similar strategic planning visualizations.
# anyplot.ai
# radar-innovation-timeline: Innovation Radar with Time-Horizon Rings
# Library: makie 0.22.10 | Julia 1.11.9
# Quality: 88/100 | Created: 2026-05-29

using CairoMakie
using Colors
using Random

Random.seed!(42)

# Theme tokens
const THEME       = get(ENV, "ANYPLOT_THEME", "light")
const PAGE_BG     = THEME == "light" ? colorant"#FAF8F1" : colorant"#1A1A17"
const ELEVATED_BG = THEME == "light" ? colorant"#FFFDF6" : colorant"#242420"
const INK         = THEME == "light" ? colorant"#1A1A17" : colorant"#F0EFE8"
const INK_SOFT    = THEME == "light" ? colorant"#4A4A44" : colorant"#B8B7B0"
const INK_MUTED   = THEME == "light" ? colorant"#6B6A63" : colorant"#A8A79F"

const IMPRINT_PALETTE = [
    colorant"#009E73",  # 1 — AI & ML (Imprint brand green, always first series)
    colorant"#C475FD",  # 2 — Cloud & Infra
    colorant"#4467A3",  # 3 — Security
    colorant"#BD8233",  # 4 — DevEx
]

const SECTORS = ["AI & ML", "Cloud & Infra", "Security", "DevEx"]
const RINGS   = ["Adopt", "Trial", "Assess", "Hold"]

# Ring boundaries (inner → outer radii, 4 bands)
const RING_BOUNDS  = [0.0, 0.26, 0.50, 0.74, 0.95]
const RING_CENTERS = [(RING_BOUNDS[i] + RING_BOUNDS[i+1]) / 2 for i in 1:4]

# Three-quarter (270°) layout — gap at bottom (225°–315°)
# Chart spans counterclockwise from 315° (= −π/4) to 225° (= 5π/4)
const TOTAL_SPAN    = 3π / 2
const SECTOR_SPAN   = TOTAL_SPAN / 4   # 67.5° per sector
const CHART_START   = -π / 4           # 315° from positive x-axis
const SECTOR_STARTS = [CHART_START + i * SECTOR_SPAN for i in 0:3]

# Items: (label, sector_idx, ring_idx, fraction_within_sector 0→1)
const ITEMS = [
    ("LLM APIs",          1, 1, 0.25),
    ("Vector DBs",        1, 1, 0.75),
    ("RAG",               1, 2, 0.30),
    ("Fine-tuning",       1, 2, 0.72),
    ("Multimodal AI",     1, 3, 0.28),
    ("AI Agents",         1, 3, 0.68),
    ("AGI Infra",         1, 4, 0.50),
    ("Kubernetes",        2, 1, 0.25),
    ("Terraform",         2, 1, 0.75),
    ("eBPF",              2, 2, 0.35),
    ("WASM",              2, 2, 0.72),
    ("Edge Native",       2, 3, 0.45),
    ("Unikernels",        2, 4, 0.50),
    ("Zero Trust",        3, 1, 0.50),
    ("SBOM",              3, 2, 0.28),
    ("Sigstore",          3, 2, 0.72),
    ("Confidential Comp", 3, 3, 0.50),
    ("Post-Quantum",      3, 4, 0.42),
    ("GitHub Actions",    4, 1, 0.25),
    ("Dev Containers",    4, 1, 0.75),
    ("OpenTelemetry",     4, 2, 0.35),
    ("AI Code Assist",    4, 2, 0.72),
    ("Backstage",         4, 3, 0.35),
    ("DORA Metrics",      4, 3, 0.65),
]

pol2cart(r, θ) = (r * cos(θ), r * sin(θ))

# Figure — square canvas → 2400×2400 px
fig = Figure(
    size            = (1200, 1200),
    fontsize        = 14,
    backgroundcolor = PAGE_BG,
)

ax = Axis(
    fig[1, 1];
    backgroundcolor = PAGE_BG,
    aspect          = DataAspect(),
)
hidedecorations!(ax)
hidespines!(ax)

n_arc = 120

# 1. Per-ring background fills — alternating neutral shading separates time horizons
ring_fill_alphas = [0.08, 0.02, 0.07, 0.02]
for (i, alpha) in enumerate(ring_fill_alphas)
    r_inner = RING_BOUNDS[i]
    r_outer = RING_BOUNDS[i + 1]
    θs  = LinRange(CHART_START, CHART_START + TOTAL_SPAN, n_arc)
    pts = Point2f[]
    for t in θs
        push!(pts, Point2f(pol2cart(r_outer, t)...))
    end
    if r_inner == 0.0
        push!(pts, Point2f(0.0f0, 0.0f0))
    else
        for t in reverse(θs)
            push!(pts, Point2f(pol2cart(r_inner, t)...))
        end
    end
    poly!(ax, pts; color = (INK, alpha), strokewidth = 0)
end

# 2. Sector fills — subtle tinted wedges overlay ring fills for sector identity
for i in 1:4
    θ_start = SECTOR_STARTS[i]
    θ_end   = θ_start + SECTOR_SPAN
    pts = Point2f[(0.0f0, 0.0f0)]
    for t in LinRange(θ_start, θ_end, n_arc)
        push!(pts, Point2f(pol2cart(RING_BOUNDS[5], t)...))
    end
    poly!(ax, pts; color = (IMPRINT_PALETTE[i], 0.07f0), strokewidth = 0)
end

# 3. Ring outlines — partial arcs spanning the 270° chart
for (k, r) in enumerate(RING_BOUNDS)
    r == 0.0 && continue
    θs = LinRange(CHART_START, CHART_START + TOTAL_SPAN, n_arc + 1)
    xs = r .* cos.(θs)
    ys = r .* sin.(θs)
    lw = (k == length(RING_BOUNDS)) ? 1.5f0 : 0.8f0
    lines!(ax, xs, ys; color = (INK, 0.30f0), linewidth = lw)
end

# 4. Sector dividers — radial lines at each sector boundary and chart endpoints
for θ in [SECTOR_STARTS; CHART_START + TOTAL_SPAN]
    x2, y2 = pol2cart(RING_BOUNDS[5], θ)
    lines!(ax, [0.0f0, Float32(x2)], [0.0f0, Float32(y2)];
           color = (INK, 0.28f0), linewidth = 1.0f0)
end

# 5. Ring labels — placed in the 90° gap (−90° = straight down) for clear separation
for (i, ring_name) in enumerate(RINGS)
    r = RING_CENTERS[i]
    xl, yl = pol2cart(r, -π / 2)
    text!(ax, xl, yl; text = ring_name,
          fontsize = 12,
          color    = INK_MUTED,
          align    = (:center, :center))
end

# 6. Sector headers — labels just outside the outermost ring
header_r = RING_BOUNDS[5] + 0.10
for (i, sector_name) in enumerate(SECTORS)
    θ_mid = SECTOR_STARTS[i] + SECTOR_SPAN / 2
    xl, yl = pol2cart(header_r, θ_mid)
    ha = cos(θ_mid) > 0.15 ? :left : (cos(θ_mid) < -0.15 ? :right : :center)
    va = sin(θ_mid) > 0.15 ? :bottom : (sin(θ_mid) < -0.15 ? :top : :center)
    text!(ax, xl, yl; text = sector_name,
          fontsize = 14,
          color    = IMPRINT_PALETTE[i],
          align    = (ha, va))
end

# 7. Data points — scatter, colored by sector
for (label, sec, ring, frac) in ITEMS
    θ = SECTOR_STARTS[sec] + frac * SECTOR_SPAN
    r = RING_CENTERS[ring]
    x, y = pol2cart(r, θ)
    scatter!(ax, [x], [y];
             color       = IMPRINT_PALETTE[sec],
             markersize  = 13,
             strokewidth = 1.2f0,
             strokecolor = PAGE_BG)
end

# 8. Item labels — offset radially outward from each point
for (label, sec, ring, frac) in ITEMS
    θ = SECTOR_STARTS[sec] + frac * SECTOR_SPAN
    r = RING_CENTERS[ring]
    x, y = pol2cart(r, θ)
    offset = 0.055
    xl = x + offset * cos(θ)
    yl = y + offset * sin(θ)
    ha = cos(θ) > 0.15 ? :left : (cos(θ) < -0.15 ? :right : :center)
    va = sin(θ) > 0.15 ? :bottom : (sin(θ) < -0.15 ? :top : :center)
    text!(ax, xl, yl; text = label,
          fontsize = 10,
          color    = INK_SOFT,
          align    = (ha, va))
end

# Axis limits — accommodate sector headers, ring labels in gap, and item labels
xlims!(ax, -1.40, 1.40)
ylims!(ax, -1.10, 1.25)

# Title
title_str      = "radar-innovation-timeline · julia · makie · anyplot.ai"
title_n        = length(title_str)
title_fontsize = title_n > 67 ? round(Int, 20 * 67 / title_n) : 20

Label(fig[0, 1], title_str;
      fontsize  = title_fontsize,
      color     = INK,
      tellwidth = false)

# Legend
legend_elems = [MarkerElement(color = IMPRINT_PALETTE[i], marker = :circle, markersize = 13)
                for i in 1:4]
Legend(fig[2, 1], legend_elems, SECTORS;
       orientation  = :horizontal,
       framevisible = false,
       labelcolor   = INK_SOFT,
       labelsize    = 11,
       tellwidth    = false)

# Save
save("plot-$(THEME).png", fig; px_per_unit = 2)
Runnable source as JSON, for any HTTP client: https://api.anyplot.ai/specs/radar-innovation-timeline/makie/code. Any spec id and library id listed in llms-full.txt fit the same URL shape; every URL below is complete and callable.
{
  "spec_id": "radar-innovation-timeline",
  "language": "julia",
  "library": "makie",
  "page": "https://anyplot.ai/radar-innovation-timeline/julia/makie",
  "hub": "https://anyplot.ai/radar-innovation-timeline",
  "code_json": "https://api.anyplot.ai/specs/radar-innovation-timeline/makie/code",
  "spec_json": "https://api.anyplot.ai/specs/radar-innovation-timeline",
  "render_light_png": "https://storage.googleapis.com/anyplot-images/plots/radar-innovation-timeline/julia/makie/plot-light.png",
  "render_dark_png": "https://storage.googleapis.com/anyplot-images/plots/radar-innovation-timeline/julia/makie/plot-dark.png",
  "quality_score": 88.0,
  "license": "MIT",
  "guide": "https://anyplot.ai/llms.txt"
}
Part of Innovation Radar with Time-Horizon Rings on anyplot.ai.