The same plot in 14 other libraries — JavaScript: Chart.js, D3.js, Apache ECharts, Highcharts; Python: Altair, Bokeh, lets-plot, Matplotlib, Plotly, plotnine, Pygal, Seaborn; R: ggplot2; Julia: Makie.jl. Compare all 15 side by side: Innovation Radar with Time-Horizon Rings in Python, R, Julia and JavaScript.
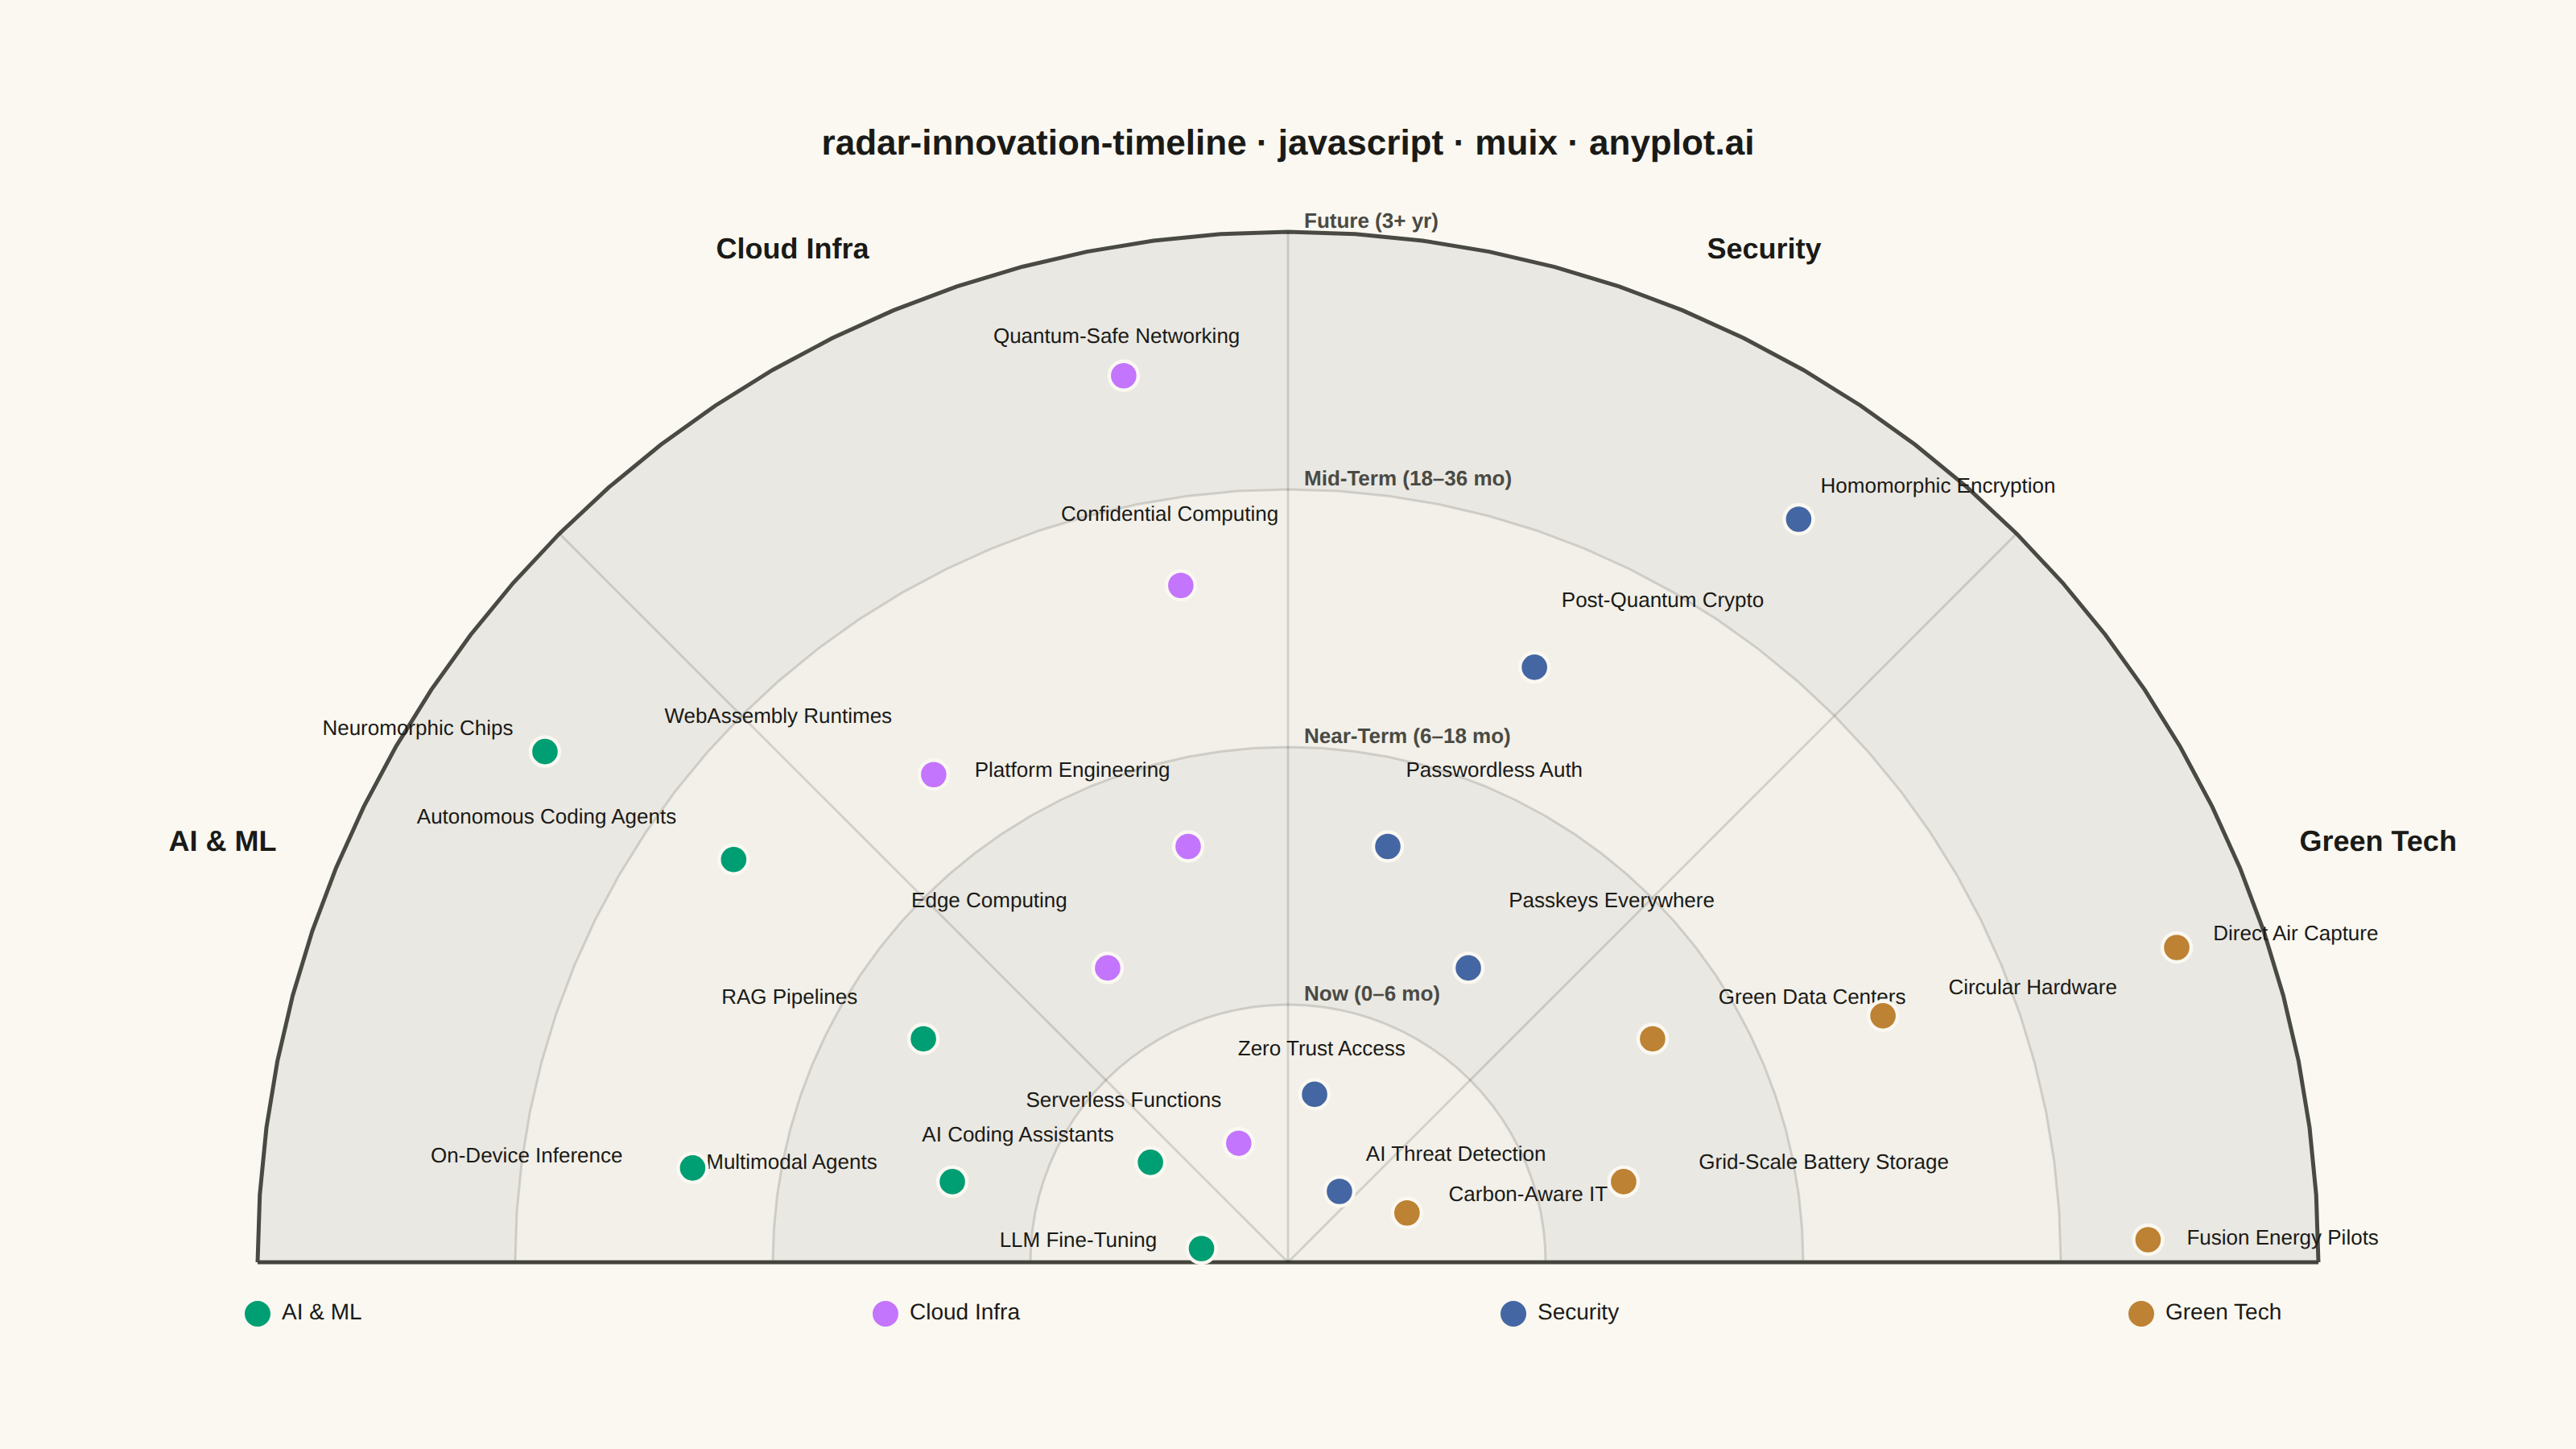
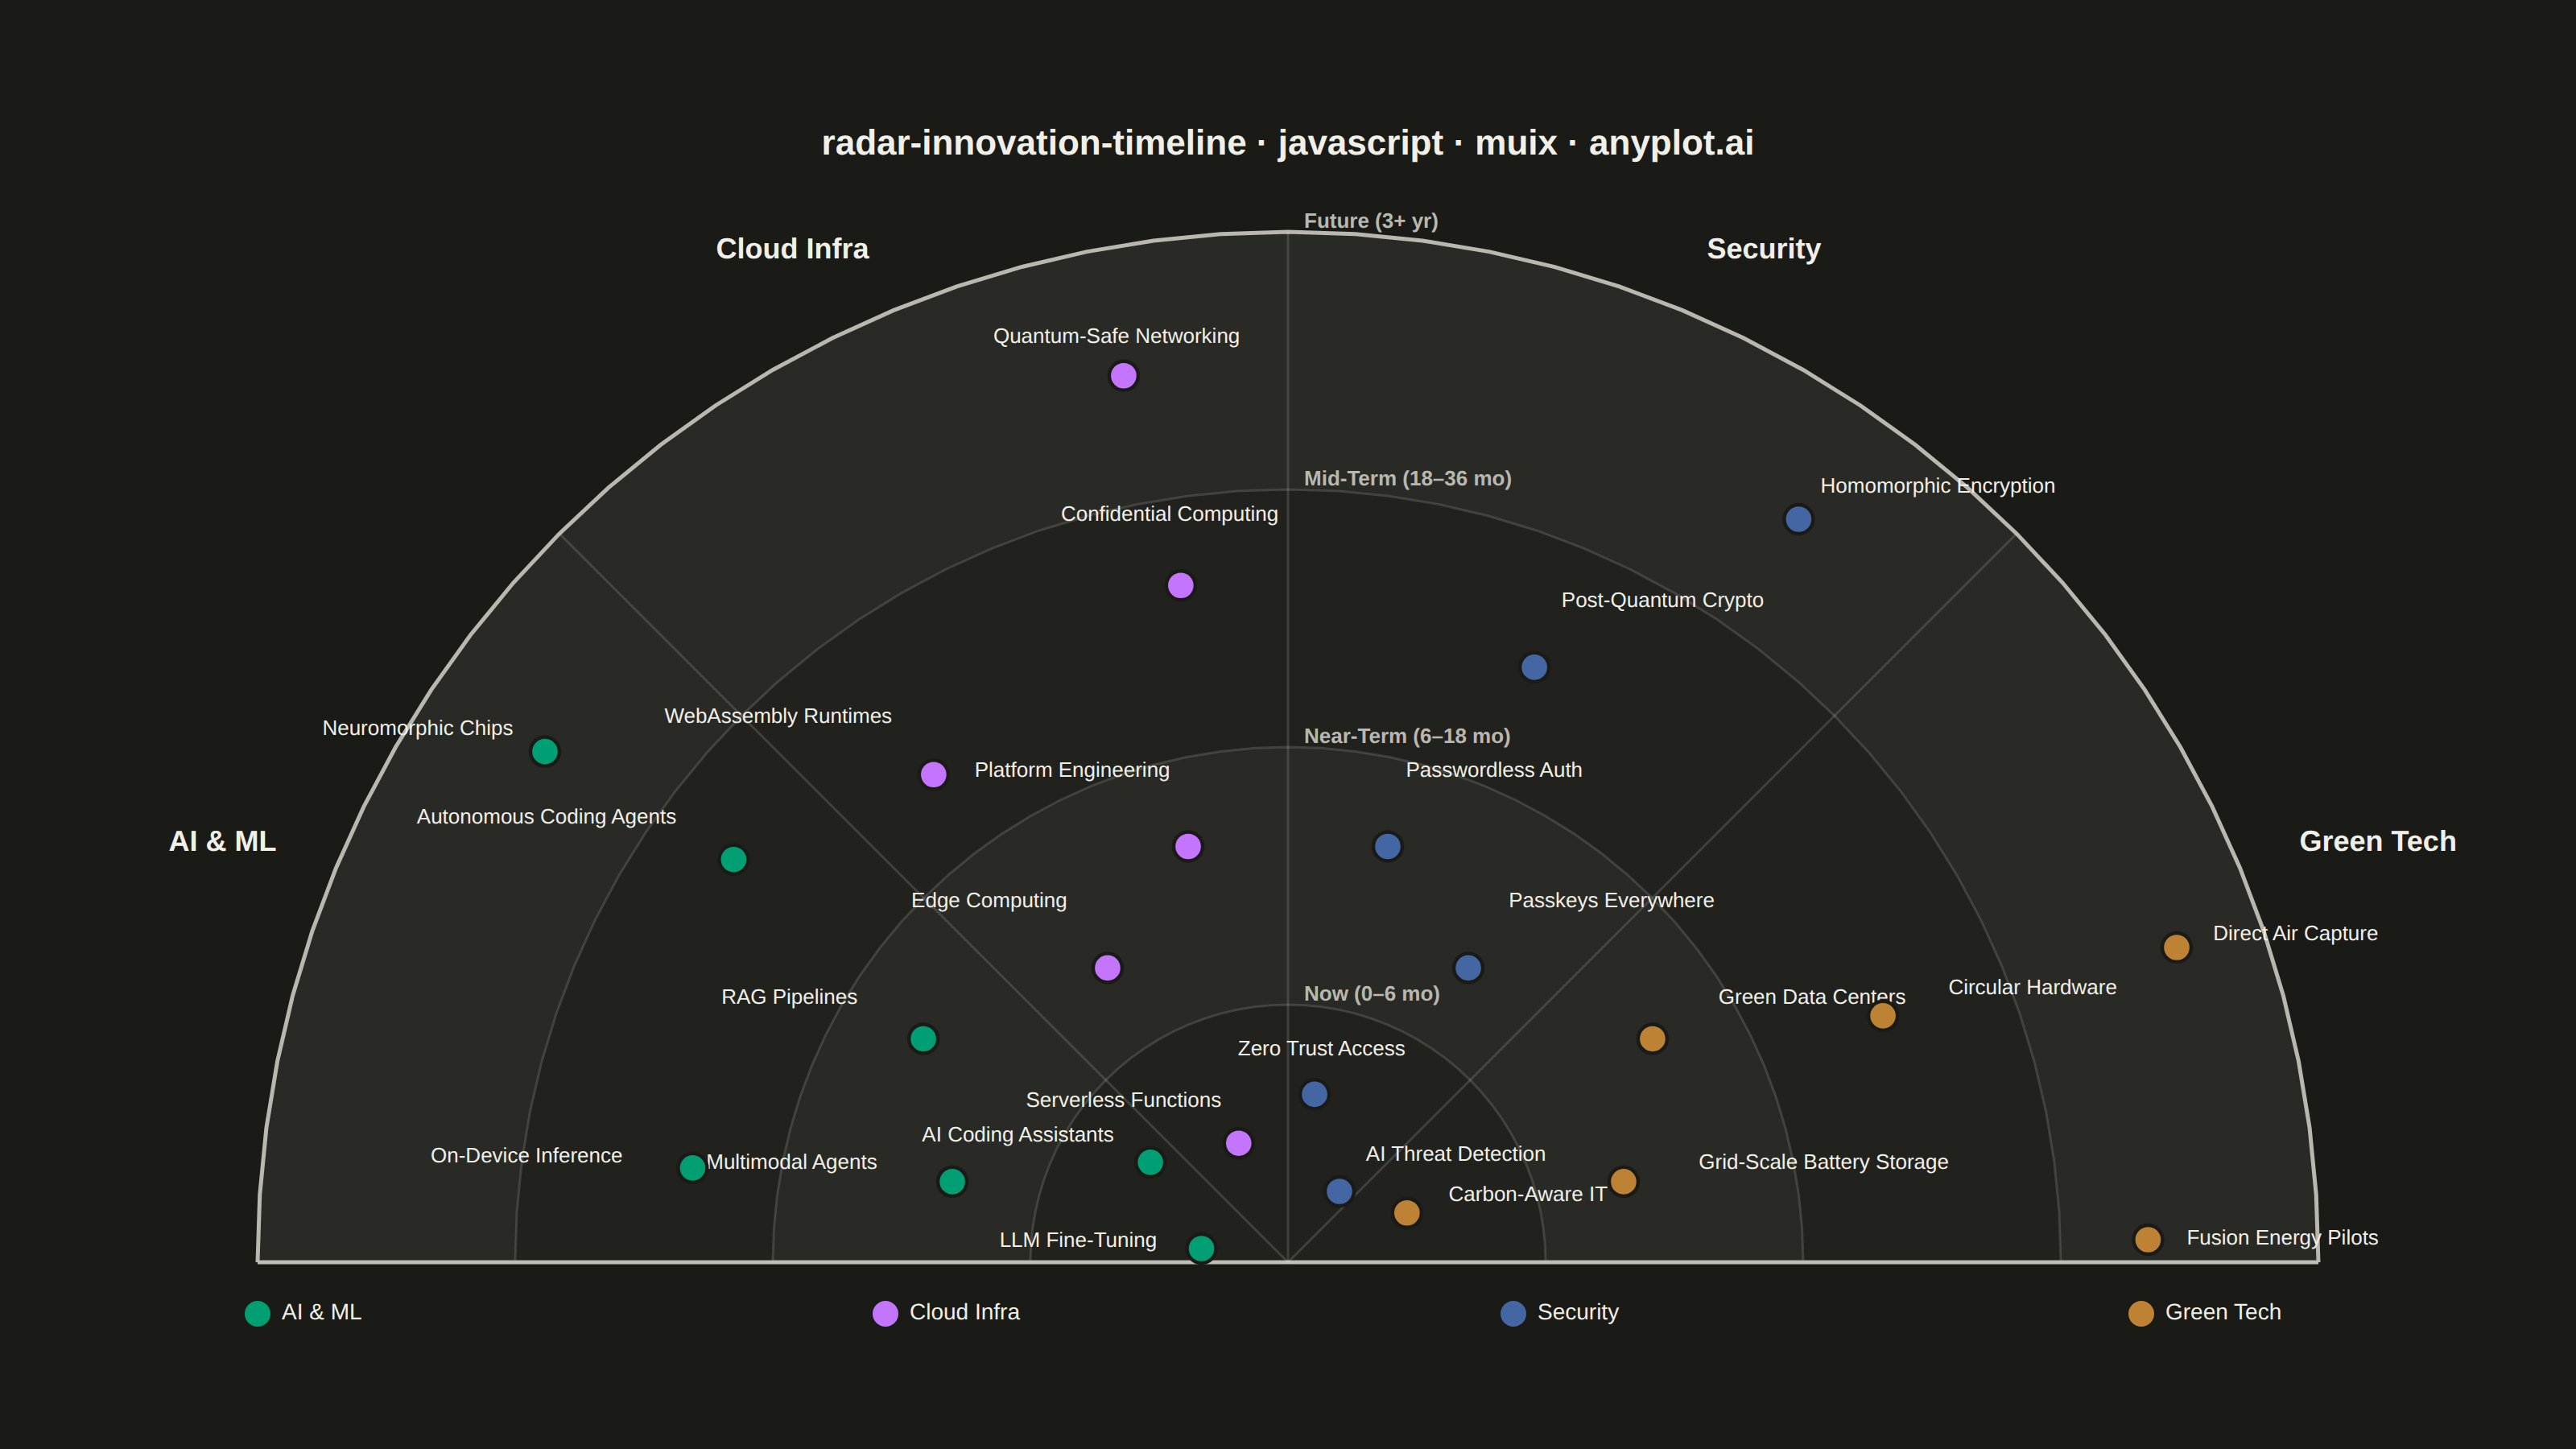
A radial chart that maps innovations, technologies, or trends onto concentric rings representing time horizons and angular sectors representing thematic categories. Inner rings represent near-term items (e.g., "Now", "Next 6 months") while outer rings represent longer-term or emerging trends (e.g., "2-5 years", "Future"). Each item is placed as a labeled point within its sector and ring, with distinct markers or colors encoding categories. Inspired by ThoughtWorks Technology Radar and similar strategic planning visualizations.
// anyplot.ai
// radar-innovation-timeline: Innovation Radar with Time-Horizon Rings
// Library: muix 7.29.1 | JavaScript 22.23.2
// Quality: 89/100 | Created: 2026-08-26
import { ChartContainer } from "@mui/x-charts/ChartContainer";
import { useXScale, useYScale } from "@mui/x-charts/hooks";
import Box from "@mui/material/Box";
import Typography from "@mui/material/Typography";

const t = window.ANYPLOT_TOKENS;

// --- Data (in-memory, deterministic) ----------------------------------------
// Strategic technology planning: emerging tech mapped by adoption horizon
// (ring, inner→outer) across four thematic sectors (angular wedge).
const RINGS = [
  { key: "now", label: "Now (0–6 mo)" },
  { key: "near", label: "Near-Term (6–18 mo)" },
  { key: "mid", label: "Mid-Term (18–36 mo)" },
  { key: "future", label: "Future (3+ yr)" },
];

const SECTORS = [
  { key: "ai", label: "AI & ML" },
  { key: "cloud", label: "Cloud Infra" },
  { key: "security", label: "Security" },
  { key: "sustain", label: "Green Tech" },
];

// Uneven per-(ring, sector) density — real technology radars cluster rather
// than filling a uniform grid: most cells hold one item, several hold two or
// three. Every ring and sector still has at least one item.
const ITEMS = [
  { name: "LLM Fine-Tuning", ring: 0, sector: 0 },
  { name: "AI Coding Assistants", ring: 0, sector: 0 },
  { name: "Multimodal Agents", ring: 1, sector: 0 },
  { name: "RAG Pipelines", ring: 1, sector: 0 },
  { name: "On-Device Inference", ring: 2, sector: 0 },
  { name: "Autonomous Coding Agents", ring: 2, sector: 0 },
  { name: "Neuromorphic Chips", ring: 3, sector: 0 },
  { name: "Serverless Functions", ring: 0, sector: 1 },
  { name: "Edge Computing", ring: 1, sector: 1 },
  { name: "Platform Engineering", ring: 1, sector: 1 },
  { name: "WebAssembly Runtimes", ring: 2, sector: 1 },
  { name: "Confidential Computing", ring: 2, sector: 1 },
  { name: "Quantum-Safe Networking", ring: 3, sector: 1 },
  { name: "Zero Trust Access", ring: 0, sector: 2 },
  { name: "AI Threat Detection", ring: 0, sector: 2 },
  { name: "Passwordless Auth", ring: 1, sector: 2 },
  { name: "Passkeys Everywhere", ring: 1, sector: 2 },
  { name: "Post-Quantum Crypto", ring: 2, sector: 2 },
  { name: "Homomorphic Encryption", ring: 3, sector: 2 },
  { name: "Carbon-Aware IT", ring: 0, sector: 3 },
  { name: "Green Data Centers", ring: 1, sector: 3 },
  { name: "Grid-Scale Battery Storage", ring: 1, sector: 3 },
  { name: "Circular Hardware", ring: 2, sector: 3 },
  { name: "Direct Air Capture", ring: 3, sector: 3 },
  { name: "Fusion Energy Pilots", ring: 3, sector: 3 },
];

// --- Geometry (half-circle: rings sweep 180°→0°, sectors divide the arc) ----
// The chart's domain is set 1:1 with CSS px (chartWidth === xDomainLen,
// chartHeight === yDomainLen, zero ChartContainer margin) so the semicircle
// is sized directly against the canvas instead of being squeezed by a
// height-driven aspect ratio that leaves the sides empty.
const R_MAX = 640;
const RING_BOUNDS = [0, 160, 320, 480, 640];
const SECTOR_SPAN = 180 / SECTORS.length;
const SECTOR_LABEL_R = R_MAX + 40;
// Outward reach of each item's label, per ring — smallest on the outer ring
// so it doesn't crowd the sector header just beyond R_MAX.
const LABEL_OFFSET = [28, 48, 44, 24];
// The outermost ring sits closest to the sector headers; nudging its items
// off the sector's exact center angle keeps single-occupant outer cells from
// landing directly under the header text (same ray, different radius only).
const OUTER_RING_NUDGE = 12;
const X_HALF = SECTOR_LABEL_R + 100;
const Y_TOP = R_MAX + 24;
const Y_BOTTOM = -60;

// Group items by (ring, sector) cell, then fan multiple occupants across the
// sector's angular span and stagger their radius within the ring band — the
// "smart label placement / angular jitter / radial offset" the spec's Notes
// call for. A lone occupant (n=1) still lands dead-center at the ring's
// midpoint radius, matching the simple case exactly.
const CELLS = new Map();
ITEMS.forEach((item) => {
  const key = `${item.ring}-${item.sector}`;
  if (!CELLS.has(key)) CELLS.set(key, []);
  CELLS.get(key).push(item);
});

const POINTS = [];
CELLS.forEach((cell, key) => {
  const [ringIdx, sectorIdx] = key.split("-").map(Number);
  const sectorStart = 180 - sectorIdx * SECTOR_SPAN;
  const ringInner = RING_BOUNDS[ringIdx];
  const ringOuter = RING_BOUNDS[ringIdx + 1];
  const baseRadius = (ringInner + ringOuter) / 2;
  const radialJitterStep = (ringOuter - ringInner) * 0.32;
  const isOuterRing = ringIdx === RINGS.length - 1;
  // Rings alternate which portion of the sector's angular span they favor,
  // so two crowded cells sharing a sector but sitting in adjacent rings
  // don't land on near-identical angles.
  const [pad, span] = ringIdx % 2 === 0 ? [0.2, 0.6] : [0.3, 0.4];
  // Within a sector, sin(angle) rises toward the sector nearest the top (90°)
  // and falls away from it; staggering the radius in that same direction
  // (instead of a fixed sign) makes the angular and radial spread compound
  // into more vertical separation rather than canceling out.
  const sign = sectorIdx < SECTORS.length / 2 ? 1 : -1;
  const n = cell.length;
  cell.forEach((item, i) => {
    const frac = n === 1 ? 0.5 : pad + span * (i / (n - 1));
    const angle = sectorStart - SECTOR_SPAN * frac - (isOuterRing ? OUTER_RING_NUDGE : 0);
    const radius = baseRadius + sign * (i - (n - 1) / 2) * radialJitterStep;
    POINTS.push({ ...item, angle, radius, labelOffset: LABEL_OFFSET[ringIdx] });
  });
});

// --- Radar diagram (custom marks composed on the MUI X cartesian scales) ----
function RadarDiagram() {
  const xScale = useXScale();
  const yScale = useYScale();

  const toPx = (radius, angleDeg) => {
    const rad = (angleDeg * Math.PI) / 180;
    return [xScale(radius * Math.cos(rad)), yScale(radius * Math.sin(rad))];
  };
  const arcPoints = (radius, steps = 48) =>
    Array.from({ length: steps + 1 }, (_, i) => toPx(radius, 180 - (180 * i) / steps));
  const toPath = (pts) => pts.map(([x, y], i) => `${i === 0 ? "M" : "L"}${x},${y}`).join(" ");

  const dividerAngles = Array.from({ length: SECTORS.length + 1 }, (_, i) => 180 - i * SECTOR_SPAN);

  return (
    <g>
      {/* Subtle alternating fill per ring — separates the time horizons */}
      {RINGS.map((ring, i) => {
        const rInner = RING_BOUNDS[i];
        const rOuter = RING_BOUNDS[i + 1];
        const outerArc = arcPoints(rOuter);
        const innerArc = rInner === 0 ? [toPx(0, 90)] : arcPoints(rInner).reverse();
        const d = `${toPath(outerArc)} L${innerArc.map(([x, y]) => `${x},${y}`).join(" L")} Z`;
        return <path key={ring.key} d={d} fill={t.ink} opacity={i % 2 === 0 ? 0.035 : 0.07} stroke="none" />;
      })}

      {/* Ring boundary lines (outer ring gets a bolder frame) */}
      {RING_BOUNDS.slice(1).map((r, i) => (
        <path
          key={`ring-line-${r}`}
          d={toPath(arcPoints(r))}
          fill="none"
          stroke={i === RING_BOUNDS.length - 2 ? t.inkSoft : t.grid}
          strokeWidth={i === RING_BOUNDS.length - 2 ? 2.5 : 1.5}
        />
      ))}

      {/* Baseline diameter */}
      <path d={toPath([toPx(R_MAX, 180), toPx(R_MAX, 0)])} stroke={t.inkSoft} strokeWidth={2.5} />

      {/* Sector divider spokes */}
      {dividerAngles.map((angle) => (
        <path key={`div-${angle}`} d={toPath([toPx(0, angle), toPx(R_MAX, angle)])} stroke={t.grid} strokeWidth={1.5} />
      ))}

      {/* Ring names integrated at each ring's own boundary along the top
          spine (a sector divider, so it never competes with an item label) —
          closer to the rings than a separate row below the baseline. */}
      {RING_BOUNDS.slice(1).map((r, i) => {
        const [x, y] = toPx(r, 90);
        return (
          <text key={`ring-label-${RINGS[i].key}`} x={x + 10} y={y - 6} fontSize={13} fontWeight={600} fill={t.inkSoft} textAnchor="start" dominantBaseline="middle">
            {RINGS[i].label}
          </text>
        );
      })}

      {/* Sector headers along the outer edge */}
      {SECTORS.map((sector, i) => {
        const sectorStart = 180 - i * SECTOR_SPAN;
        const mid = sectorStart - SECTOR_SPAN / 2;
        const [x, y] = toPx(SECTOR_LABEL_R, mid);
        const cos = Math.cos((mid * Math.PI) / 180);
        const anchor = cos > 0.25 ? "start" : cos < -0.25 ? "end" : "middle";
        return (
          <text key={`sector-label-${sector.key}`} x={x} y={y} fontSize={18} fontWeight={700} fill={t.ink} textAnchor={anchor} dominantBaseline="middle">
            {sector.label}
          </text>
        );
      })}

      {/* Sector color legend, a single compact row below the baseline */}
      {SECTORS.map((sector, i) => {
        const slot = (2 * X_HALF) / SECTORS.length;
        const cx = xScale(-X_HALF + slot * (i + 0.5));
        const cy = yScale(-32);
        return (
          <g key={`legend-${sector.key}`}>
            <circle cx={cx - 55} cy={cy} r={9} fill={t.palette[i]} stroke={t.pageBg} strokeWidth={2} />
            <text x={cx - 40} y={cy} fontSize={14} fill={t.ink} textAnchor="start" dominantBaseline="middle">
              {sector.label}
            </text>
          </g>
        );
      })}

      {/* Items — marker + outward radial label, colored by sector */}
      {POINTS.map((p) => {
        const [mx, my] = toPx(p.radius, p.angle);
        const [lx, ly] = toPx(p.radius + p.labelOffset, p.angle);
        const cos = Math.cos((p.angle * Math.PI) / 180);
        const anchor = cos > 0.2 ? "start" : cos < -0.2 ? "end" : "middle";
        return (
          <g key={p.name}>
            <circle cx={mx} cy={my} r={9} fill={t.palette[p.sector]} stroke={t.pageBg} strokeWidth={2.2} />
            <text x={lx} y={ly} fontSize={13} fill={t.ink} textAnchor={anchor} dominantBaseline="middle">
              {p.name}
            </text>
          </g>
        );
      })}
    </g>
  );
}

// --- Chart (default-exported component — the harness mounts it) ------------
export default function Chart() {
  const size = window.ANYPLOT_SIZE;
  const titleHeight = 64;
  // Domain bounds are set 1:1 with CSS px (see geometry comment above), so
  // the ChartContainer's own size *is* the drawing area, filling the
  // available width directly instead of being derived from it.
  const chartWidth = 2 * X_HALF;
  const chartHeight = Y_TOP - Y_BOTTOM;

  return (
    <Box sx={{ width: size.width, height: size.height, display: "flex", flexDirection: "column", alignItems: "center", justifyContent: "center" }}>
      <Box sx={{ height: titleHeight, display: "flex", alignItems: "center" }}>
        <Typography sx={{ fontSize: 22, fontWeight: 600, color: t.ink }}>
          radar-innovation-timeline · javascript · muix · anyplot.ai
        </Typography>
      </Box>
      <ChartContainer
        width={chartWidth}
        height={chartHeight}
        series={[]}
        xAxis={[{ min: -X_HALF, max: X_HALF, scaleType: "linear", domainLimit: "strict" }]}
        yAxis={[{ min: Y_BOTTOM, max: Y_TOP, scaleType: "linear", domainLimit: "strict" }]}
        margin={{ top: 0, bottom: 0, left: 0, right: 0 }}
        skipAnimation
      >
        <RadarDiagram />
      </ChartContainer>
    </Box>
  );
}
Runnable source as JSON, for any HTTP client: https://api.anyplot.ai/specs/radar-innovation-timeline/muix/code. Any spec id and library id listed in llms-full.txt fit the same URL shape; every URL below is complete and callable.
{
  "spec_id": "radar-innovation-timeline",
  "language": "javascript",
  "library": "muix",
  "page": "https://anyplot.ai/radar-innovation-timeline/javascript/muix",
  "hub": "https://anyplot.ai/radar-innovation-timeline",
  "code_json": "https://api.anyplot.ai/specs/radar-innovation-timeline/muix/code",
  "spec_json": "https://api.anyplot.ai/specs/radar-innovation-timeline",
  "render_light_png": "https://storage.googleapis.com/anyplot-images/plots/radar-innovation-timeline/javascript/muix/plot-light.png",
  "render_dark_png": "https://storage.googleapis.com/anyplot-images/plots/radar-innovation-timeline/javascript/muix/plot-dark.png",
  "interactive_light_html": "https://storage.googleapis.com/anyplot-images/plots/radar-innovation-timeline/javascript/muix/plot-light.html",
  "interactive_dark_html": "https://storage.googleapis.com/anyplot-images/plots/radar-innovation-timeline/javascript/muix/plot-dark.html",
  "quality_score": 89.0,
  "license": "MIT",
  "guide": "https://anyplot.ai/llms.txt"
}
Part of Innovation Radar with Time-Horizon Rings on anyplot.ai.