The same plot in 14 other libraries — JavaScript: Chart.js, Apache ECharts, Highcharts, MUI X Charts; Python: Altair, Bokeh, lets-plot, Matplotlib, Plotly, plotnine, Pygal, Seaborn; R: ggplot2; Julia: Makie.jl. Compare all 15 side by side: Innovation Radar with Time-Horizon Rings in Python, R, Julia and JavaScript.
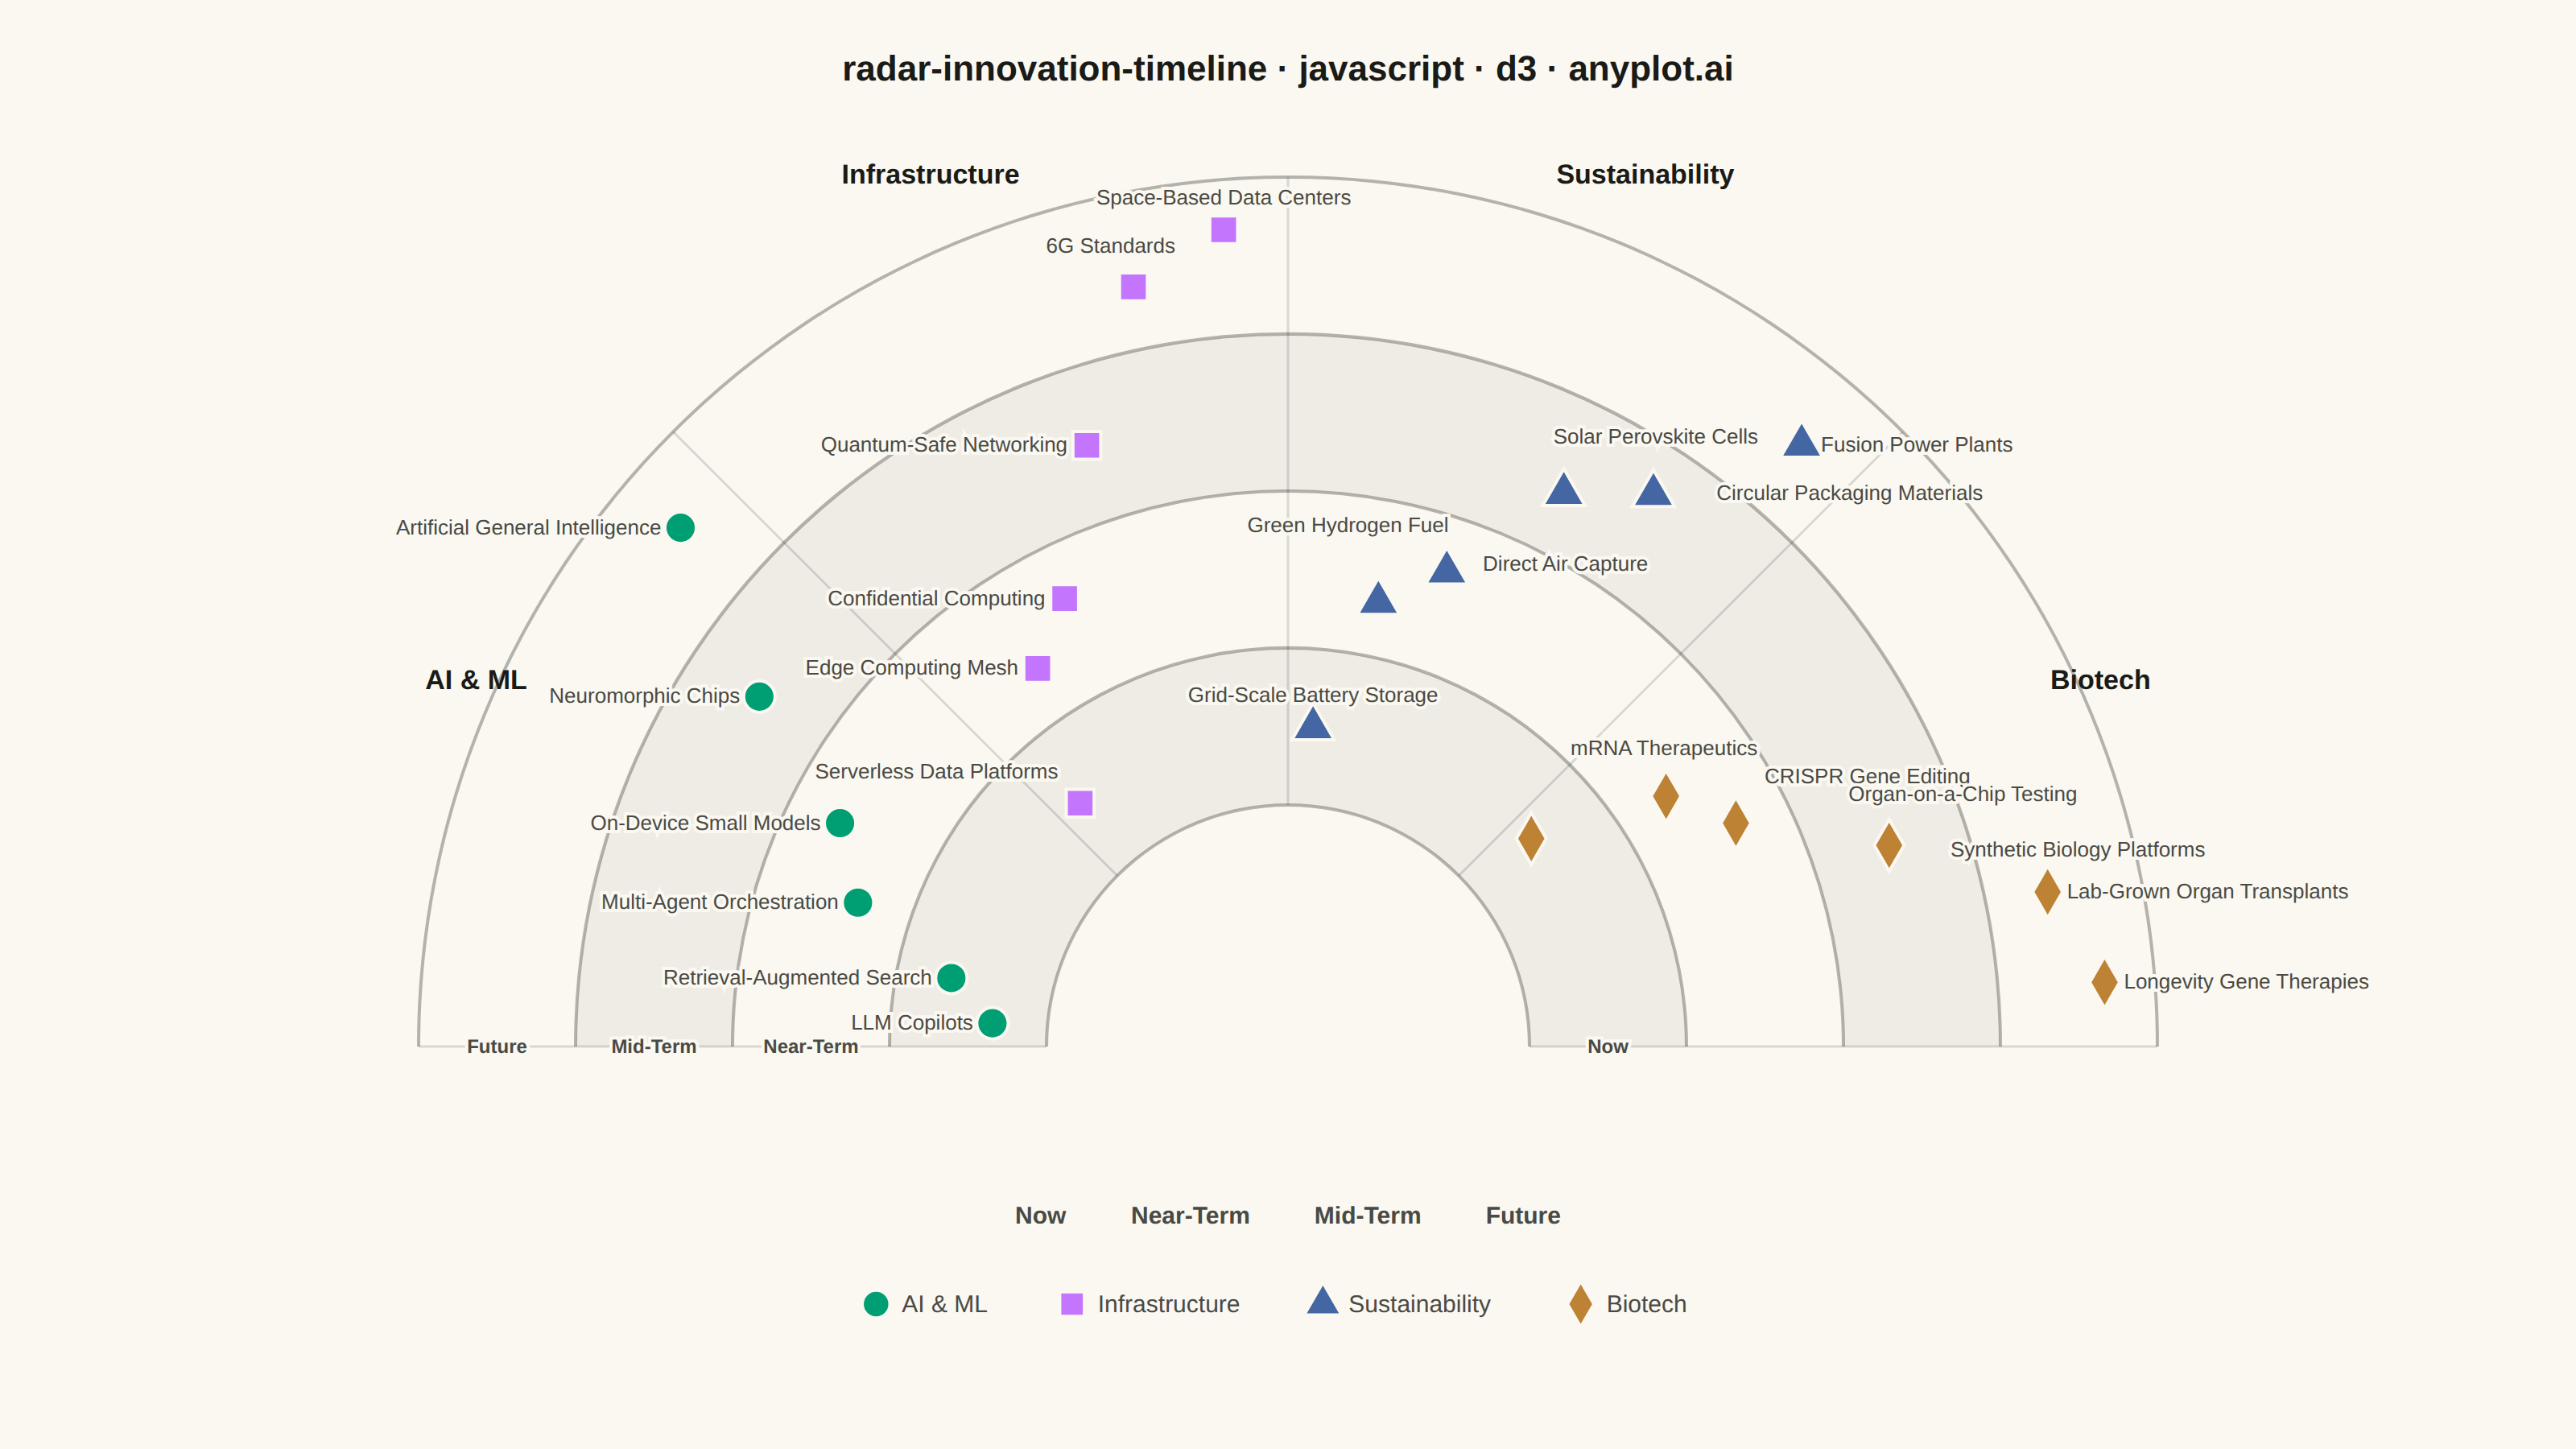
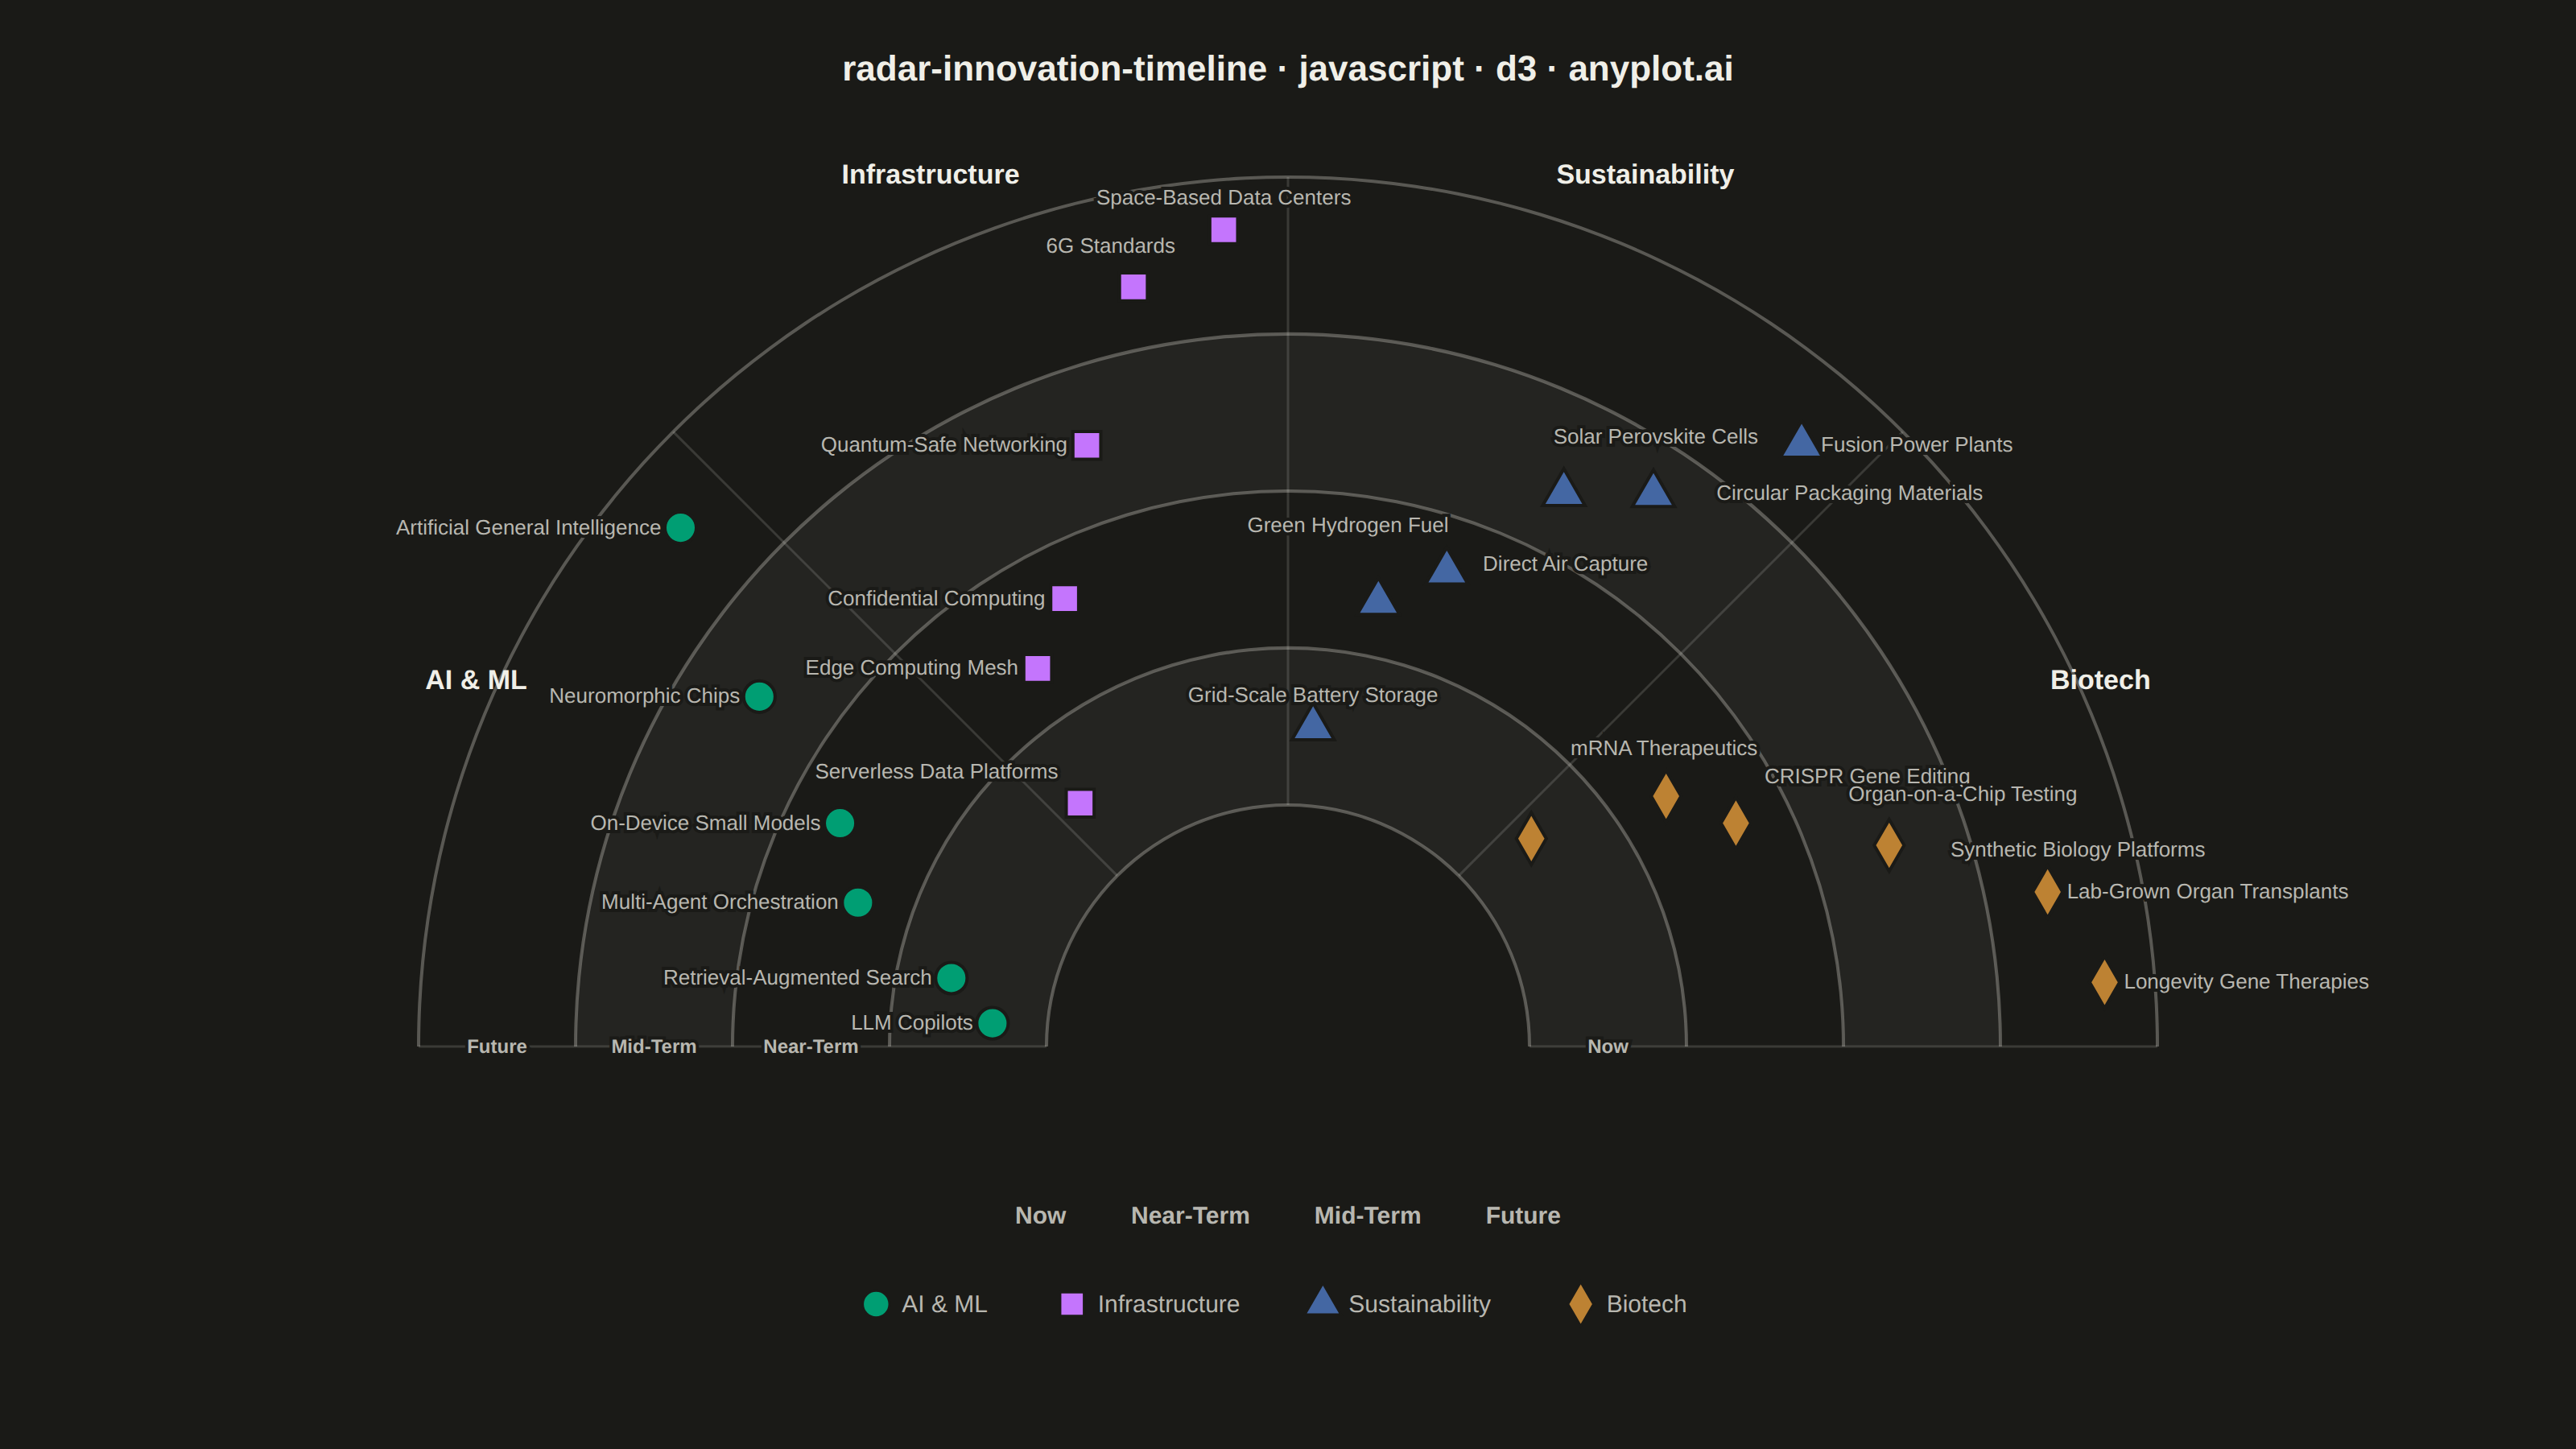
A radial chart that maps innovations, technologies, or trends onto concentric rings representing time horizons and angular sectors representing thematic categories. Inner rings represent near-term items (e.g., "Now", "Next 6 months") while outer rings represent longer-term or emerging trends (e.g., "2-5 years", "Future"). Each item is placed as a labeled point within its sector and ring, with distinct markers or colors encoding categories. Inspired by ThoughtWorks Technology Radar and similar strategic planning visualizations.
// anyplot.ai
// radar-innovation-timeline: Innovation Radar with Time-Horizon Rings
// Library: d3 7.9.0 | JavaScript 22.23.2
// Quality: 92/100 | Created: 2026-08-26

//# anyplot-orientation: landscape
const t = window.ANYPLOT_TOKENS;
const { width, height } = window.ANYPLOT_SIZE;

// --- Layout: upper half-circle (180°), flat diameter down, dome up --------
const cx = width / 2;
const rInner = 150;
const rOuter = 540;
const cy = 110 + rOuter;
const ringStep = (rOuter - rInner) / 4;
const ringBounds = d3.range(5).map((i) => rInner + i * ringStep);

// --- Data: time-horizon rings (inner -> outer) ------------------------------
const rings = [
  { name: "Now", inner: ringBounds[0], outer: ringBounds[1] },
  { name: "Near-Term", inner: ringBounds[1], outer: ringBounds[2] },
  { name: "Mid-Term", inner: ringBounds[2], outer: ringBounds[3] },
  { name: "Future", inner: ringBounds[3], outer: ringBounds[4] },
];

// --- Data: thematic sectors (left -> right across the dome) ----------------
const sectors = [
  { name: "AI & ML", start: -90, end: -45, symbol: d3.symbolCircle },
  { name: "Infrastructure", start: -45, end: 0, symbol: d3.symbolSquare },
  { name: "Sustainability", start: 0, end: 45, symbol: d3.symbolTriangle },
  { name: "Biotech", start: 45, end: 90, symbol: d3.symbolDiamond },
];
sectors.forEach((s) => (s.mid = (s.start + s.end) / 2));

// Sector -> palette color, via d3's ordinal scale (idiomatic categorical mapping).
const colorScale = d3.scaleOrdinal(
  sectors.map((s) => s.name),
  sectors.map((_, i) => t.palette[i]),
);

// --- Data: innovations placed by sector + ring, jittered within the cell ---
// Every item within a sector gets a distinct angular offset (see OFFSETS
// below) even across different rings — reusing an offset would put two items
// on the exact same ray from the center, and the label-collision pass below
// pushes labels outward *along their own ray*, so a repeated offset would
// drive an inner item's label straight into an outer item on the same ray.
const items = [
  { name: "LLM Copilots", sector: 0, ring: 0, frac: 0.35 },
  { name: "Retrieval-Augmented Search", sector: 0, ring: 0, frac: 0.65 },
  { name: "Multi-Agent Orchestration", sector: 0, ring: 1, frac: 0.35 },
  { name: "On-Device Small Models", sector: 0, ring: 1, frac: 0.65 },
  { name: "Neuromorphic Chips", sector: 0, ring: 2, frac: 0.5 },
  { name: "Artificial General Intelligence", sector: 0, ring: 3, frac: 0.55 },

  { name: "Serverless Data Platforms", sector: 1, ring: 0, frac: 0.5 },
  { name: "Edge Computing Mesh", sector: 1, ring: 1, frac: 0.35 },
  { name: "Confidential Computing", sector: 1, ring: 1, frac: 0.65 },
  { name: "Quantum-Safe Networking", sector: 1, ring: 2, frac: 0.5 },
  { name: "6G Standards", sector: 1, ring: 3, frac: 0.4 },
  { name: "Space-Based Data Centers", sector: 1, ring: 3, frac: 0.68 },

  { name: "Grid-Scale Battery Storage", sector: 2, ring: 0, frac: 0.5 },
  { name: "Green Hydrogen Fuel", sector: 2, ring: 1, frac: 0.35 },
  { name: "Direct Air Capture", sector: 2, ring: 1, frac: 0.65 },
  { name: "Solar Perovskite Cells", sector: 2, ring: 2, frac: 0.4 },
  { name: "Circular Packaging Materials", sector: 2, ring: 2, frac: 0.68 },
  { name: "Fusion Power Plants", sector: 2, ring: 3, frac: 0.5 },

  { name: "mRNA Therapeutics", sector: 3, ring: 0, frac: 0.5 },
  { name: "CRISPR Gene Editing", sector: 3, ring: 1, frac: 0.35 },
  { name: "Organ-on-a-Chip Testing", sector: 3, ring: 1, frac: 0.65 },
  { name: "Synthetic Biology Platforms", sector: 3, ring: 2, frac: 0.5 },
  { name: "Lab-Grown Organ Transplants", sector: 3, ring: 3, frac: 0.4 },
  { name: "Longevity Gene Therapies", sector: 3, ring: 3, frac: 0.68 },
];

const OFFSETS = [-18, -11, -4, 4, 11, 18];
sectors.forEach((_, s) => items.filter((d) => d.sector === s).forEach((d, k) => (d.offset = OFFSETS[k])));

// d3.arc's angle convention (0 = up, clockwise) matches this helper directly.
const toRad = (deg) => (deg * Math.PI) / 180;
const polar = (deg, r) => [cx + r * Math.sin(toRad(deg)), cy - r * Math.cos(toRad(deg))];

items.forEach((d) => {
  const ring = rings[d.ring];
  d.angle = sectors[d.sector].mid + d.offset;
  d.radius = d3.scaleLinear().domain([0, 1]).range([ring.inner, ring.outer])(d.frac);
  [d.x, d.y] = polar(d.angle, d.radius);
  // Nudges applied by the collision-avoidance pass below: labelPush moves the
  // label further from center along its ray; labelAngleAdj additionally
  // rotates it a few degrees — signed per-conflict (see `nudge` below) so it
  // moves away from whatever it's actually overlapping, not a fixed sector
  // direction (two items on the same side of a sector's mid-line must be
  // free to spread apart from *each other*, not both toward the same edge).
  d.labelPush = 0;
  d.labelAngleAdj = 0;
});

// A label's marker anchors its data point; the label text itself may drift
// further out along the same angle (never sideways into a neighbor's arc).
const labelSide = (angle) => (angle <= -18 ? -1 : angle >= 18 ? 1 : 0);
const labelPos = (d) => {
  const side = labelSide(d.angle);
  const [px, py] = polar(d.angle + d.labelAngleAdj, d.radius + d.labelPush);
  return {
    x: px + side * 12,
    y: py + (side !== 0 ? 4 : -16),
    anchor: side < 0 ? "end" : side > 0 ? "start" : "middle",
  };
};

// --- SVG mount ---------------------------------------------------------------
const svg = d3.select("#container").append("svg").attr("width", width).attr("height", height);
const chart = svg.append("g");

// --- Ring background bands (alternating, purely structural) -----------------
const bandArc = d3.arc().startAngle(-Math.PI / 2).endAngle(Math.PI / 2);
chart
  .selectAll("path.band")
  .data(rings)
  .join("path")
  .attr("class", "band")
  .attr("transform", `translate(${cx},${cy})`)
  .attr("d", (d) => bandArc.innerRadius(d.inner).outerRadius(d.outer)())
  .attr("fill", t.ink)
  .attr("fill-opacity", (d, i) => (i % 2 === 0 ? 0.05 : 0));

// --- Ring boundary lines ------------------------------------------------------
const boundaryArc = d3.arc().startAngle(-Math.PI / 2).endAngle(Math.PI / 2);
const boundaries = ringBounds;
chart
  .selectAll("path.boundary")
  .data(boundaries)
  .join("path")
  .attr("class", "boundary")
  .attr("transform", `translate(${cx},${cy})`)
  .attr("d", (r) => boundaryArc.innerRadius(r - 1).outerRadius(r + 1)())
  .attr("fill", t.inkSoft)
  .attr("fill-opacity", 0.4);

// --- Sector divider lines -----------------------------------------------------
chart
  .selectAll("line.divider")
  .data(sectors.flatMap((s) => [s.start, s.end]).filter((v, i, a) => a.indexOf(v) === i))
  .join("line")
  .attr("class", "divider")
  .attr("x1", (deg) => polar(deg, rInner)[0])
  .attr("y1", (deg) => polar(deg, rInner)[1])
  .attr("x2", (deg) => polar(deg, rOuter)[0])
  .attr("y2", (deg) => polar(deg, rOuter)[1])
  .attr("stroke", t.grid)
  .attr("stroke-width", 1.5);

// --- Ring-name labels directly on the rings, sitting on the flat diameter --
// Every ring's items leave the -90deg edge clear except "Now" (whose AI & ML
// item sits at -85.5deg); "Now" uses the +90deg edge instead, where the
// nearest item (Biotech, ring "Now") is 40deg+ away. The other three rings
// all keep 18deg+ of clearance at -90deg, so they share that side.
chart
  .selectAll("text.ring-label")
  .data(rings)
  .join("text")
  .attr("class", "ring-label")
  .attr("x", (d, i) => polar(i === 0 ? 90 : -90, (d.inner + d.outer) / 2)[0])
  .attr("y", (d, i) => polar(i === 0 ? 90 : -90, (d.inner + d.outer) / 2)[1])
  .attr("text-anchor", "middle")
  .attr("dy", "0.35em")
  .attr("fill", t.inkSoft)
  .style("font-size", "12px")
  .style("font-weight", "600")
  .style("paint-order", "stroke")
  .style("stroke", t.pageBg)
  .style("stroke-width", "4px")
  .text((d) => d.name);

// --- Sector header labels along the outer edge --------------------------------
chart
  .selectAll("text.sector-label")
  .data(sectors)
  .join("text")
  .attr("class", "sector-label")
  .attr("x", (d) => polar(d.mid, rOuter + 40)[0])
  .attr("y", (d) => polar(d.mid, rOuter + 40)[1])
  .attr("text-anchor", (d) => (d.mid <= -45 ? "start" : d.mid >= 45 ? "end" : "middle"))
  .attr("fill", t.ink)
  .style("font-size", "17px")
  .style("font-weight", "600")
  .text((d) => d.name);

// --- Item markers --------------------------------------------------------------
const symbolGen = d3.symbol().size(300);
chart
  .selectAll("path.marker")
  .data(items)
  .join("path")
  .attr("class", "marker")
  .attr("transform", (d) => `translate(${d.x},${d.y})`)
  .attr("d", (d) => symbolGen.type(sectors[d.sector].symbol)())
  .attr("fill", (d) => colorScale(sectors[d.sector].name))
  .attr("stroke", t.pageBg)
  .attr("stroke-width", 2);

// --- Item labels -----------------------------------------------------------
const itemLabels = chart
  .selectAll("text.item-label")
  .data(items)
  .join("text")
  .attr("class", "item-label")
  .attr("fill", t.inkSoft)
  .style("font-size", "13px")
  .style("paint-order", "stroke")
  .style("stroke", t.pageBg)
  .style("stroke-width", "4px")
  .text((d) => d.name);

const applyLabelPos = () =>
  itemLabels.each(function (d) {
    const p = labelPos(d);
    d3.select(this).attr("x", p.x).attr("y", p.y).attr("text-anchor", p.anchor);
  });
applyLabelPos();

// Collision avoidance: real getBBox() measurement (this runs in an actual
// browser, not jsdom) beats guessing text widths from character counts. Any
// label overlapping another label OR a neighboring item's marker gets nudged
// outward and a few degrees sideways (capped below, never far enough to
// cross a sector divider). Markers never move, so their boxes are fixed.
const boxesOverlap = (a, b, pad = 3) =>
  a.x < b.x + b.width + pad &&
  b.x < a.x + a.width + pad &&
  a.y < b.y + b.height + pad &&
  b.y < a.y + a.height + pad;
// Build marker boxes from the known data coordinates rather than getBBox():
// each <path> carries its position via a `transform="translate(...)"`, and
// getBBox() reports the LOCAL (pre-transform) box — i.e. centered on the
// origin for every marker alike — so it can't be used for hit-testing here.
const markerHalf = 15; // symbol size 300 -> ~20px across, plus stroke/halo
const markerBoxes = items.map((d) => ({
  x: d.x - markerHalf,
  y: d.y - markerHalf,
  width: markerHalf * 2,
  height: markerHalf * 2,
}));
// Capped well under the ring spacing (~95px) so a label can clear a
// same-ring neighbor but never leapfrogs into the next ring's territory.
// The angular nudge is capped small (8°) so it can separate close same-ring
// neighbors without drifting far enough to cross a sector divider.
const maxPush = 60;
const maxSpread = 8;
const clamp = (v, lo, hi) => Math.max(lo, Math.min(hi, v));
// `awayFromAngle` is the conflicting element's angle: d rotates away from it
// specifically, so two items sharing a side of the sector's mid-line spread
// apart from *each other* instead of both drifting toward the same edge.
const nudge = (d, awayFromAngle) => {
  const canPush = d.labelPush < maxPush;
  const canSpread = Math.abs(d.labelAngleAdj) < maxSpread;
  if (!canPush && !canSpread) return false;
  if (canPush) d.labelPush = Math.min(d.labelPush + 8, maxPush);
  if (canSpread) {
    const dir = Math.sign(d.angle - awayFromAngle) || (d.offset < 0 ? -1 : 1);
    d.labelAngleAdj = clamp(d.labelAngleAdj + dir * 1.5, -maxSpread, maxSpread);
  }
  return true;
};
for (let iter = 0; iter < 40; iter++) {
  const boxes = itemLabels.nodes().map((n) => n.getBBox());
  let moved = false;
  for (let i = 0; i < boxes.length; i++) {
    for (let j = i + 1; j < boxes.length; j++) {
      if (boxesOverlap(boxes[i], boxes[j])) {
        moved = nudge(items[j], items[i].angle) || moved;
      }
    }
    for (let k = 0; k < markerBoxes.length; k++) {
      if (k !== i && boxesOverlap(boxes[i], markerBoxes[k])) {
        moved = nudge(items[i], items[k].angle) || moved;
      }
    }
  }
  if (!moved) break;
  applyLabelPos();
}

// --- Title -----------------------------------------------------------------
svg
  .append("text")
  .attr("x", width / 2)
  .attr("y", 50)
  .attr("text-anchor", "middle")
  .attr("fill", t.ink)
  .style("font-size", "22px")
  .style("font-weight", "600")
  .text("radar-innovation-timeline · javascript · d3 · anyplot.ai");

// --- Legend: sector color + marker shape key, centered under the dome ------
const legend = svg.append("g");
const legendItems = legend
  .selectAll("g.legend-item")
  .data(sectors)
  .join("g")
  .attr("class", "legend-item");

legendItems
  .append("path")
  .attr("d", (d) => d3.symbol().type(d.symbol).size(220)())
  .attr("fill", (d) => colorScale(d.name))
  .attr("stroke", t.pageBg)
  .attr("stroke-width", 1.5);

legendItems
  .append("text")
  .attr("x", 16)
  .attr("y", 5)
  .attr("fill", t.inkSoft)
  .style("font-size", "15px")
  .text((d) => d.name);

// Measure each item's rendered width (real browser layout) and center the row —
// works for any row of <g> items, reused below for the time-horizon key.
const centerRow = (rowItems, y, gap) => {
  const widths = rowItems.nodes().map((node) => node.getBBox().width);
  const totalWidth = widths.reduce((sum, w) => sum + w, 0) + gap * (widths.length - 1);
  let cursor = cx - totalWidth / 2;
  rowItems.each(function (d, i) {
    d3.select(this).attr("transform", `translate(${cursor},${y})`);
    cursor += widths[i] + gap;
  });
};
centerRow(legendItems, cy + 160, 44);

// --- Time-horizon key: ring names, in near-to-far order --------------------
const ringKeyItems = svg
  .append("g")
  .selectAll("g.ring-key-item")
  .data(rings)
  .join("g")
  .attr("class", "ring-key-item");

ringKeyItems
  .append("text")
  .attr("fill", t.inkSoft)
  .style("font-size", "15px")
  .style("font-weight", "600")
  .text((d) => d.name);

centerRow(ringKeyItems, cy + 110, 40);
Runnable source as JSON, for any HTTP client: https://api.anyplot.ai/specs/radar-innovation-timeline/d3/code. Any spec id and library id listed in llms-full.txt fit the same URL shape; every URL below is complete and callable.
{
  "spec_id": "radar-innovation-timeline",
  "language": "javascript",
  "library": "d3",
  "page": "https://anyplot.ai/radar-innovation-timeline/javascript/d3",
  "hub": "https://anyplot.ai/radar-innovation-timeline",
  "code_json": "https://api.anyplot.ai/specs/radar-innovation-timeline/d3/code",
  "spec_json": "https://api.anyplot.ai/specs/radar-innovation-timeline",
  "render_light_png": "https://storage.googleapis.com/anyplot-images/plots/radar-innovation-timeline/javascript/d3/plot-light.png",
  "render_dark_png": "https://storage.googleapis.com/anyplot-images/plots/radar-innovation-timeline/javascript/d3/plot-dark.png",
  "interactive_light_html": "https://storage.googleapis.com/anyplot-images/plots/radar-innovation-timeline/javascript/d3/plot-light.html",
  "interactive_dark_html": "https://storage.googleapis.com/anyplot-images/plots/radar-innovation-timeline/javascript/d3/plot-dark.html",
  "quality_score": 92.0,
  "license": "MIT",
  "guide": "https://anyplot.ai/llms.txt"
}
Part of Innovation Radar with Time-Horizon Rings on anyplot.ai.