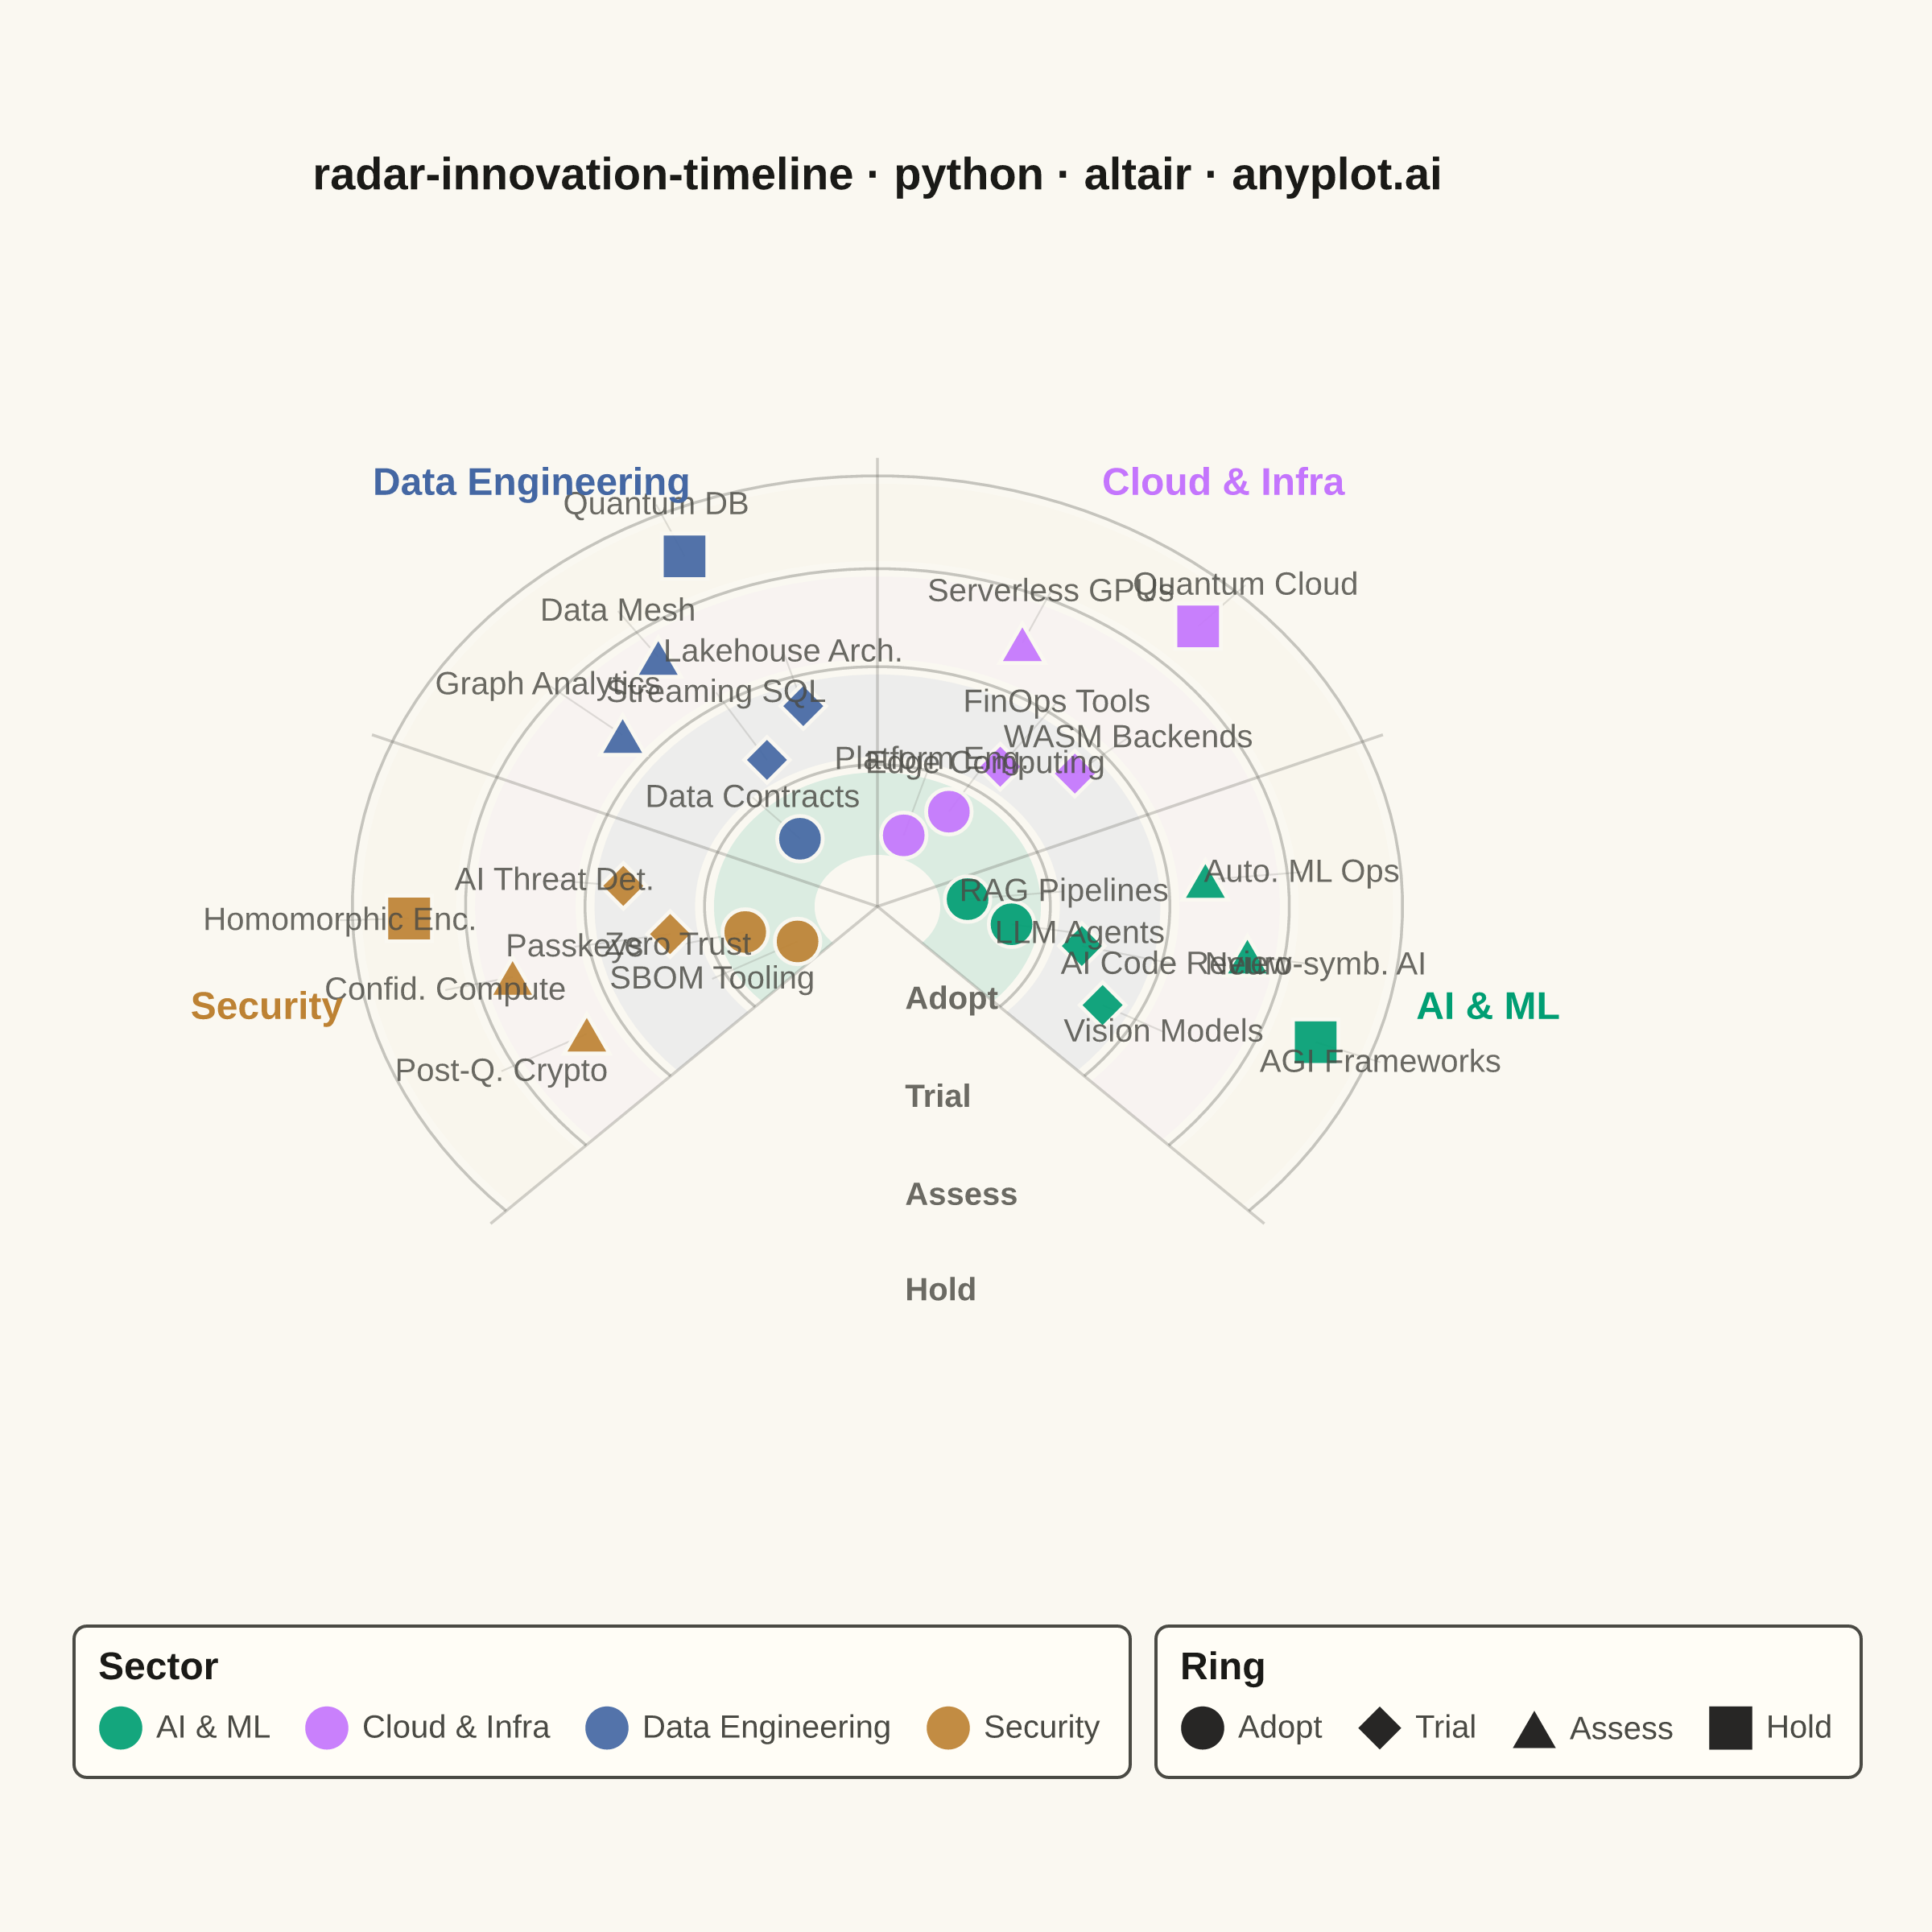
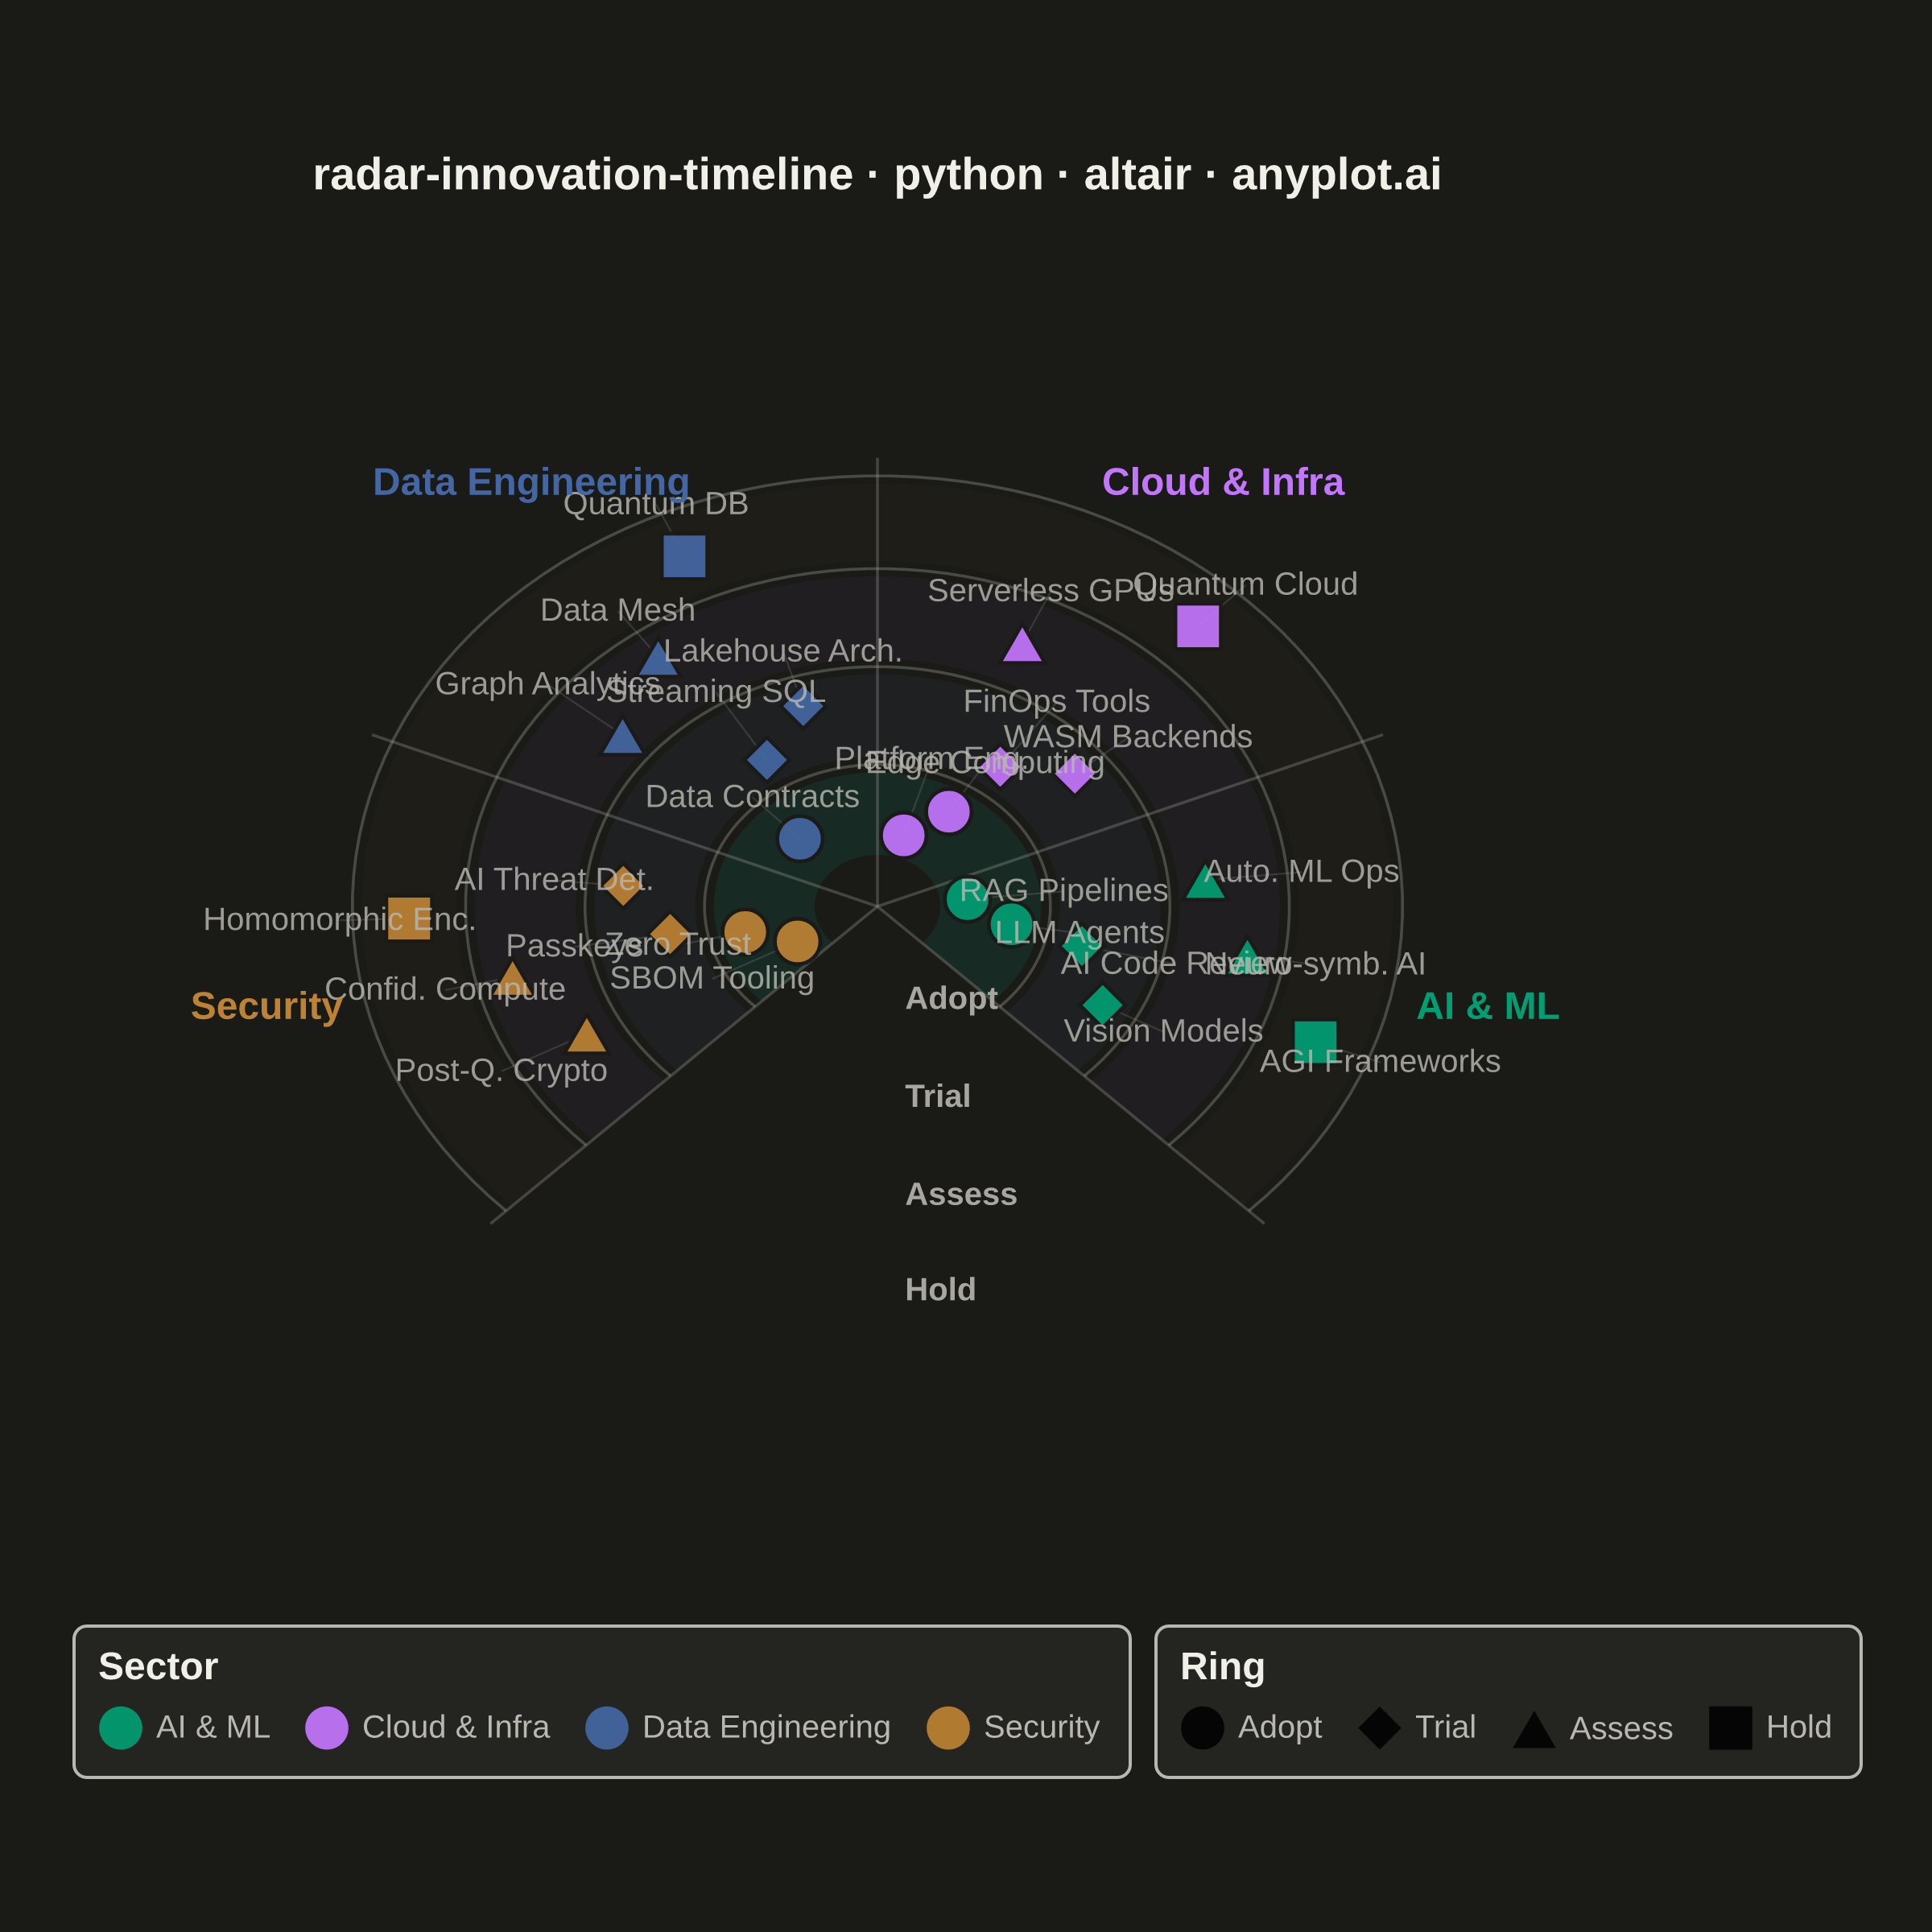
A radial chart that maps innovations, technologies, or trends onto concentric rings representing time horizons and angular sectors representing thematic categories. Inner rings represent near-term items (e.g., "Now", "Next 6 months") while outer rings represent longer-term or emerging trends (e.g., "2-5 years", "Future"). Each item is placed as a labeled point within its sector and ring, with distinct markers or colors encoding categories. Inspired by ThoughtWorks Technology Radar and similar strategic planning visualizations.
""" anyplot.ai
radar-innovation-timeline: Innovation Radar with Time-Horizon Rings
Library: altair 6.1.0 | Python 3.13.13
Quality: 83/100 | Updated: 2026-05-29
"""

import os
import sys


# Prevent this file from shadowing the altair package when run from its own directory
_self_dir = os.path.dirname(os.path.abspath(__file__))
sys.path = [p for p in sys.path if os.path.abspath(p) != _self_dir]

from collections import defaultdict

import altair as alt
import numpy as np
import pandas as pd
from PIL import Image


THEME = os.getenv("ANYPLOT_THEME", "light")
PAGE_BG = "#FAF8F1" if THEME == "light" else "#1A1A17"
ELEVATED_BG = "#FFFDF6" if THEME == "light" else "#242420"
INK = "#1A1A17" if THEME == "light" else "#F0EFE8"
INK_SOFT = "#4A4A44" if THEME == "light" else "#B8B7B0"
INK_MUTED = "#6B6A63" if THEME == "light" else "#A8A79F"

# Imprint palette — canonical order
IMPRINT_PALETTE = ["#009E73", "#C475FD", "#4467A3", "#BD8233", "#AE3030", "#2ABCCD", "#954477", "#99B314"]

np.random.seed(42)

# --- Configuration ---
rings = ["Adopt", "Trial", "Assess", "Hold"]
sectors = ["AI & ML", "Cloud & Infra", "Data Engineering", "Security"]
n_sectors = len(sectors)

# 270-degree arc layout
start_angle = -np.pi / 4
total_arc = 1.5 * np.pi
sector_arc = total_arc / n_sectors

sector_bounds = {s: (start_angle + i * sector_arc, start_angle + (i + 1) * sector_arc) for i, s in enumerate(sectors)}

ring_inner = {"Adopt": 0.5, "Trial": 1.45, "Assess": 2.4, "Hold": 3.35}
ring_outer = {"Adopt": 1.3, "Trial": 2.25, "Assess": 3.2, "Hold": 4.1}
ring_boundary_radii = [1.375, 2.325, 3.275, 4.175]

# Imprint palette for sectors (positions 1–4)
sector_colors = {
    "AI & ML": "#009E73",  # Imprint #1 — green
    "Cloud & Infra": "#C475FD",  # Imprint #2 — lavender
    "Data Engineering": "#4467A3",  # Imprint #3 — blue
    "Security": "#BD8233",  # Imprint #4 — ochre
}

# Ring fills using corresponding Imprint colors at low opacity
ring_fill_colors = {"Adopt": "#009E73", "Trial": "#4467A3", "Assess": "#C475FD", "Hold": "#BD8233"}
ring_opacities = {"Adopt": 0.12, "Trial": 0.07, "Assess": 0.04, "Hold": 0.02}
ring_shapes = {"Adopt": "circle", "Trial": "diamond", "Assess": "triangle-up", "Hold": "square"}

# --- Data: 26 technology items ---
items = [
    {"name": "LLM Agents", "ring": "Adopt", "sector": "AI & ML"},
    {"name": "RAG Pipelines", "ring": "Adopt", "sector": "AI & ML"},
    {"name": "Vision Models", "ring": "Trial", "sector": "AI & ML"},
    {"name": "AI Code Review", "ring": "Trial", "sector": "AI & ML"},
    {"name": "Neuro-symb. AI", "ring": "Assess", "sector": "AI & ML"},
    {"name": "Auto. ML Ops", "ring": "Assess", "sector": "AI & ML"},
    {"name": "AGI Frameworks", "ring": "Hold", "sector": "AI & ML"},
    {"name": "Edge Computing", "ring": "Adopt", "sector": "Cloud & Infra"},
    {"name": "Platform Eng.", "ring": "Adopt", "sector": "Cloud & Infra"},
    {"name": "WASM Backends", "ring": "Trial", "sector": "Cloud & Infra"},
    {"name": "FinOps Tools", "ring": "Trial", "sector": "Cloud & Infra"},
    {"name": "Serverless GPUs", "ring": "Assess", "sector": "Cloud & Infra"},
    {"name": "Quantum Cloud", "ring": "Hold", "sector": "Cloud & Infra"},
    {"name": "Data Contracts", "ring": "Adopt", "sector": "Data Engineering"},
    {"name": "Lakehouse Arch.", "ring": "Trial", "sector": "Data Engineering"},
    {"name": "Streaming SQL", "ring": "Trial", "sector": "Data Engineering"},
    {"name": "Data Mesh", "ring": "Assess", "sector": "Data Engineering"},
    {"name": "Graph Analytics", "ring": "Assess", "sector": "Data Engineering"},
    {"name": "Quantum DB", "ring": "Hold", "sector": "Data Engineering"},
    {"name": "Zero Trust", "ring": "Adopt", "sector": "Security"},
    {"name": "SBOM Tooling", "ring": "Adopt", "sector": "Security"},
    {"name": "AI Threat Det.", "ring": "Trial", "sector": "Security"},
    {"name": "Passkeys", "ring": "Trial", "sector": "Security"},
    {"name": "Confid. Compute", "ring": "Assess", "sector": "Security"},
    {"name": "Post-Q. Crypto", "ring": "Assess", "sector": "Security"},
    {"name": "Homomorphic Enc.", "ring": "Hold", "sector": "Security"},
]

# --- Position items: increased padding + stronger ring jitter to reduce overlap ---
groups = defaultdict(list)
for item in items:
    groups[(item["sector"], item["ring"])].append(item)

records = []
for (sector, ring), group_items in groups.items():
    a_min, a_max = sector_bounds[sector]
    padding = 0.28 * sector_arc  # wider padding keeps items away from sector boundaries
    n = len(group_items)
    r_in, r_out = ring_inner[ring], ring_outer[ring]
    r_mid = (r_in + r_out) / 2
    ring_idx = rings.index(ring)
    # Alternating jitter shifts adjacent rings apart angularly
    ring_jitter = 0.14 * sector_arc * ((-1) ** ring_idx)
    for idx, it in enumerate(group_items):
        angle = a_min + padding + (idx + 0.5) / n * (a_max - a_min - 2 * padding) + ring_jitter
        r_off = 0.18 * ((-1) ** idx) if n > 1 else 0
        radius = r_mid + r_off
        x = radius * np.cos(angle)
        y = radius * np.sin(angle)
        # Alternate label radii so paired items don't stack at the same distance
        label_r = radius + 0.55 + (idx % 2) * 0.22
        label_x = label_r * np.cos(angle)
        label_y = label_r * np.sin(angle)
        records.append(
            {"name": it["name"], "ring": ring, "sector": sector, "x": x, "y": y, "label_x": label_x, "label_y": label_y}
        )

df = pd.DataFrame(records)

# --- Geometry: ring fills, arcs, spokes ---
fill_pts = 80
ring_fill_rows = []
for rn in rings:
    r_in, r_out = ring_inner[rn], ring_outer[rn]
    thetas = np.linspace(start_angle, start_angle + total_arc, fill_pts)
    for i, t in enumerate(thetas):
        ring_fill_rows.append({"x": r_in * np.cos(t), "y": r_in * np.sin(t), "ring": rn, "order": i})
    for i, t in enumerate(thetas[::-1]):
        ring_fill_rows.append({"x": r_out * np.cos(t), "y": r_out * np.sin(t), "ring": rn, "order": fill_pts + i})
    ring_fill_rows.append(
        {"x": r_in * np.cos(thetas[0]), "y": r_in * np.sin(thetas[0]), "ring": rn, "order": 2 * fill_pts}
    )
df_fills = pd.DataFrame(ring_fill_rows)

arc_rows = []
for rb in ring_boundary_radii:
    for i, t in enumerate(np.linspace(start_angle, start_angle + total_arc, 100)):
        arc_rows.append({"x": rb * np.cos(t), "y": rb * np.sin(t), "rb": rb, "order": i})
df_arcs = pd.DataFrame(arc_rows)

spoke_rows = []
for i in range(n_sectors + 1):
    a = start_angle + i * sector_arc
    spoke_rows.append({"x": 0, "y": 0, "sid": i, "order": 0})
    spoke_rows.append({"x": 4.35 * np.cos(a), "y": 4.35 * np.sin(a), "sid": i, "order": 1})
df_spokes = pd.DataFrame(spoke_rows)

# Sector headers at the outer edge
sec_r = 4.95
df_sec = pd.DataFrame(
    [
        {
            "x": sec_r * np.cos(start_angle + (i + 0.5) * sector_arc),
            "y": sec_r * np.sin(start_angle + (i + 0.5) * sector_arc),
            "sector": s,
        }
        for i, s in enumerate(sectors)
    ]
)

# Ring labels in the gap area at the bottom of the arc
gap_angle = 3 * np.pi / 2
df_rlabels = pd.DataFrame(
    [
        {
            "x": (ring_inner[rn] + ring_outer[rn]) / 2 * np.cos(gap_angle) + 0.22,
            "y": (ring_inner[rn] + ring_outer[rn]) / 2 * np.sin(gap_angle),
            "ring": rn,
        }
        for rn in rings
    ]
)

# --- Altair chart assembly ---
dom = [-6.4, 6.4]
x_enc = alt.X("x:Q", scale=alt.Scale(domain=dom), axis=None)
y_enc = alt.Y("y:Q", scale=alt.Scale(domain=dom), axis=None)

color_scale = alt.Scale(domain=list(sector_colors), range=list(sector_colors.values()))
shape_scale = alt.Scale(domain=rings, range=[ring_shapes[r] for r in rings])

hover = alt.selection_point(on="pointerover", fields=["name"], nearest=True, empty=False)

# Ring fill bands
fill_layers = [
    alt.Chart(df_fills[df_fills["ring"] == rn])
    .mark_line(strokeWidth=0, filled=True, fill=ring_fill_colors[rn], fillOpacity=ring_opacities[rn])
    .encode(x=x_enc, y=y_enc, order="order:Q")
    for rn in rings
]

# Ring boundary arcs
arcs = (
    alt.Chart(df_arcs)
    .mark_line(strokeWidth=0.9, stroke=INK_SOFT, opacity=0.30)
    .encode(x=x_enc, y=y_enc, detail="rb:N", order="order:Q")
)

# Sector spokes
spokes = (
    alt.Chart(df_spokes)
    .mark_line(strokeWidth=0.9, stroke=INK_MUTED, opacity=0.30)
    .encode(x=x_enc, y=y_enc, detail="sid:N", order="order:Q")
)

# Leader lines from markers to labels (single rule layer — avoids 3-layer label split)
leaders = (
    alt.Chart(df)
    .mark_rule(strokeWidth=0.55, opacity=0.20)
    .encode(
        x=alt.X("x:Q", scale=alt.Scale(domain=dom), axis=None),
        y=alt.Y("y:Q", scale=alt.Scale(domain=dom), axis=None),
        x2="label_x:Q",
        y2="label_y:Q",
        color=alt.value(INK_MUTED),
    )
)

# Data points with hover-driven size highlight and explicit dual legend
points = (
    alt.Chart(df)
    .mark_point(filled=True, strokeWidth=1.2, stroke=PAGE_BG, opacity=0.92)
    .encode(
        x=x_enc,
        y=y_enc,
        color=alt.Color("sector:N", scale=color_scale, legend=alt.Legend(title="Sector")),
        shape=alt.Shape("ring:N", scale=shape_scale, legend=alt.Legend(title="Ring")),
        size=alt.condition(hover, alt.value(380), alt.value(200)),
        tooltip=["name:N", "sector:N", "ring:N"],
    )
    .add_params(hover)
)

# Single unified label layer (center alignment — eliminates 3-layer split)
labels = (
    alt.Chart(df)
    .mark_text(fontSize=10, fontWeight="normal", align="center", baseline="middle")
    .encode(
        x=alt.X("label_x:Q", scale=alt.Scale(domain=dom), axis=None),
        y=alt.Y("label_y:Q", scale=alt.Scale(domain=dom), axis=None),
        text="name:N",
        color=alt.value(INK_SOFT),
        opacity=alt.condition(hover, alt.value(1.0), alt.value(0.82)),
    )
)

# Sector headers: one layer per sector with hardcoded color (avoids legend channel conflict)
sec_header_layers = [
    alt.Chart(df_sec[df_sec["sector"] == s])
    .mark_text(fontSize=12, fontWeight="bold", color=sector_colors[s])
    .encode(x=x_enc, y=y_enc, text="sector:N")
    for s in sectors
]

# Ring labels in the gap area
rlabels = (
    alt.Chart(df_rlabels)
    .mark_text(fontSize=10, fontWeight="bold", align="left", baseline="middle")
    .encode(x=x_enc, y=y_enc, text="ring:N", color=alt.value(INK_MUTED))
)

chart = (
    alt.layer(*fill_layers, arcs, spokes, leaders, points, labels, *sec_header_layers, rlabels)
    .properties(
        width=500,
        height=410,
        background=PAGE_BG,
        title=alt.Title(
            "radar-innovation-timeline · python · altair · anyplot.ai",
            fontSize=14,
            anchor="middle",
            offset=14,
            color=INK,
        ),
    )
    .configure_view(strokeWidth=0, fill=PAGE_BG)
    .configure_legend(
        padding=8,
        cornerRadius=4,
        fillColor=ELEVATED_BG,
        strokeColor=INK_SOFT,
        labelColor=INK_SOFT,
        titleColor=INK,
        labelFontSize=10,
        titleFontSize=12,
        orient="bottom",
        direction="horizontal",
        symbolSize=180,
        symbolStrokeWidth=0,
    )
)

chart.save(f"plot-{THEME}.png", scale_factor=4.0)
chart.save(f"plot-{THEME}.html")

# Pad to exact 2400×2400 target (square — radar chart)
TW, TH = 2400, 2400
_img = Image.open(f"plot-{THEME}.png").convert("RGB")
_w, _h = _img.size
if _w > TW or _h > TH:
    raise SystemExit(
        f"altair vl-convert produced {_w}×{_h}, exceeds target {TW}×{TH}. "
        f"Shrink chart .properties(width=, height=) values and re-render."
    )
if _w < TW or _h < TH:
    _canvas = Image.new("RGB", (TW, TH), PAGE_BG)
    _canvas.paste(_img, ((TW - _w) // 2, (TH - _h) // 2))
    _canvas.save(f"plot-{THEME}.png")
Runnable source as JSON, for any HTTP client: https://api.anyplot.ai/specs/radar-innovation-timeline/altair/code. Any spec id and library id listed in llms-full.txt fit the same URL shape; every URL below is complete and callable.
{
  "spec_id": "radar-innovation-timeline",
  "language": "python",
  "library": "altair",
  "page": "https://anyplot.ai/radar-innovation-timeline/python/altair",
  "hub": "https://anyplot.ai/radar-innovation-timeline",
  "code_json": "https://api.anyplot.ai/specs/radar-innovation-timeline/altair/code",
  "spec_json": "https://api.anyplot.ai/specs/radar-innovation-timeline",
  "render_light_png": "https://storage.googleapis.com/anyplot-images/plots/radar-innovation-timeline/python/altair/plot-light.png",
  "render_dark_png": "https://storage.googleapis.com/anyplot-images/plots/radar-innovation-timeline/python/altair/plot-dark.png",
  "interactive_light_html": "https://storage.googleapis.com/anyplot-images/plots/radar-innovation-timeline/python/altair/plot-light.html",
  "interactive_dark_html": "https://storage.googleapis.com/anyplot-images/plots/radar-innovation-timeline/python/altair/plot-dark.html",
  "quality_score": 83.0,
  "license": "MIT",
  "guide": "https://anyplot.ai/llms.txt"
}
Part of Innovation Radar with Time-Horizon Rings on anyplot.ai.