The same plot in 14 other libraries — JavaScript: Chart.js, D3.js, Apache ECharts, MUI X Charts; Python: Altair, Bokeh, lets-plot, Matplotlib, Plotly, plotnine, Pygal, Seaborn; R: ggplot2; Julia: Makie.jl. Compare all 15 side by side: Innovation Radar with Time-Horizon Rings in Python, R, Julia and JavaScript.
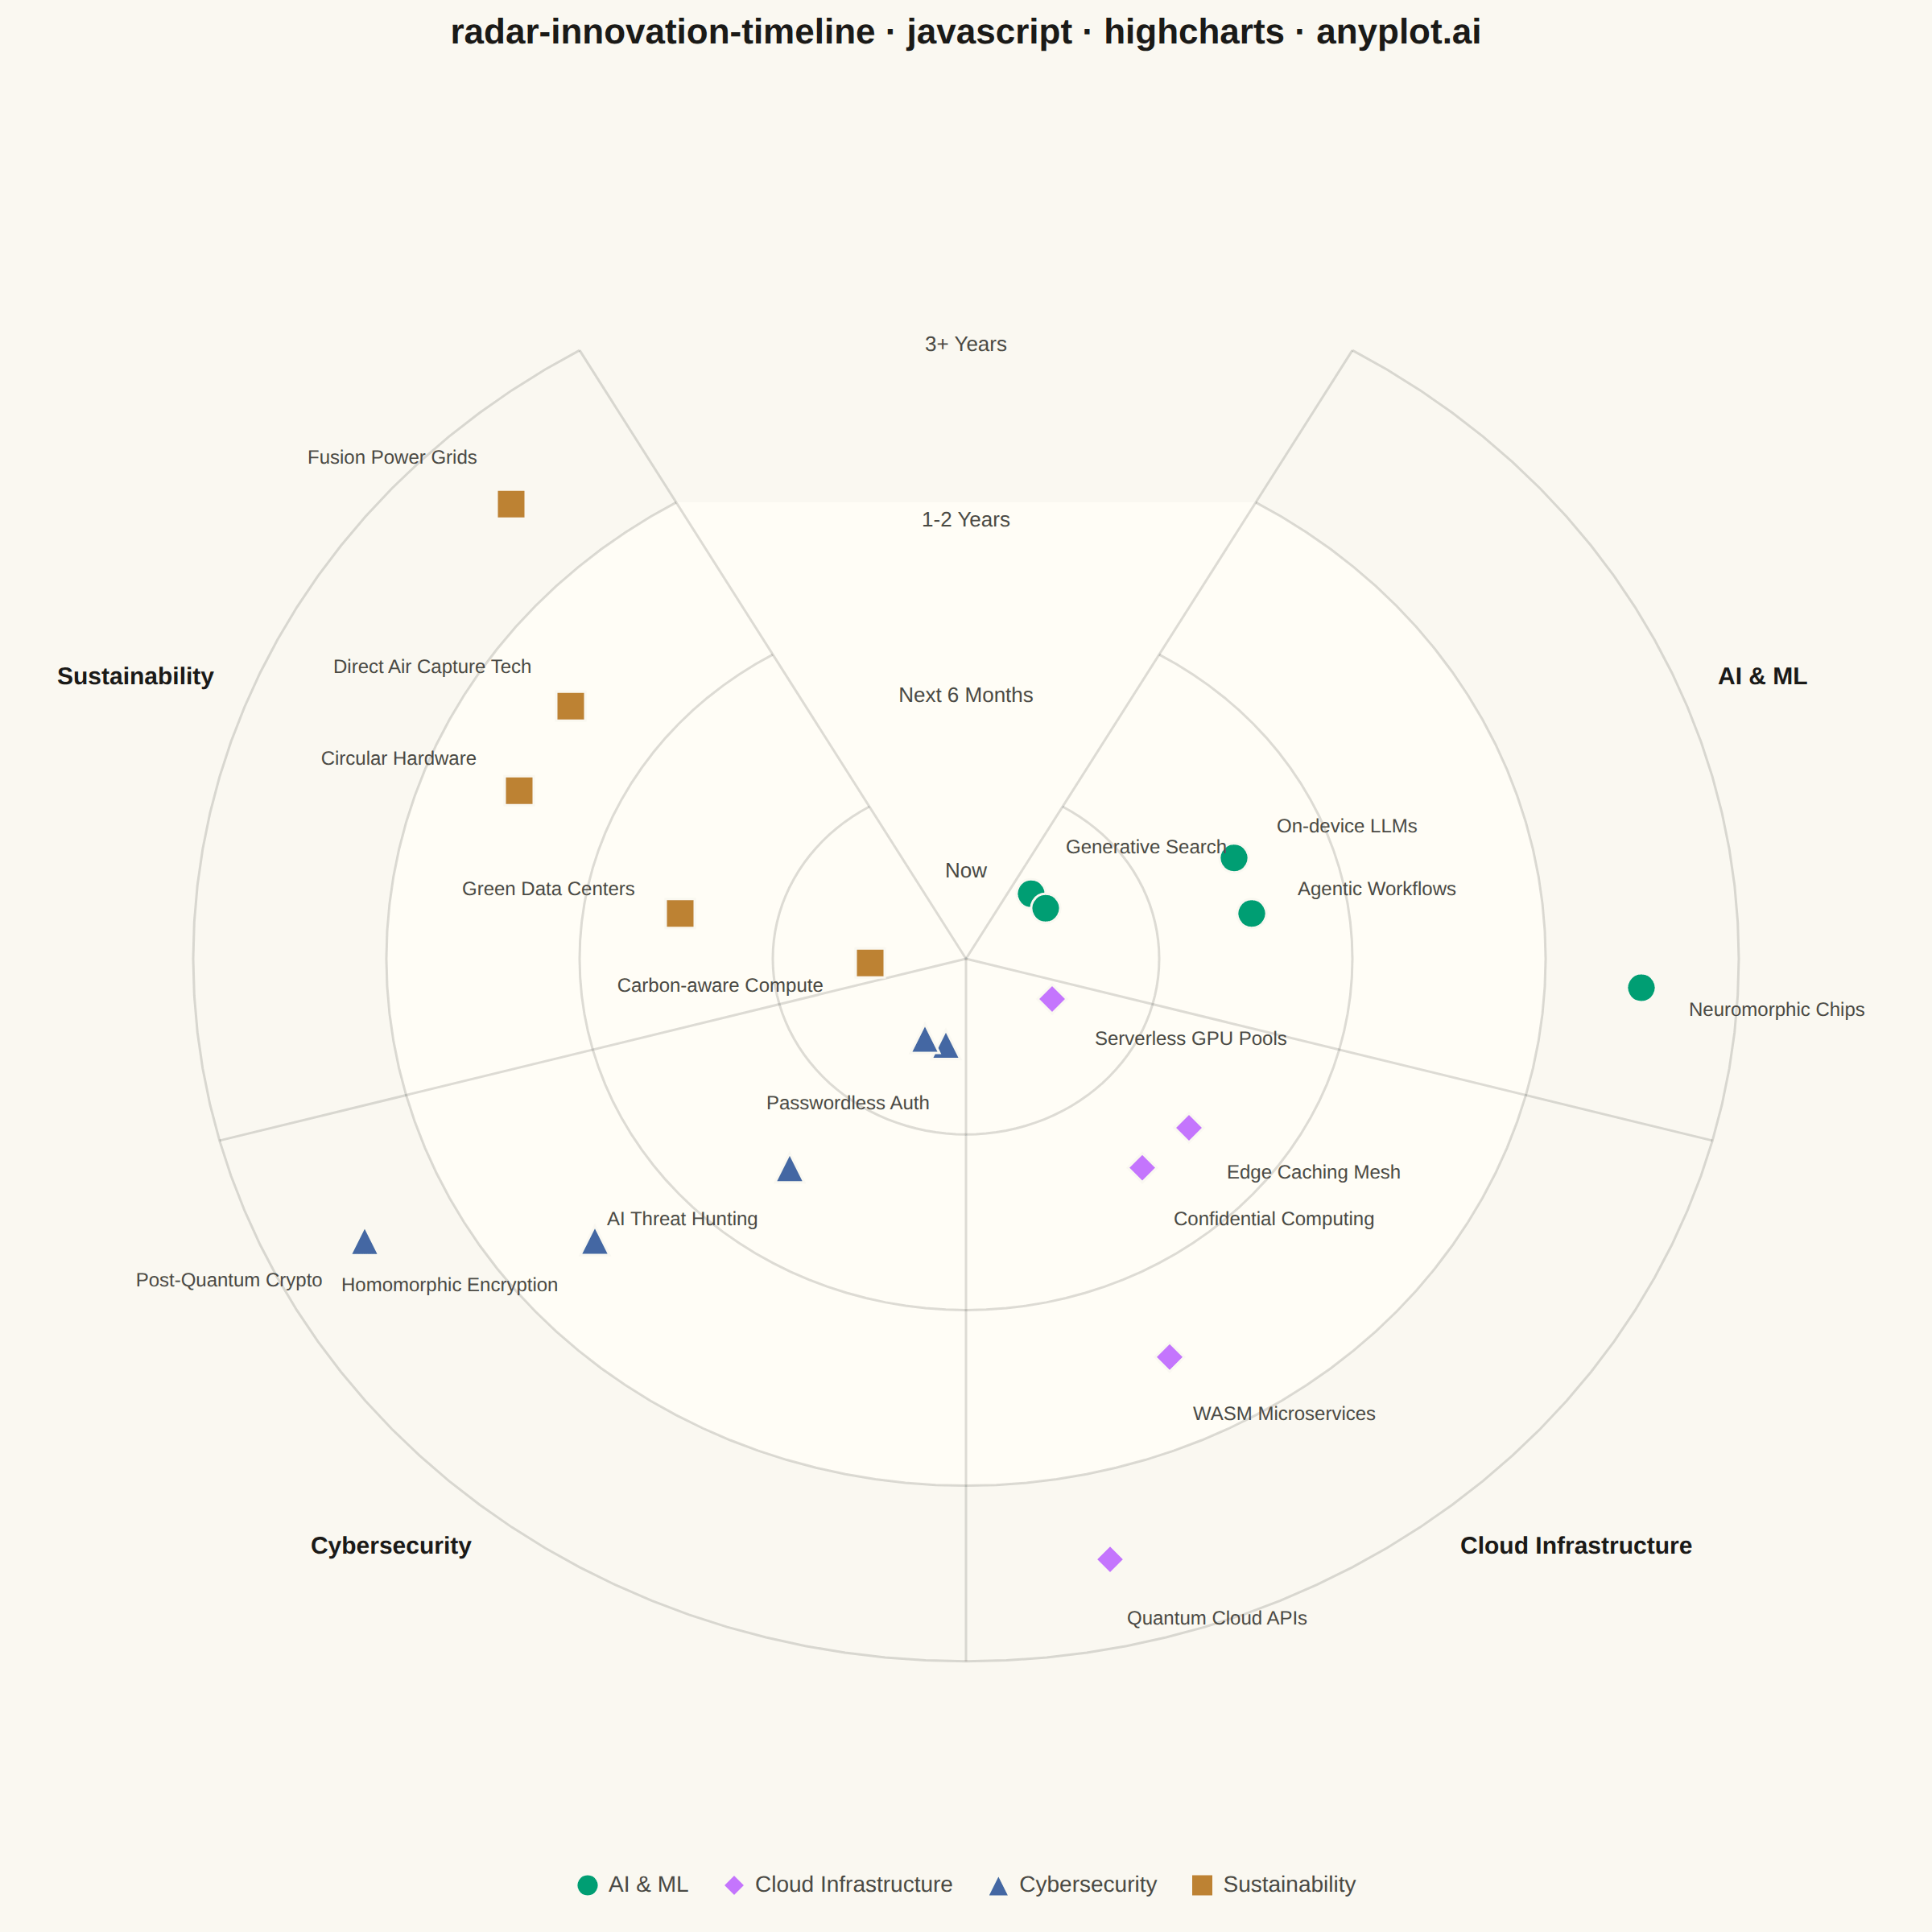
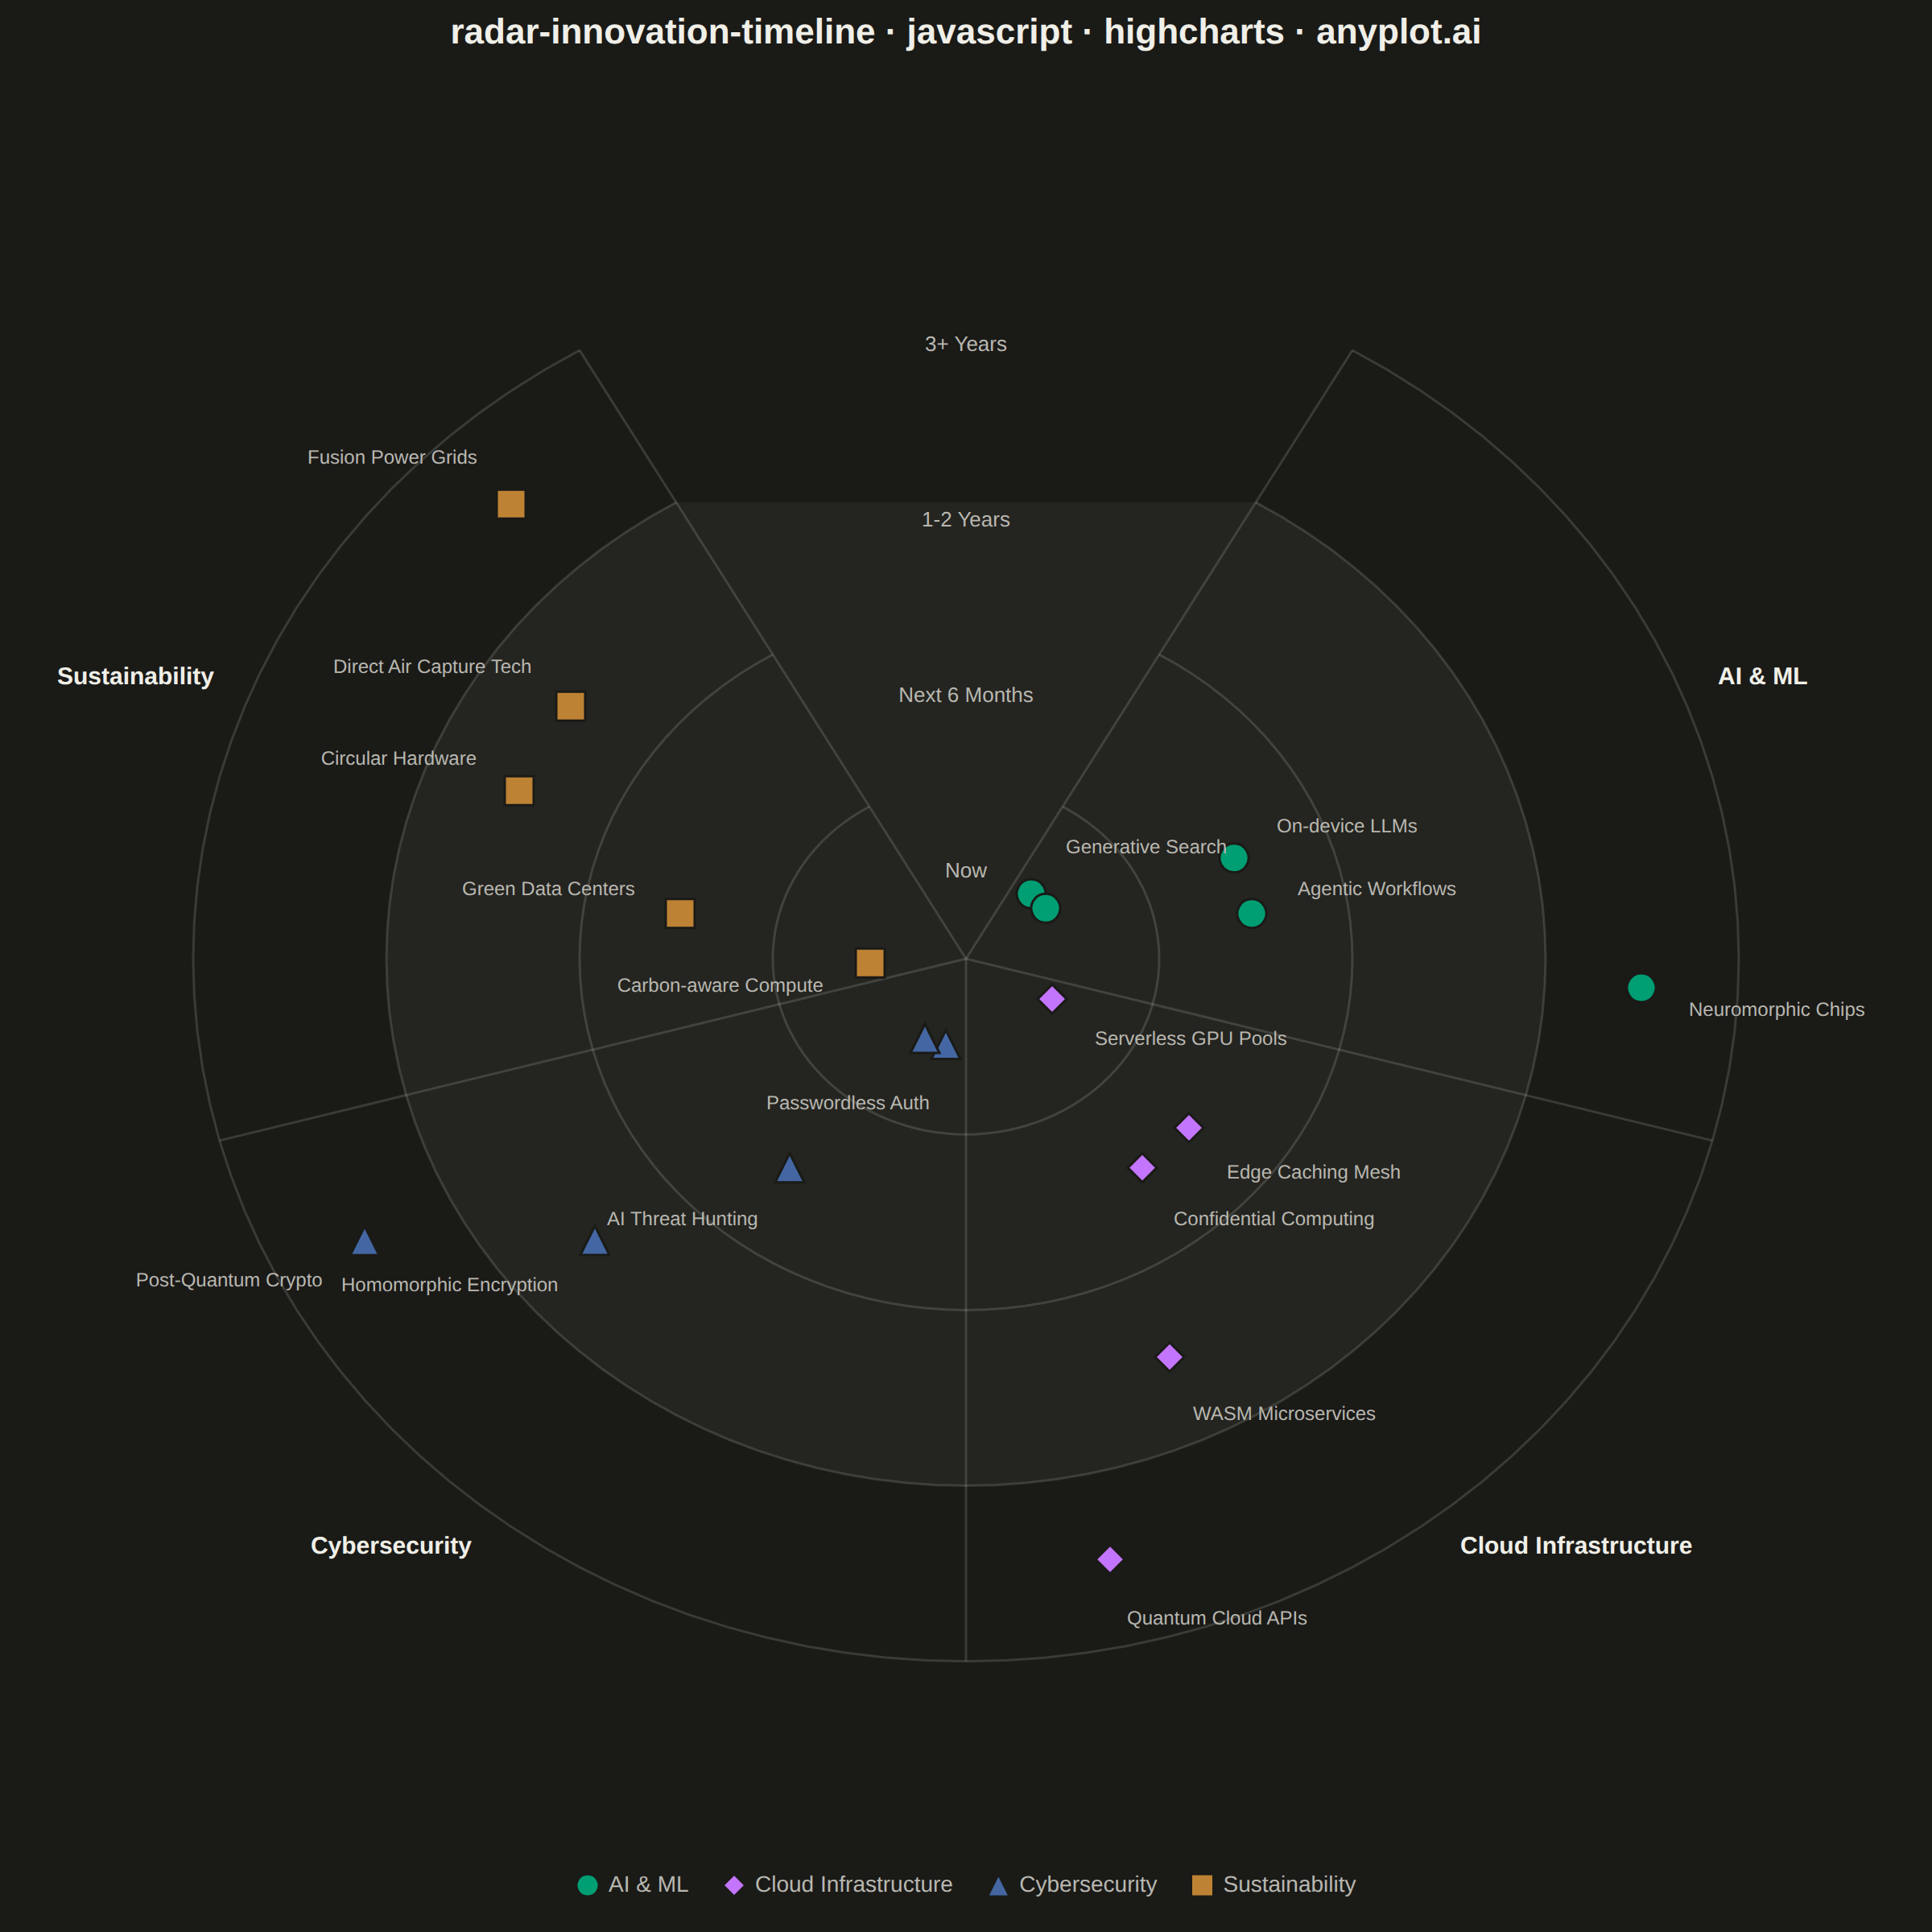
A radial chart that maps innovations, technologies, or trends onto concentric rings representing time horizons and angular sectors representing thematic categories. Inner rings represent near-term items (e.g., "Now", "Next 6 months") while outer rings represent longer-term or emerging trends (e.g., "2-5 years", "Future"). Each item is placed as a labeled point within its sector and ring, with distinct markers or colors encoding categories. Inspired by ThoughtWorks Technology Radar and similar strategic planning visualizations.
// anyplot.ai
// radar-innovation-timeline: Innovation Radar with Time-Horizon Rings
// Library: highcharts 12.6.0 | JavaScript 22.23.2
// Quality: 90/100 | Created: 2026-08-26

//# anyplot-orientation: square
const t = window.ANYPLOT_TOKENS;

// --- Data (in-memory, deterministic) ----------------------------------------
// Time horizon rings, innermost (near-term) to outermost (long-term).
const RINGS = ["Now", "Next 6 Months", "1-2 Years", "3+ Years"];
// Thematic sectors, placed clockwise starting just right of the top gap.
const SECTORS = ["AI & ML", "Cloud Infrastructure", "Cybersecurity", "Sustainability"];
const SYMBOLS = ["circle", "diamond", "triangle", "square"];

const ITEMS = [
  { name: "Generative Search", sector: 0, ring: 0 },
  { name: "Multimodal Assistants", sector: 0, ring: 0 },
  { name: "On-device LLMs", sector: 0, ring: 1 },
  { name: "Agentic Workflows", sector: 0, ring: 1 },
  { name: "Neuromorphic Chips", sector: 0, ring: 3 },
  { name: "Serverless GPU Pools", sector: 1, ring: 0 },
  { name: "Edge Caching Mesh", sector: 1, ring: 1 },
  { name: "Confidential Computing", sector: 1, ring: 1 },
  { name: "WASM Microservices", sector: 1, ring: 2 },
  { name: "Quantum Cloud APIs", sector: 1, ring: 3 },
  { name: "Passwordless Auth", sector: 2, ring: 0 },
  { name: "Zero Trust Mesh", sector: 2, ring: 0 },
  { name: "AI Threat Hunting", sector: 2, ring: 1 },
  { name: "Homomorphic Encryption", sector: 2, ring: 2 },
  { name: "Post-Quantum Crypto", sector: 2, ring: 3 },
  { name: "Carbon-aware Compute", sector: 3, ring: 0 },
  { name: "Green Data Centers", sector: 3, ring: 1 },
  { name: "Circular Hardware", sector: 3, ring: 2 },
  { name: "Direct Air Capture Tech", sector: 3, ring: 2 },
  { name: "Fusion Power Grids", sector: 3, ring: 3 },
];

// --- Polar layout (near-full circle, small top gap for the ring-axis labels) --
const GAP_DEG = 60;
const SECTOR_SPAN_DEG = (360 - GAP_DEG) / SECTORS.length;
const SECTOR_START_DEG = GAP_DEG / 2; // first sector begins just right of 12 o'clock
const RING_BOUNDS = [0, 0.24, 0.48, 0.72, 0.96]; // normalized radius per ring boundary
const MAX_R = RING_BOUNDS[RING_BOUNDS.length - 1];
const DEG2RAD = Math.PI / 180;

// angle 0 = 12 o'clock, increases clockwise (matches Highcharts pie/arc convention)
function toXY(radius, angleDeg) {
  const a = angleDeg * DEG2RAD;
  return [radius * Math.sin(a), radius * Math.cos(a)];
}

// Spread items evenly across their sector's angular span (8% inset each side)
// so consecutive items never share an angle, independent of ring assignment.
const bySector = SECTORS.map((_, i) => ITEMS.filter((item) => item.sector === i));
const seriesData = SECTORS.map((sectorName, sectorIndex) => {
  const items = bySector[sectorIndex];
  const inset = SECTOR_SPAN_DEG * 0.08;
  const usableSpan = SECTOR_SPAN_DEG - 2 * inset;
  const sectorStart = SECTOR_START_DEG + sectorIndex * SECTOR_SPAN_DEG;
  const points = items.map((item, i) => {
    const angleDeg = sectorStart + inset + ((i + 0.5) / items.length) * usableSpan;
    const ringMid = (RING_BOUNDS[item.ring] + RING_BOUNDS[item.ring + 1]) / 2;
    const [x, y] = toXY(ringMid, angleDeg);
    // Push the data label radially outward from the chart center.
    const [dx, dy] = toXY(1, angleDeg);
    return {
      x,
      y,
      name: item.name,
      ring: RINGS[item.ring],
      sector: sectorName,
      dataLabels: {
        x: dx * 24,
        y: -dy * 24,
        align: dx >= 0 ? "left" : "right",
        verticalAlign: dy >= 0 ? "bottom" : "top",
      },
    };
  });
  return {
    name: sectorName,
    color: t.palette[sectorIndex],
    marker: { symbol: SYMBOLS[sectorIndex] },
    data: points,
  };
});

// --- Chart -------------------------------------------------------------------
Highcharts.chart("container", {
  chart: {
    backgroundColor: "transparent",
    animation: false,
    style: { fontFamily: "inherit" },
    events: {
      load() {
        drawRadarChrome(this);
      },
    },
  },
  credits: { enabled: false },
  colors: t.palette,
  title: {
    text: "radar-innovation-timeline · javascript · highcharts · anyplot.ai",
    style: { color: t.ink, fontSize: "22px", fontWeight: "600" },
  },
  xAxis: { min: -1.18, max: 1.18, visible: false },
  yAxis: { min: -1.18, max: 1.18, visible: false, title: { text: null } },
  legend: {
    itemStyle: { color: t.inkSoft, fontSize: "14px" },
    itemHoverStyle: { color: t.ink },
  },
  tooltip: {
    headerFormat: "",
    pointFormat: "<b>{point.name}</b><br/>{point.sector} · {point.ring}",
  },
  plotOptions: {
    series: { animation: false },
    scatter: {
      marker: { radius: 9, lineColor: t.pageBg, lineWidth: 1.5 },
      dataLabels: {
        enabled: true,
        allowOverlap: false,
        style: {
          color: t.inkSoft,
          fontSize: "12px",
          fontWeight: "normal",
          textOutline: "none",
        },
        formatter() {
          return this.point.name;
        },
      },
    },
  },
  series: seriesData.map((s) => ({ type: "scatter", ...s })),
});

// Draws the concentric ring bands, boundary rings, sector dividers, and the
// ring/sector labels — geometry Highcharts core has no polar/radar support
// for (that lives in the highcharts-more module, which isn't loaded), so the
// radial chrome is built by hand with the SVG renderer and kept in lockstep
// with the scatter series by reusing the same axis pixel conversion.
function drawRadarChrome(chart) {
  const r = chart.renderer;
  const xAxis = chart.xAxis[0];
  const yAxis = chart.yAxis[0];
  const cx = xAxis.toPixels(0);
  const cy = yAxis.toPixels(0);
  const pxPerUnitX = xAxis.toPixels(1) - cx;
  const pxPerUnitY = cy - yAxis.toPixels(1);
  const toPx = (x, y) => [cx + x * pxPerUnitX, cy - y * pxPerUnitY];

  // Highcharts' arc angles are 0 = 12 o'clock, clockwise — the same
  // convention as toXY() — but renderer.arc() only draws true circles, and
  // the plot area here isn't guaranteed square (the legend eats vertical
  // space asymmetrically). So ring geometry is built as a polygon that
  // samples toPx() every 3°, which stays exactly in lockstep with the
  // scatter series (positioned through the same per-axis pixel conversion)
  // even when x and y pixel-per-unit differ.
  const arcPoints = (radius, fromDeg, toDeg) => {
    const steps = Math.ceil((toDeg - fromDeg) / 3);
    const pts = [];
    for (let s = 0; s <= steps; s++) {
      const deg = fromDeg + ((toDeg - fromDeg) * s) / steps;
      pts.push(toPx(...toXY(radius, deg)));
    }
    return pts;
  };
  const ringStart = SECTOR_START_DEG;
  const ringEnd = SECTOR_START_DEG + (360 - GAP_DEG);
  const pathFromPoints = (pts, closed) => {
    const cmds = pts.flatMap(([x, y], i) => [i === 0 ? "M" : "L", x, y]);
    return closed ? [...cmds, "Z"] : cmds;
  };

  const group = r.g("radar-chrome").add();
  group.attr({ zIndex: 1 });

  // Alternating ring bands (subtle fill for time-horizon separation) — only
  // every other ring gets the elevated tone so the banding stays legible.
  RING_BOUNDS.slice(0, -1).forEach((inner, i) => {
    if (i % 2 !== 0) return;
    const outer = RING_BOUNDS[i + 1];
    const outline = [...arcPoints(outer, ringStart, ringEnd), ...arcPoints(inner, ringEnd, ringStart)];
    r.path(pathFromPoints(outline, true))
      .attr({ fill: t.elevatedBg })
      .add(group);
  });

  // Ring boundary lines.
  RING_BOUNDS.slice(1).forEach((radius) => {
    r.path(pathFromPoints(arcPoints(radius, ringStart, ringEnd), false))
      .attr({ stroke: t.grid, "stroke-width": 1.5, fill: "none" })
      .add(group);
  });

  // Sector divider lines (radial spokes at every sector boundary).
  for (let i = 0; i <= SECTORS.length; i++) {
    const angleDeg = SECTOR_START_DEG + i * SECTOR_SPAN_DEG;
    const [x, y] = toXY(MAX_R, angleDeg);
    const [px, py] = toPx(x, y);
    r.path(["M", cx, cy, "L", px, py])
      .attr({ stroke: t.grid, "stroke-width": 1.5 })
      .add(group);
  }

  // Sector labels along the outer edge, anchored to stay inside the canvas.
  SECTORS.forEach((name, i) => {
    const angleDeg = SECTOR_START_DEG + (i + 0.5) * SECTOR_SPAN_DEG;
    const [x, y] = toXY(MAX_R + 0.05, angleDeg);
    const [px, py] = toPx(x, y);
    const align = x > 0.15 ? "left" : x < -0.15 ? "right" : "center";
    r.text(name, px, py + 5)
      .attr({ align, "text-anchor": align === "left" ? "start" : align === "right" ? "end" : "middle" })
      .css({ color: t.ink, fontSize: "15px", fontWeight: "600" })
      .add(group);
  });

  // Ring labels stacked along the vertical gap axis (angle = 0, straight up).
  RING_BOUNDS.slice(1).forEach((_, i) => {
    const ringMid = (RING_BOUNDS[i] + RING_BOUNDS[i + 1]) / 2;
    const [, py] = toPx(0, ringMid);
    r.text(RINGS[i], cx, py + 4)
      .attr({ align: "center", "text-anchor": "middle" })
      .css({ color: t.inkSoft, fontSize: "13px" })
      .add(group);
  });
}
Runnable source as JSON, for any HTTP client: https://api.anyplot.ai/specs/radar-innovation-timeline/highcharts/code. Any spec id and library id listed in llms-full.txt fit the same URL shape; every URL below is complete and callable.
{
  "spec_id": "radar-innovation-timeline",
  "language": "javascript",
  "library": "highcharts",
  "page": "https://anyplot.ai/radar-innovation-timeline/javascript/highcharts",
  "hub": "https://anyplot.ai/radar-innovation-timeline",
  "code_json": "https://api.anyplot.ai/specs/radar-innovation-timeline/highcharts/code",
  "spec_json": "https://api.anyplot.ai/specs/radar-innovation-timeline",
  "render_light_png": "https://storage.googleapis.com/anyplot-images/plots/radar-innovation-timeline/javascript/highcharts/plot-light.png",
  "render_dark_png": "https://storage.googleapis.com/anyplot-images/plots/radar-innovation-timeline/javascript/highcharts/plot-dark.png",
  "interactive_light_html": "https://storage.googleapis.com/anyplot-images/plots/radar-innovation-timeline/javascript/highcharts/plot-light.html",
  "interactive_dark_html": "https://storage.googleapis.com/anyplot-images/plots/radar-innovation-timeline/javascript/highcharts/plot-dark.html",
  "quality_score": 90.0,
  "license": "MIT",
  "guide": "https://anyplot.ai/llms.txt"
}
Part of Innovation Radar with Time-Horizon Rings on anyplot.ai.