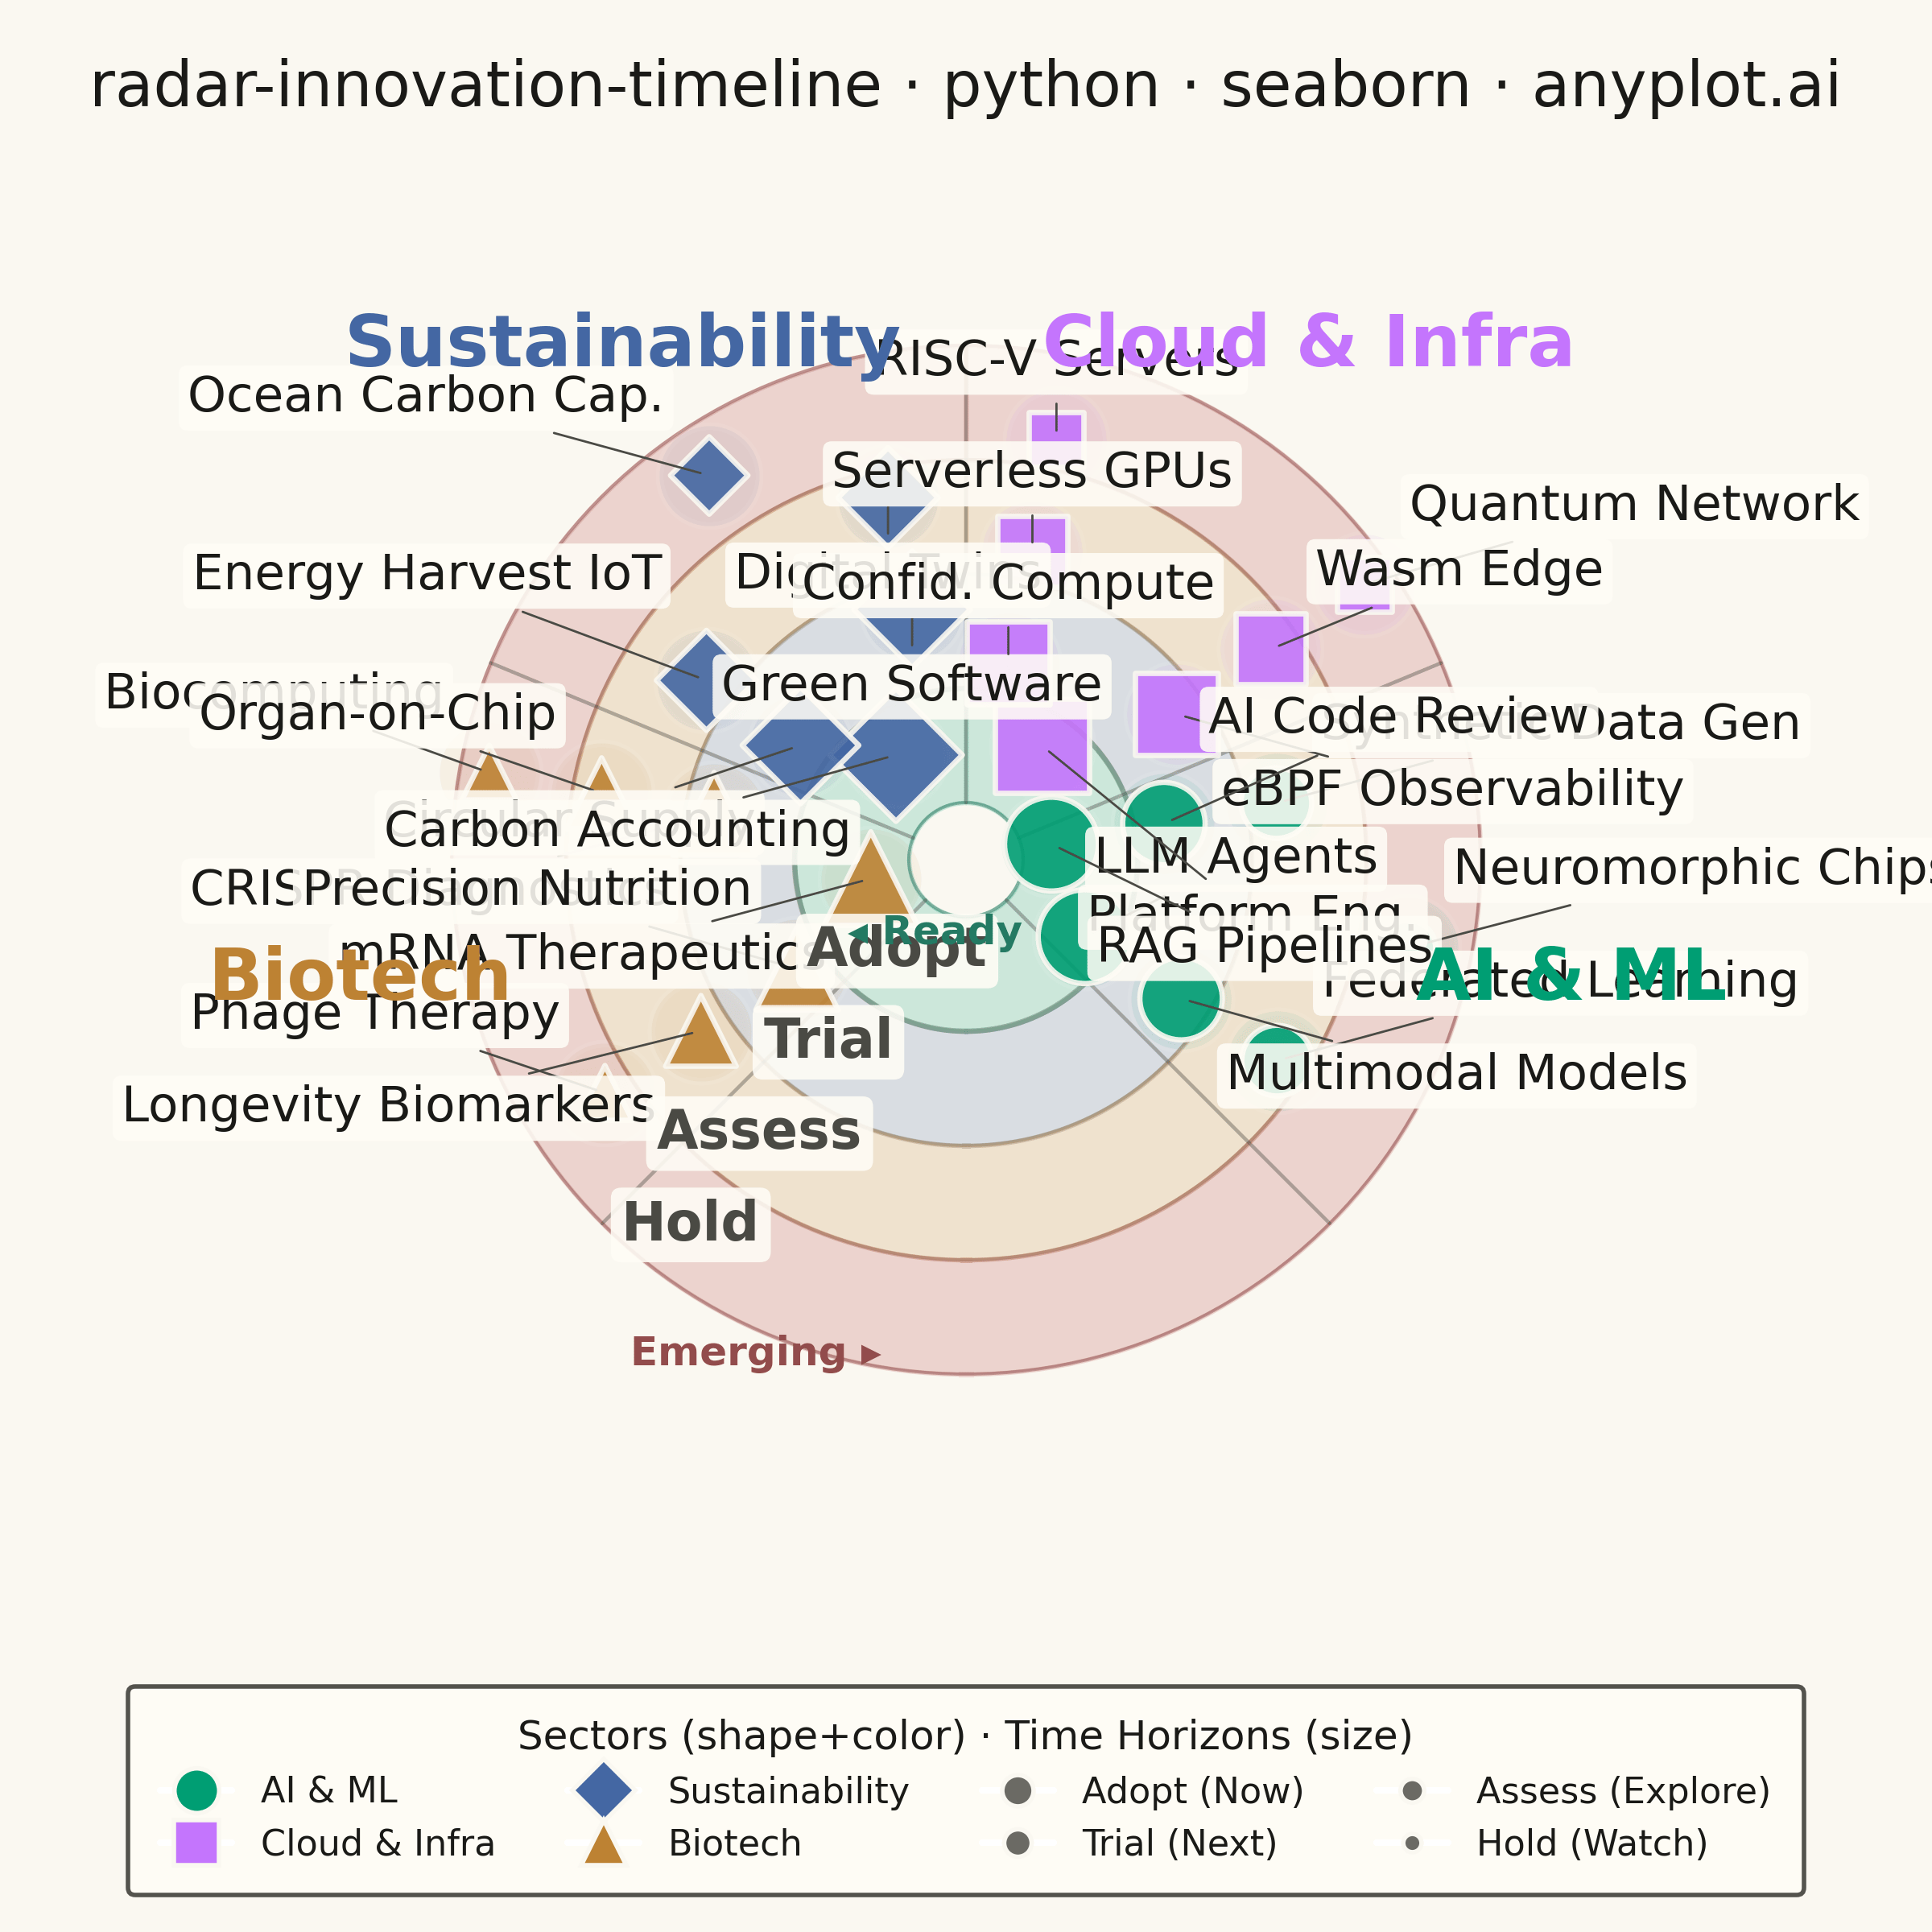
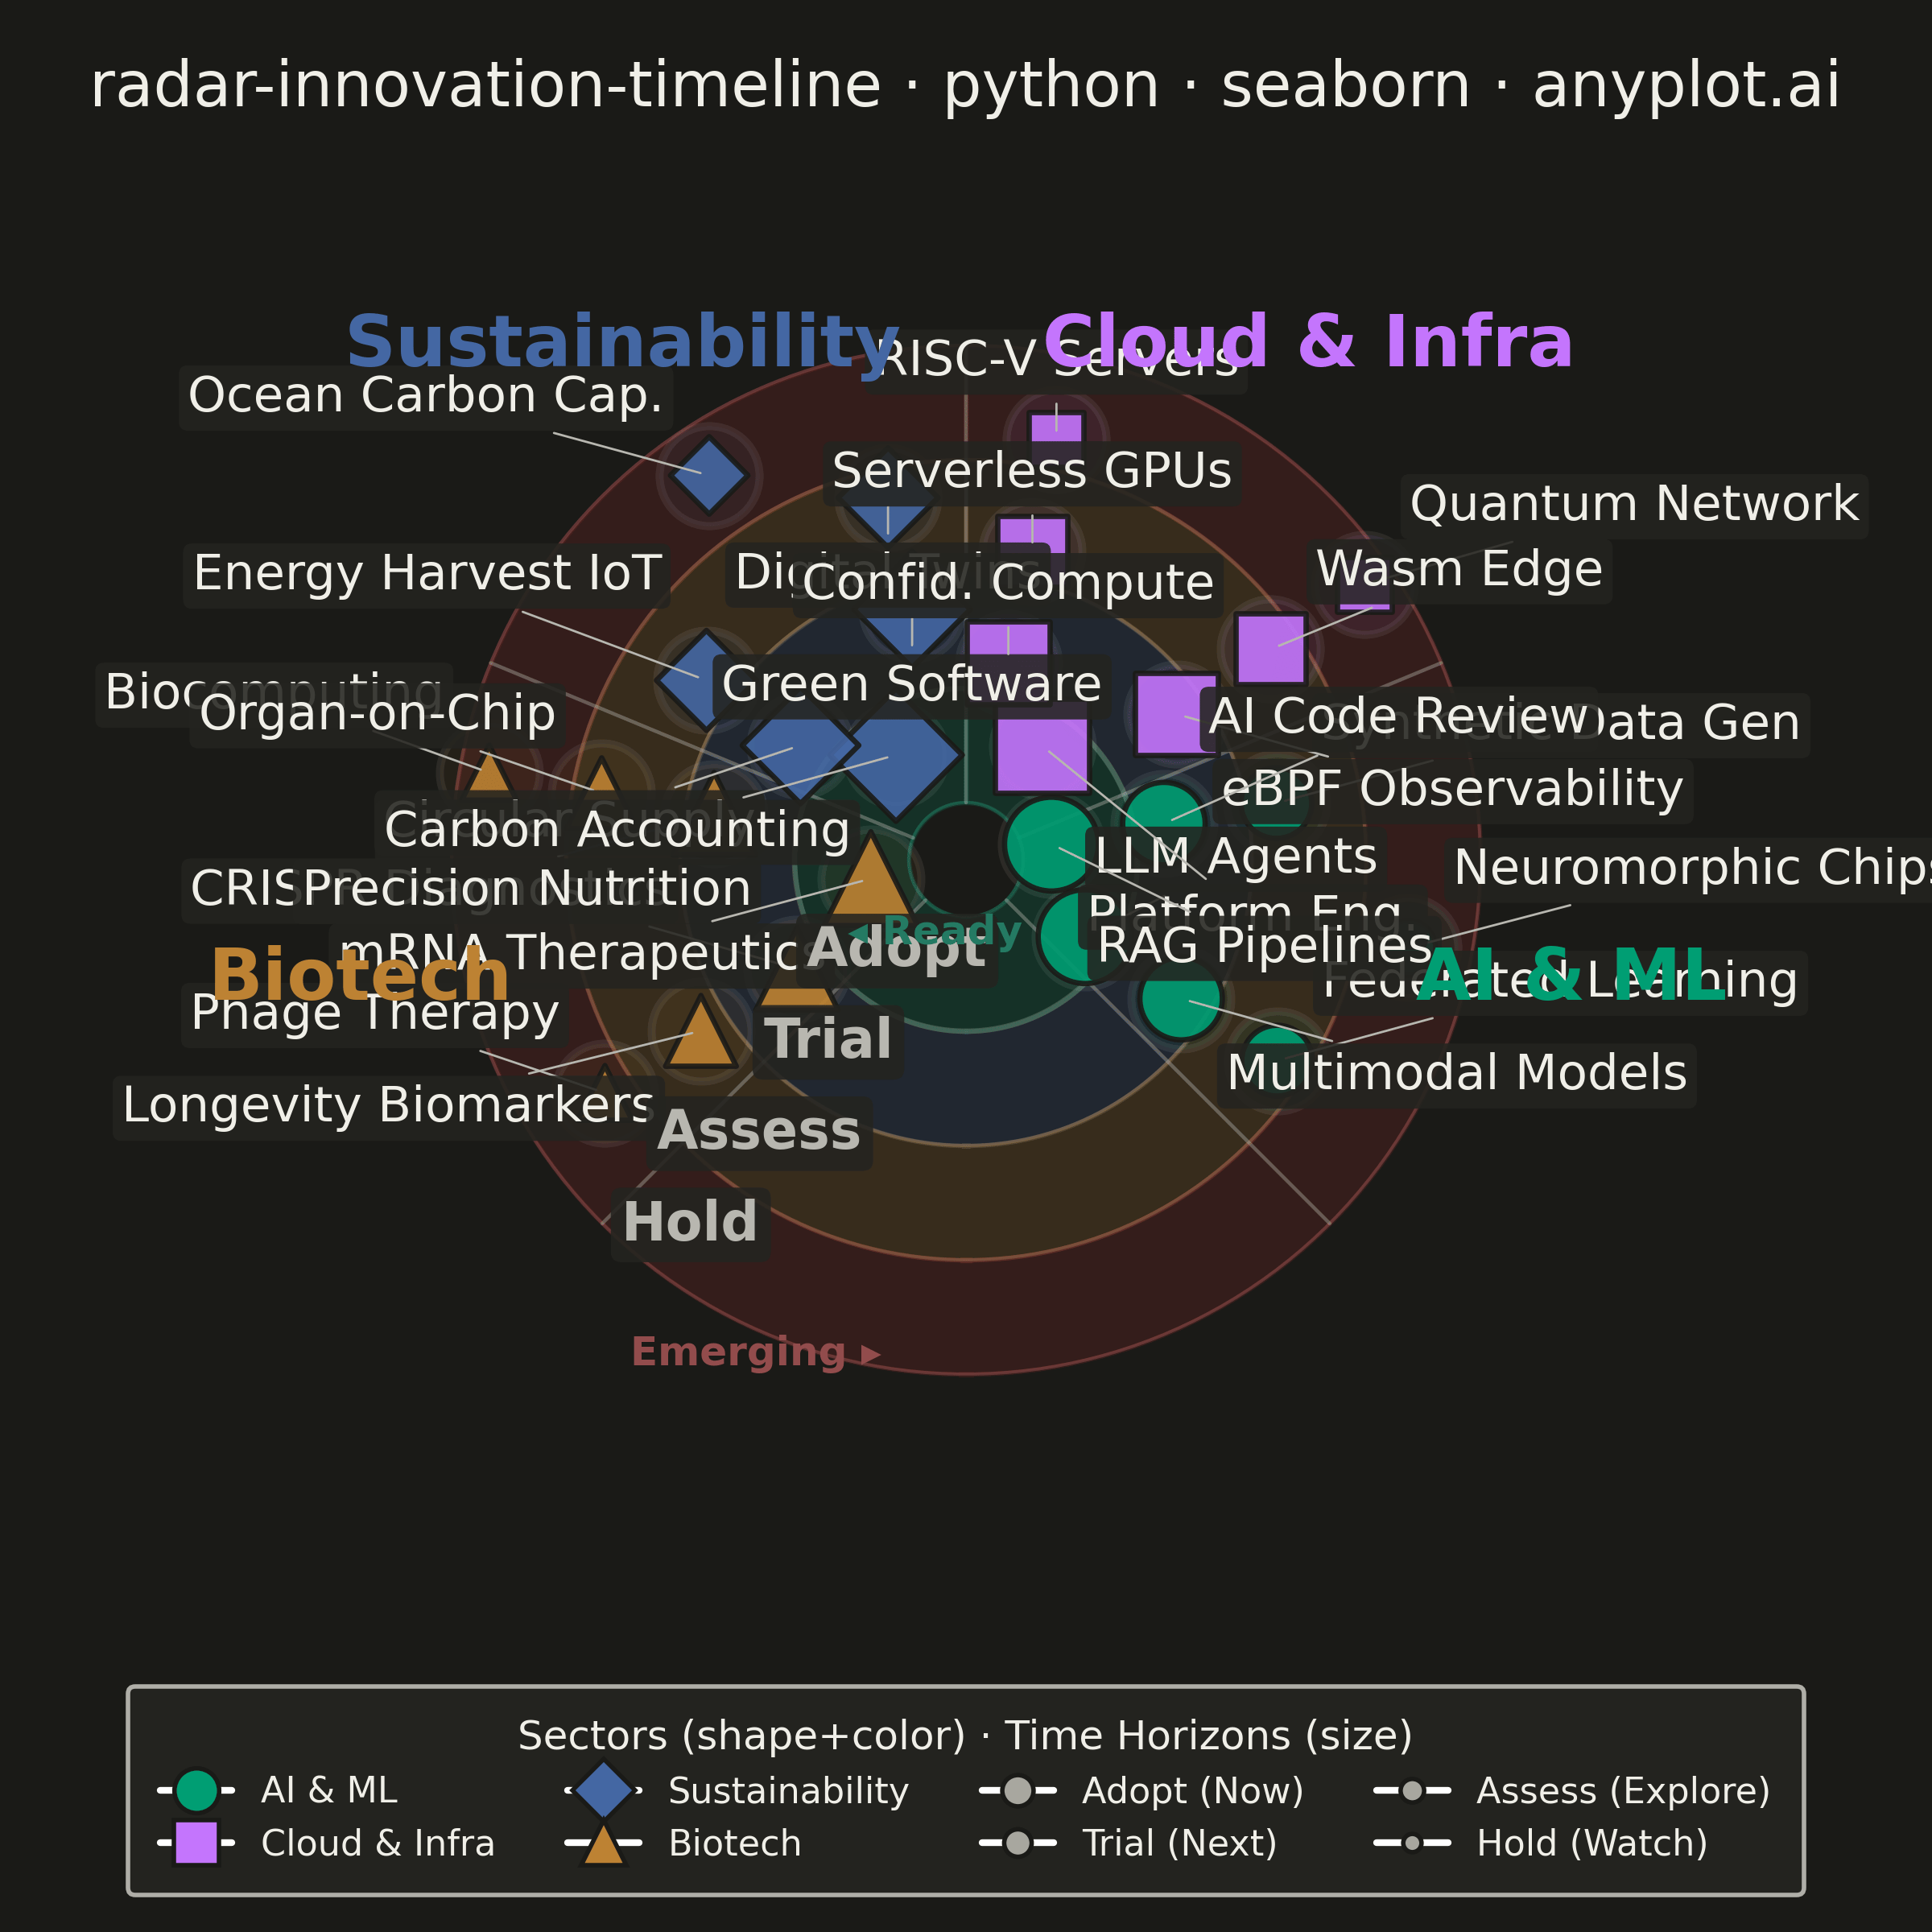
A radial chart that maps innovations, technologies, or trends onto concentric rings representing time horizons and angular sectors representing thematic categories. Inner rings represent near-term items (e.g., "Now", "Next 6 months") while outer rings represent longer-term or emerging trends (e.g., "2-5 years", "Future"). Each item is placed as a labeled point within its sector and ring, with distinct markers or colors encoding categories. Inspired by ThoughtWorks Technology Radar and similar strategic planning visualizations.
""" anyplot.ai
radar-innovation-timeline: Innovation Radar with Time-Horizon Rings
Library: seaborn 0.13.2 | Python 3.13.13
Quality: 85/100 | Updated: 2026-05-29
"""

import os

import matplotlib.lines as mlines
import matplotlib.pyplot as plt
import numpy as np
import pandas as pd
import seaborn as sns


# Theme tokens
THEME = os.getenv("ANYPLOT_THEME", "light")
PAGE_BG = "#FAF8F1" if THEME == "light" else "#1A1A17"
ELEVATED_BG = "#FFFDF6" if THEME == "light" else "#242420"
INK = "#1A1A17" if THEME == "light" else "#F0EFE8"
INK_SOFT = "#4A4A44" if THEME == "light" else "#B8B7B0"
INK_MUTED = "#6B6A63" if THEME == "light" else "#A8A79F"

# Imprint palette — first 4 positions for sector encoding
IMPRINT_PALETTE = ["#009E73", "#C475FD", "#4467A3", "#BD8233", "#AE3030", "#2ABCCD", "#954477", "#99B314"]

sns.set_theme(
    style="ticks",
    rc={
        "figure.facecolor": PAGE_BG,
        "axes.facecolor": PAGE_BG,
        "axes.edgecolor": INK_SOFT,
        "axes.labelcolor": INK,
        "text.color": INK,
        "xtick.color": INK_SOFT,
        "ytick.color": INK_SOFT,
        "grid.color": INK,
        "grid.alpha": 0.15,
        "legend.facecolor": ELEVATED_BG,
        "legend.edgecolor": INK_SOFT,
    },
)

np.random.seed(42)

# Configuration
sectors = ["AI & ML", "Cloud & Infra", "Sustainability", "Biotech"]
rings = ["Adopt", "Trial", "Assess", "Hold"]
ring_radii = {"Adopt": 1.0, "Trial": 2.0, "Assess": 3.0, "Hold": 4.0}
ring_importance = {"Adopt": 4, "Trial": 3, "Assess": 2, "Hold": 1}

sector_colors = IMPRINT_PALETTE[:4]
sector_palette = dict(zip(sectors, sector_colors, strict=True))
sector_markers = {"AI & ML": "o", "Cloud & Infra": "s", "Sustainability": "D", "Biotech": "^"}

total_angle_deg = 270
sector_width_deg = total_angle_deg / len(sectors)
start_angle_deg = 135

# Ring fills — Imprint colors at low alpha, visible on both themes
ring_fill_colors = ["#009E73", "#4467A3", "#BD8233", "#AE3030"]
ring_boundaries = [0.5, 1.5, 2.5, 3.5, 4.5]
# Boundary accent gradient via seaborn blend
ring_accent = sns.blend_palette(["#009E73", "#BD8233", "#AE3030"], n_colors=5)

# Innovation data (27 items across 4 rings × 4 sectors)
innovations = [
    ("LLM Agents", "Adopt", "AI & ML"),
    ("RAG Pipelines", "Adopt", "AI & ML"),
    ("Multimodal Models", "Trial", "AI & ML"),
    ("Federated Learning", "Assess", "AI & ML"),
    ("Neuromorphic Chips", "Hold", "AI & ML"),
    ("AI Code Review", "Trial", "AI & ML"),
    ("Synthetic Data Gen", "Assess", "AI & ML"),
    ("Platform Eng.", "Adopt", "Cloud & Infra"),
    ("eBPF Observability", "Trial", "Cloud & Infra"),
    ("Wasm Edge", "Assess", "Cloud & Infra"),
    ("Confid. Compute", "Trial", "Cloud & Infra"),
    ("Serverless GPUs", "Assess", "Cloud & Infra"),
    ("Quantum Network", "Hold", "Cloud & Infra"),
    ("RISC-V Servers", "Hold", "Cloud & Infra"),
    ("Carbon Accounting", "Adopt", "Sustainability"),
    ("Green Software", "Trial", "Sustainability"),
    ("Digital Twins", "Assess", "Sustainability"),
    ("Circular Supply", "Trial", "Sustainability"),
    ("Ocean Carbon Cap.", "Hold", "Sustainability"),
    ("Energy Harvest IoT", "Assess", "Sustainability"),
    ("mRNA Therapeutics", "Adopt", "Biotech"),
    ("CRISPR Diagnostics", "Trial", "Biotech"),
    ("Organ-on-Chip", "Assess", "Biotech"),
    ("Biocomputing", "Hold", "Biotech"),
    ("Precision Nutrition", "Trial", "Biotech"),
    ("Longevity Biomarkers", "Assess", "Biotech"),
    ("Phage Therapy", "Hold", "Biotech"),
]

# Build DataFrame with polar positions
records = []
for name, ring, sector in innovations:
    sector_idx = sectors.index(sector)
    same_group = [(n, r, s) for n, r, s in innovations if s == sector and r == ring]
    item_idx = same_group.index((name, ring, sector))
    n_in_group = len(same_group)

    sector_start = np.deg2rad(start_angle_deg - sector_idx * sector_width_deg)
    sector_end = np.deg2rad(start_angle_deg - (sector_idx + 1) * sector_width_deg)
    margin = 0.10 * (sector_start - sector_end)
    usable_start = sector_start - margin
    usable_end = sector_end + margin

    if n_in_group == 1:
        angle = (usable_start + usable_end) / 2
    elif n_in_group == 2:
        mid = (usable_start + usable_end) / 2
        half = 0.80 * (usable_start - usable_end) / 2
        angle = mid + half if item_idx == 0 else mid - half
    else:
        angle = usable_start + (usable_end - usable_start) * item_idx / (n_in_group - 1)

    radial_jitter = (
        0.24
        if (n_in_group == 2 and item_idx == 0)
        else (-0.24 if (n_in_group == 2 and item_idx == 1) else np.random.uniform(-0.22, 0.22))
    )
    radius = ring_radii[ring] + radial_jitter

    records.append(
        {
            "name": name,
            "ring": ring,
            "sector": sector,
            "angle": angle,
            "radius": radius,
            "importance": ring_importance[ring],
        }
    )

df = pd.DataFrame(records)

# Plot — square canvas for radar (2400×2400 px); leave bottom 20% for legend
fig = plt.figure(figsize=(6, 6), dpi=400, facecolor=PAGE_BG)
ax = fig.add_subplot(111, projection="polar")
ax.set_facecolor(PAGE_BG)
ax.set_theta_zero_location("N")
ax.set_theta_direction(-1)
fig.subplots_adjust(left=0.05, right=0.95, top=0.91, bottom=0.20)

# Ring background fills — Imprint colors at very low alpha, theme-neutral
theta_fill = np.linspace(0, 2 * np.pi, 200)
for i in range(len(rings)):
    ax.fill_between(
        theta_fill, ring_boundaries[i], ring_boundaries[i + 1], color=ring_fill_colors[i], alpha=0.18, zorder=0
    )

# Ring boundary lines with Imprint-derived gradient
for i, rb in enumerate(ring_boundaries):
    lw = 1.2 if i == 1 else 0.7
    ax.plot(
        theta_fill,
        np.full_like(theta_fill, rb),
        color=sns.desaturate(ring_accent[i], 0.5),
        linewidth=lw,
        alpha=0.5,
        zorder=1,
    )

# Sector divider lines
for i in range(len(sectors) + 1):
    angle = np.deg2rad(start_angle_deg - i * sector_width_deg)
    ax.plot([angle, angle], [0.5, 4.5], color=INK_SOFT, linewidth=0.8, alpha=0.4, zorder=1)

# Plot innovations — seaborn scatterplot with color + shape + size encoding
size_map = {1: 150, 2: 250, 3: 340, 4: 440}
sns.scatterplot(
    data=df,
    x="angle",
    y="radius",
    hue="sector",
    style="sector",
    size="importance",
    sizes=size_map,
    markers=sector_markers,
    palette=sector_palette,
    edgecolor=PAGE_BG,
    linewidth=1.2,
    alpha=0.9,
    legend=False,
    ax=ax,
    zorder=5,
)

# Subtle halo per sector using seaborn scatterplot
for sector_name in sectors:
    sector_df = df[df["sector"] == sector_name]
    sns.scatterplot(
        data=sector_df,
        x="angle",
        y="radius",
        color=sector_palette[sector_name],
        s=500,
        alpha=0.07,
        legend=False,
        ax=ax,
        zorder=3,
    )

# Axes setup — clean polar frame
ax.set_ylim(0, 6.0)
ax.set_yticks([])
ax.set_xticks([])
ax.set_xlabel("")
ax.set_ylabel("")
ax.grid(False)
ax.spines["polar"].set_visible(False)

fig.canvas.draw()

# Innovation labels with improved collision detection and canvas boundary awareness
placed_boxes = []
DPI = fig.dpi
PT = DPI / 72.0
FONT_SIZE = 10
CHAR_W = FONT_SIZE * 0.62 * PT
CHAR_H = FONT_SIZE * 1.3 * PT
BOX_PAD = 6 * PT

fig_width_px = fig.get_figwidth() * DPI
fig_height_px = fig.get_figheight() * DPI
MARGIN_PX = 8 * PT

df_sorted = df.sort_values("radius", ascending=False).reset_index(drop=True)

for _, row in df_sorted.iterrows():
    angle, radius, name = row["angle"], row["radius"], row["name"]
    angle_deg = np.rad2deg(angle) % 360
    px, py = ax.transData.transform((angle, radius))

    if 30 < angle_deg < 150:
        ha, base_x = "left", 10
    elif 210 < angle_deg < 330:
        ha, base_x = "right", -10
    else:
        ha, base_x = "center", 0

    best_pos, best_score = (12, base_x), float("inf")
    for y in [12, -12, 20, -20, 30, -30, 40, -40, 50, -50]:
        for dx_adj in [0, 10, -10, 20, -20, 30, -30]:
            x_off = base_x + dx_adj
            va_c = "bottom" if y > 0 else "top"
            cx = px + x_off * PT
            cy = py + y * PT
            w = len(name) * CHAR_W + BOX_PAD * 2
            h = CHAR_H + BOX_PAD * 2
            x0 = cx if ha == "left" else (cx - w if ha == "right" else cx - w / 2)
            y0 = cy if va_c == "bottom" else cy - h
            # Canvas boundary penalty — strongly prefer in-bounds placements
            boundary_penalty = 0
            if x0 < MARGIN_PX or x0 + w > fig_width_px - MARGIN_PX:
                boundary_penalty += 50
            if y0 < MARGIN_PX or y0 + h > fig_height_px - MARGIN_PX:
                boundary_penalty += 50
            m = 3 * PT
            overlap_count = sum(
                1
                for bx in placed_boxes
                if not (x0 + w + m < bx[0] or bx[0] + bx[2] + m < x0 or y0 + h + m < bx[1] or bx[1] + bx[3] + m < y0)
            )
            score = boundary_penalty + overlap_count
            if score < best_score:
                best_score = score
                best_pos = (y, x_off)
                if score == 0:
                    break
        if best_score == 0:
            break

    y_off, x_off = best_pos
    va = "bottom" if y_off > 0 else "top"

    ax.annotate(
        name,
        xy=(angle, radius),
        xytext=(x_off, y_off),
        textcoords="offset points",
        fontsize=FONT_SIZE,
        color=INK,
        fontweight="medium",
        ha=ha,
        va=va,
        bbox={"boxstyle": "round,pad=0.18", "facecolor": ELEVATED_BG, "edgecolor": "none", "alpha": 0.88},
        arrowprops={"arrowstyle": "-", "color": INK_SOFT, "linewidth": 0.5},
        zorder=6,
    )
    cx_f = px + x_off * PT
    cy_f = py + y_off * PT
    w_f = len(name) * CHAR_W + BOX_PAD * 2
    h_f = CHAR_H + BOX_PAD * 2
    x0_f = cx_f if ha == "left" else (cx_f - w_f if ha == "right" else cx_f - w_f / 2)
    y0_f = cy_f if va == "bottom" else cy_f - h_f
    placed_boxes.append((x0_f, y0_f, w_f, h_f))

# Sector header labels
for i, sector_name in enumerate(sectors):
    mid_angle = np.deg2rad(start_angle_deg - (i + 0.5) * sector_width_deg)
    ax.text(
        mid_angle,
        5.4,
        sector_name,
        ha="center",
        va="center",
        fontsize=16,
        fontweight="bold",
        color=sector_palette[sector_name],
        zorder=7,
    )

# Ring labels along the gap edge
label_angle = np.deg2rad(start_angle_deg - total_angle_deg - 8)
for ring_name, ring_r in zip(rings, [1.0, 2.0, 3.0, 4.0], strict=True):
    ax.text(
        label_angle,
        ring_r,
        ring_name,
        ha="center",
        va="center",
        fontsize=12,
        fontweight="bold",
        color=INK_SOFT,
        bbox={"boxstyle": "round,pad=0.2", "facecolor": ELEVATED_BG, "edgecolor": "none", "alpha": 0.88},
        zorder=7,
    )

# Directional storytelling cues (Imprint-derived colors)
dir_angle = np.deg2rad(start_angle_deg - total_angle_deg - 22)
ax.text(
    dir_angle,
    0.7,
    "◂ Ready",
    fontsize=9,
    color=sns.desaturate("#009E73", 0.55),
    fontweight="bold",
    ha="center",
    va="center",
    zorder=7,
)
ax.text(
    dir_angle,
    4.7,
    "Emerging ▸",
    fontsize=9,
    color=sns.desaturate("#AE3030", 0.55),
    fontweight="bold",
    ha="center",
    va="center",
    zorder=7,
)

# Title — figure-centered via suptitle so it doesn't clip at axes boundaries
title = "radar-innovation-timeline · python · seaborn · anyplot.ai"
title_fontsize = max(8, round(12 * 67 / len(title)))
fig.suptitle(title, fontsize=title_fontsize, fontweight="medium", color=INK, y=0.97)

# Combined legend — placed at bottom of figure using the 270° chart's natural gap
sector_handles = [
    mlines.Line2D(
        [],
        [],
        marker=sector_markers[s],
        color="w",
        markerfacecolor=sector_palette[s],
        markeredgecolor=PAGE_BG,
        markersize=10,
        label=s,
    )
    for s in sectors
]
ring_sizes_legend = {"Adopt (Now)": 440, "Trial (Next)": 340, "Assess (Explore)": 250, "Hold (Watch)": 150}
ring_handles = [
    mlines.Line2D(
        [],
        [],
        marker="o",
        color="w",
        markerfacecolor=INK_MUTED,
        markeredgecolor=PAGE_BG,
        markersize=np.sqrt(sz) / 3,
        label=label,
    )
    for label, sz in ring_sizes_legend.items()
]
legend = fig.legend(
    handles=sector_handles + ring_handles,
    loc="lower center",
    bbox_to_anchor=(0.5, 0.01),
    ncols=4,
    fontsize=8,
    title="Sectors (shape+color) · Time Horizons (size)",
    title_fontsize=9,
    framealpha=0.95,
    edgecolor=INK_SOFT,
    fancybox=True,
    handletextpad=0.8,
    borderpad=0.9,
)
legend.get_frame().set_facecolor(ELEVATED_BG)

# Save — square canvas, no bbox_inches trim (seaborn hard rule)
plt.savefig(f"plot-{THEME}.png", dpi=400, facecolor=PAGE_BG)
Runnable source as JSON, for any HTTP client: https://api.anyplot.ai/specs/radar-innovation-timeline/seaborn/code. Any spec id and library id listed in llms-full.txt fit the same URL shape; every URL below is complete and callable.
{
  "spec_id": "radar-innovation-timeline",
  "language": "python",
  "library": "seaborn",
  "page": "https://anyplot.ai/radar-innovation-timeline/python/seaborn",
  "hub": "https://anyplot.ai/radar-innovation-timeline",
  "code_json": "https://api.anyplot.ai/specs/radar-innovation-timeline/seaborn/code",
  "spec_json": "https://api.anyplot.ai/specs/radar-innovation-timeline",
  "render_light_png": "https://storage.googleapis.com/anyplot-images/plots/radar-innovation-timeline/python/seaborn/plot-light.png",
  "render_dark_png": "https://storage.googleapis.com/anyplot-images/plots/radar-innovation-timeline/python/seaborn/plot-dark.png",
  "quality_score": 85.0,
  "license": "MIT",
  "guide": "https://anyplot.ai/llms.txt"
}
Part of Innovation Radar with Time-Horizon Rings on anyplot.ai.