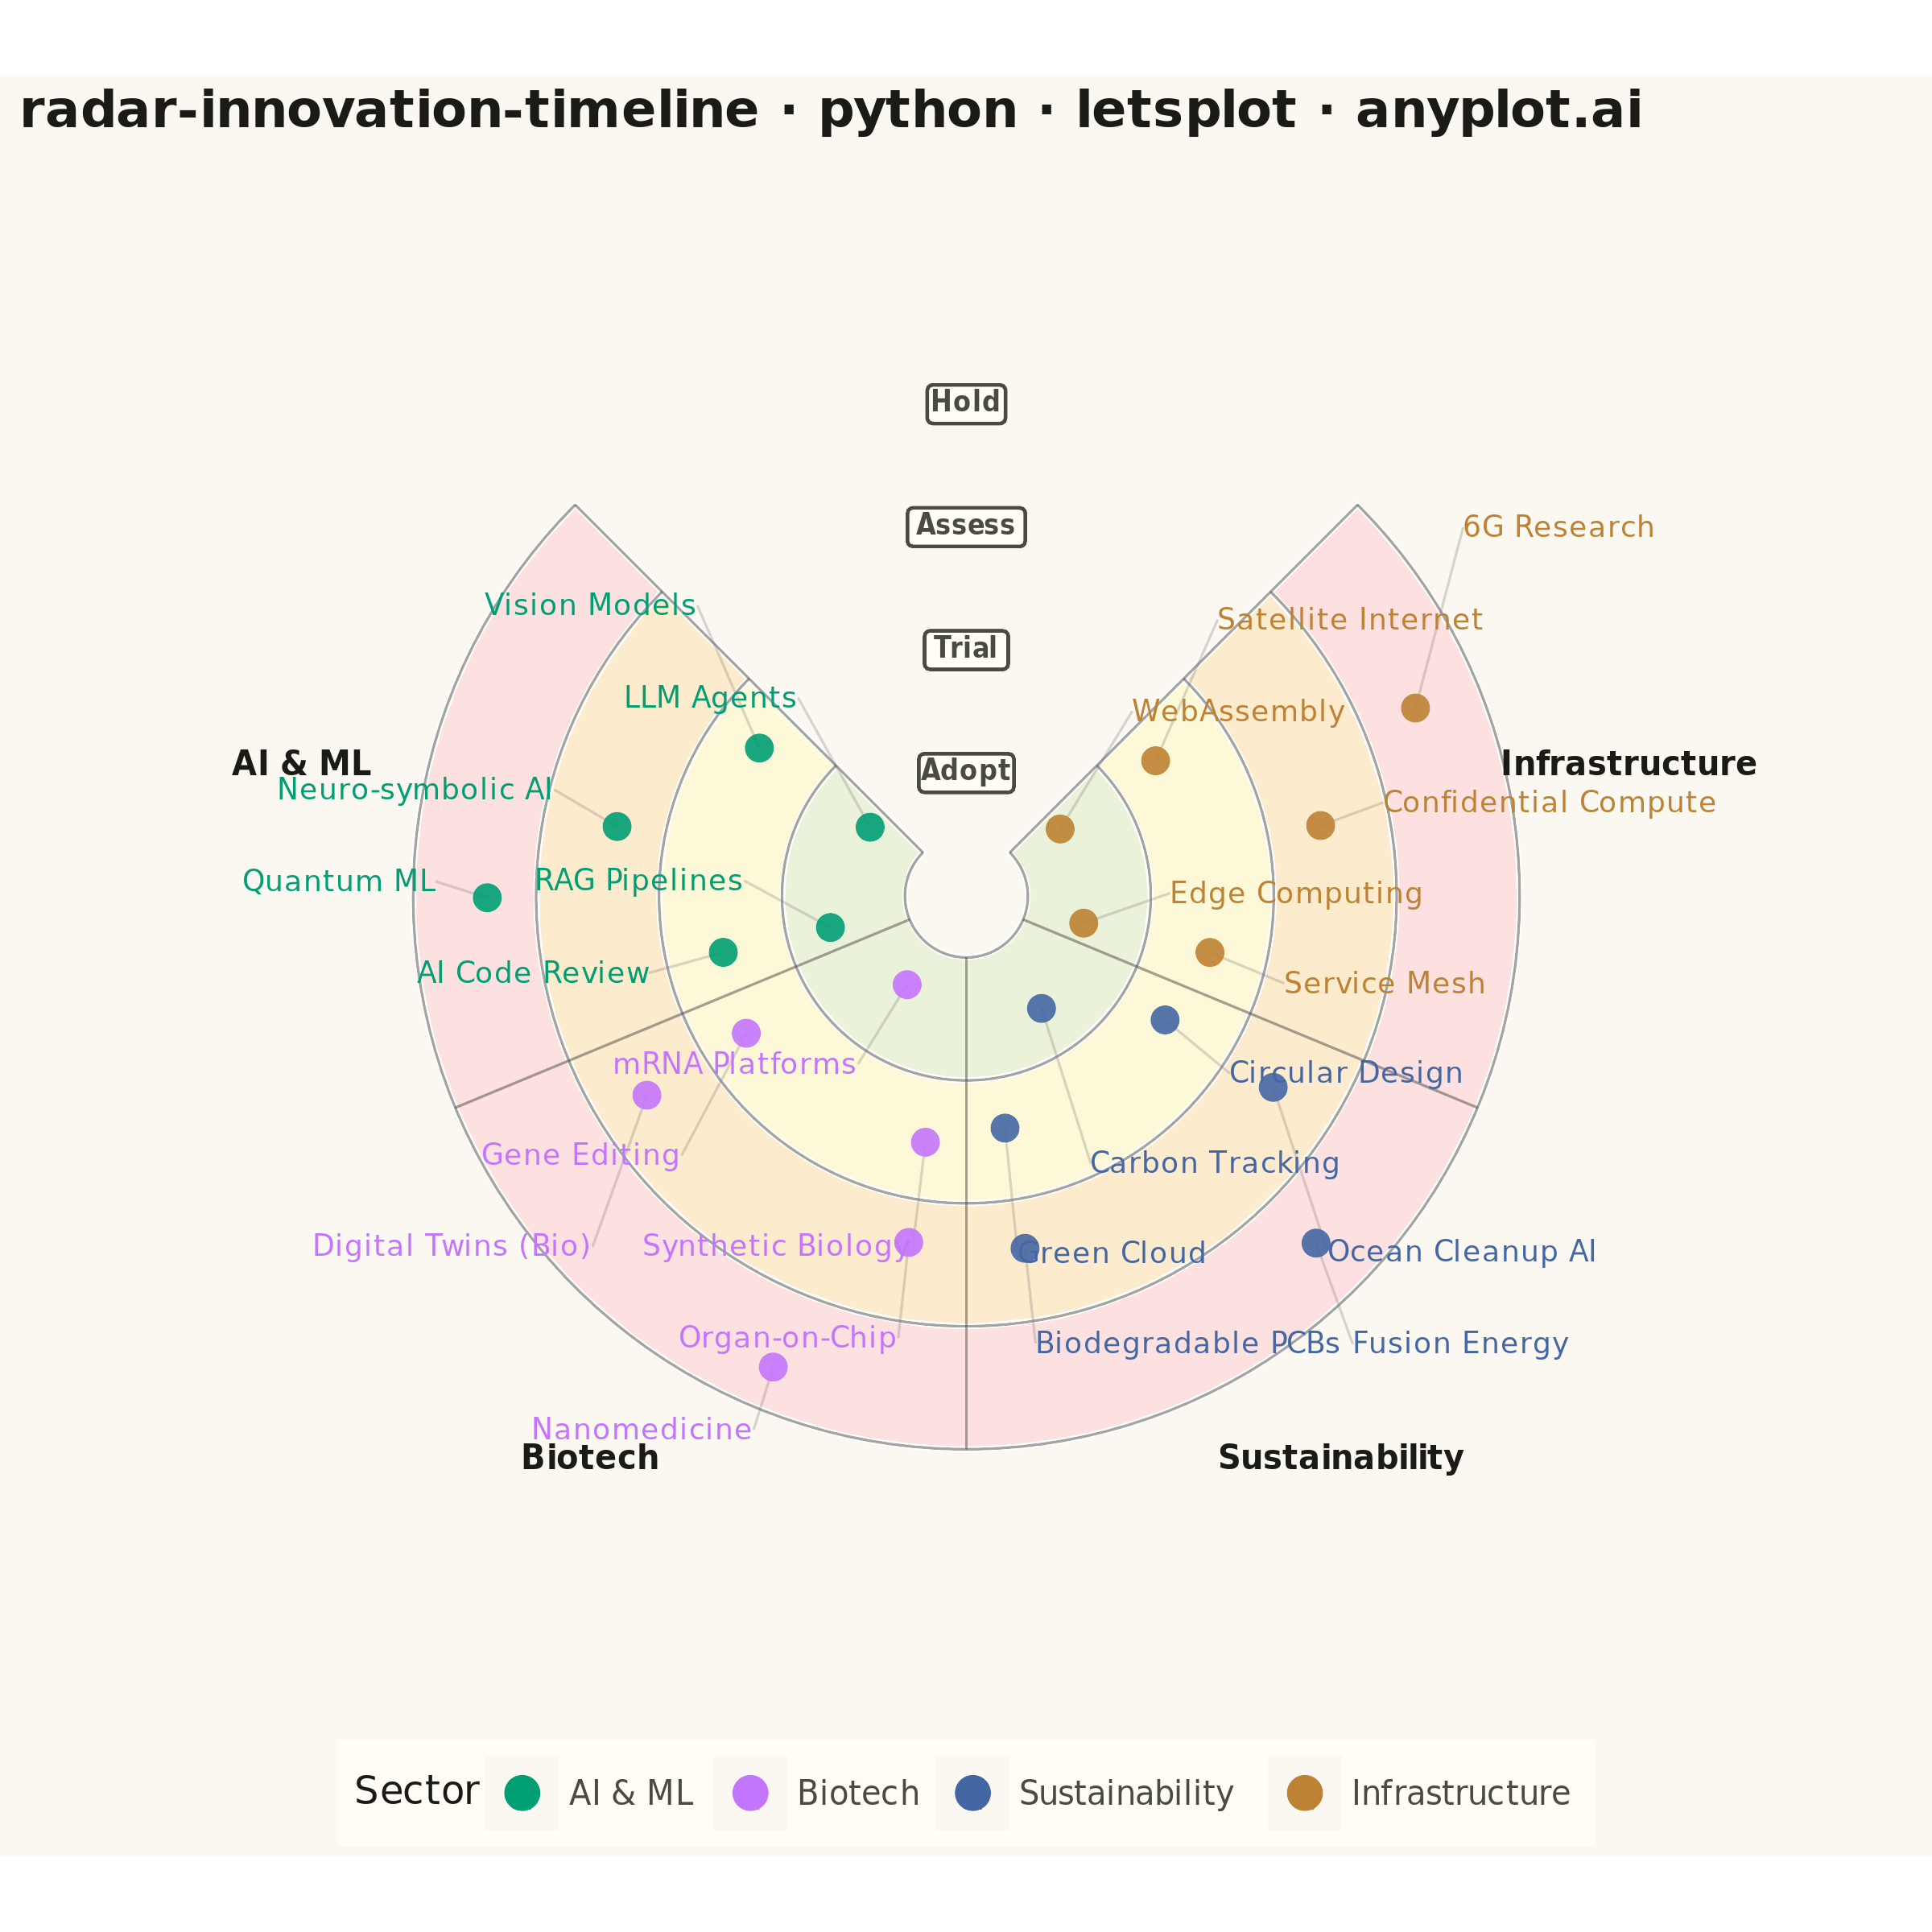
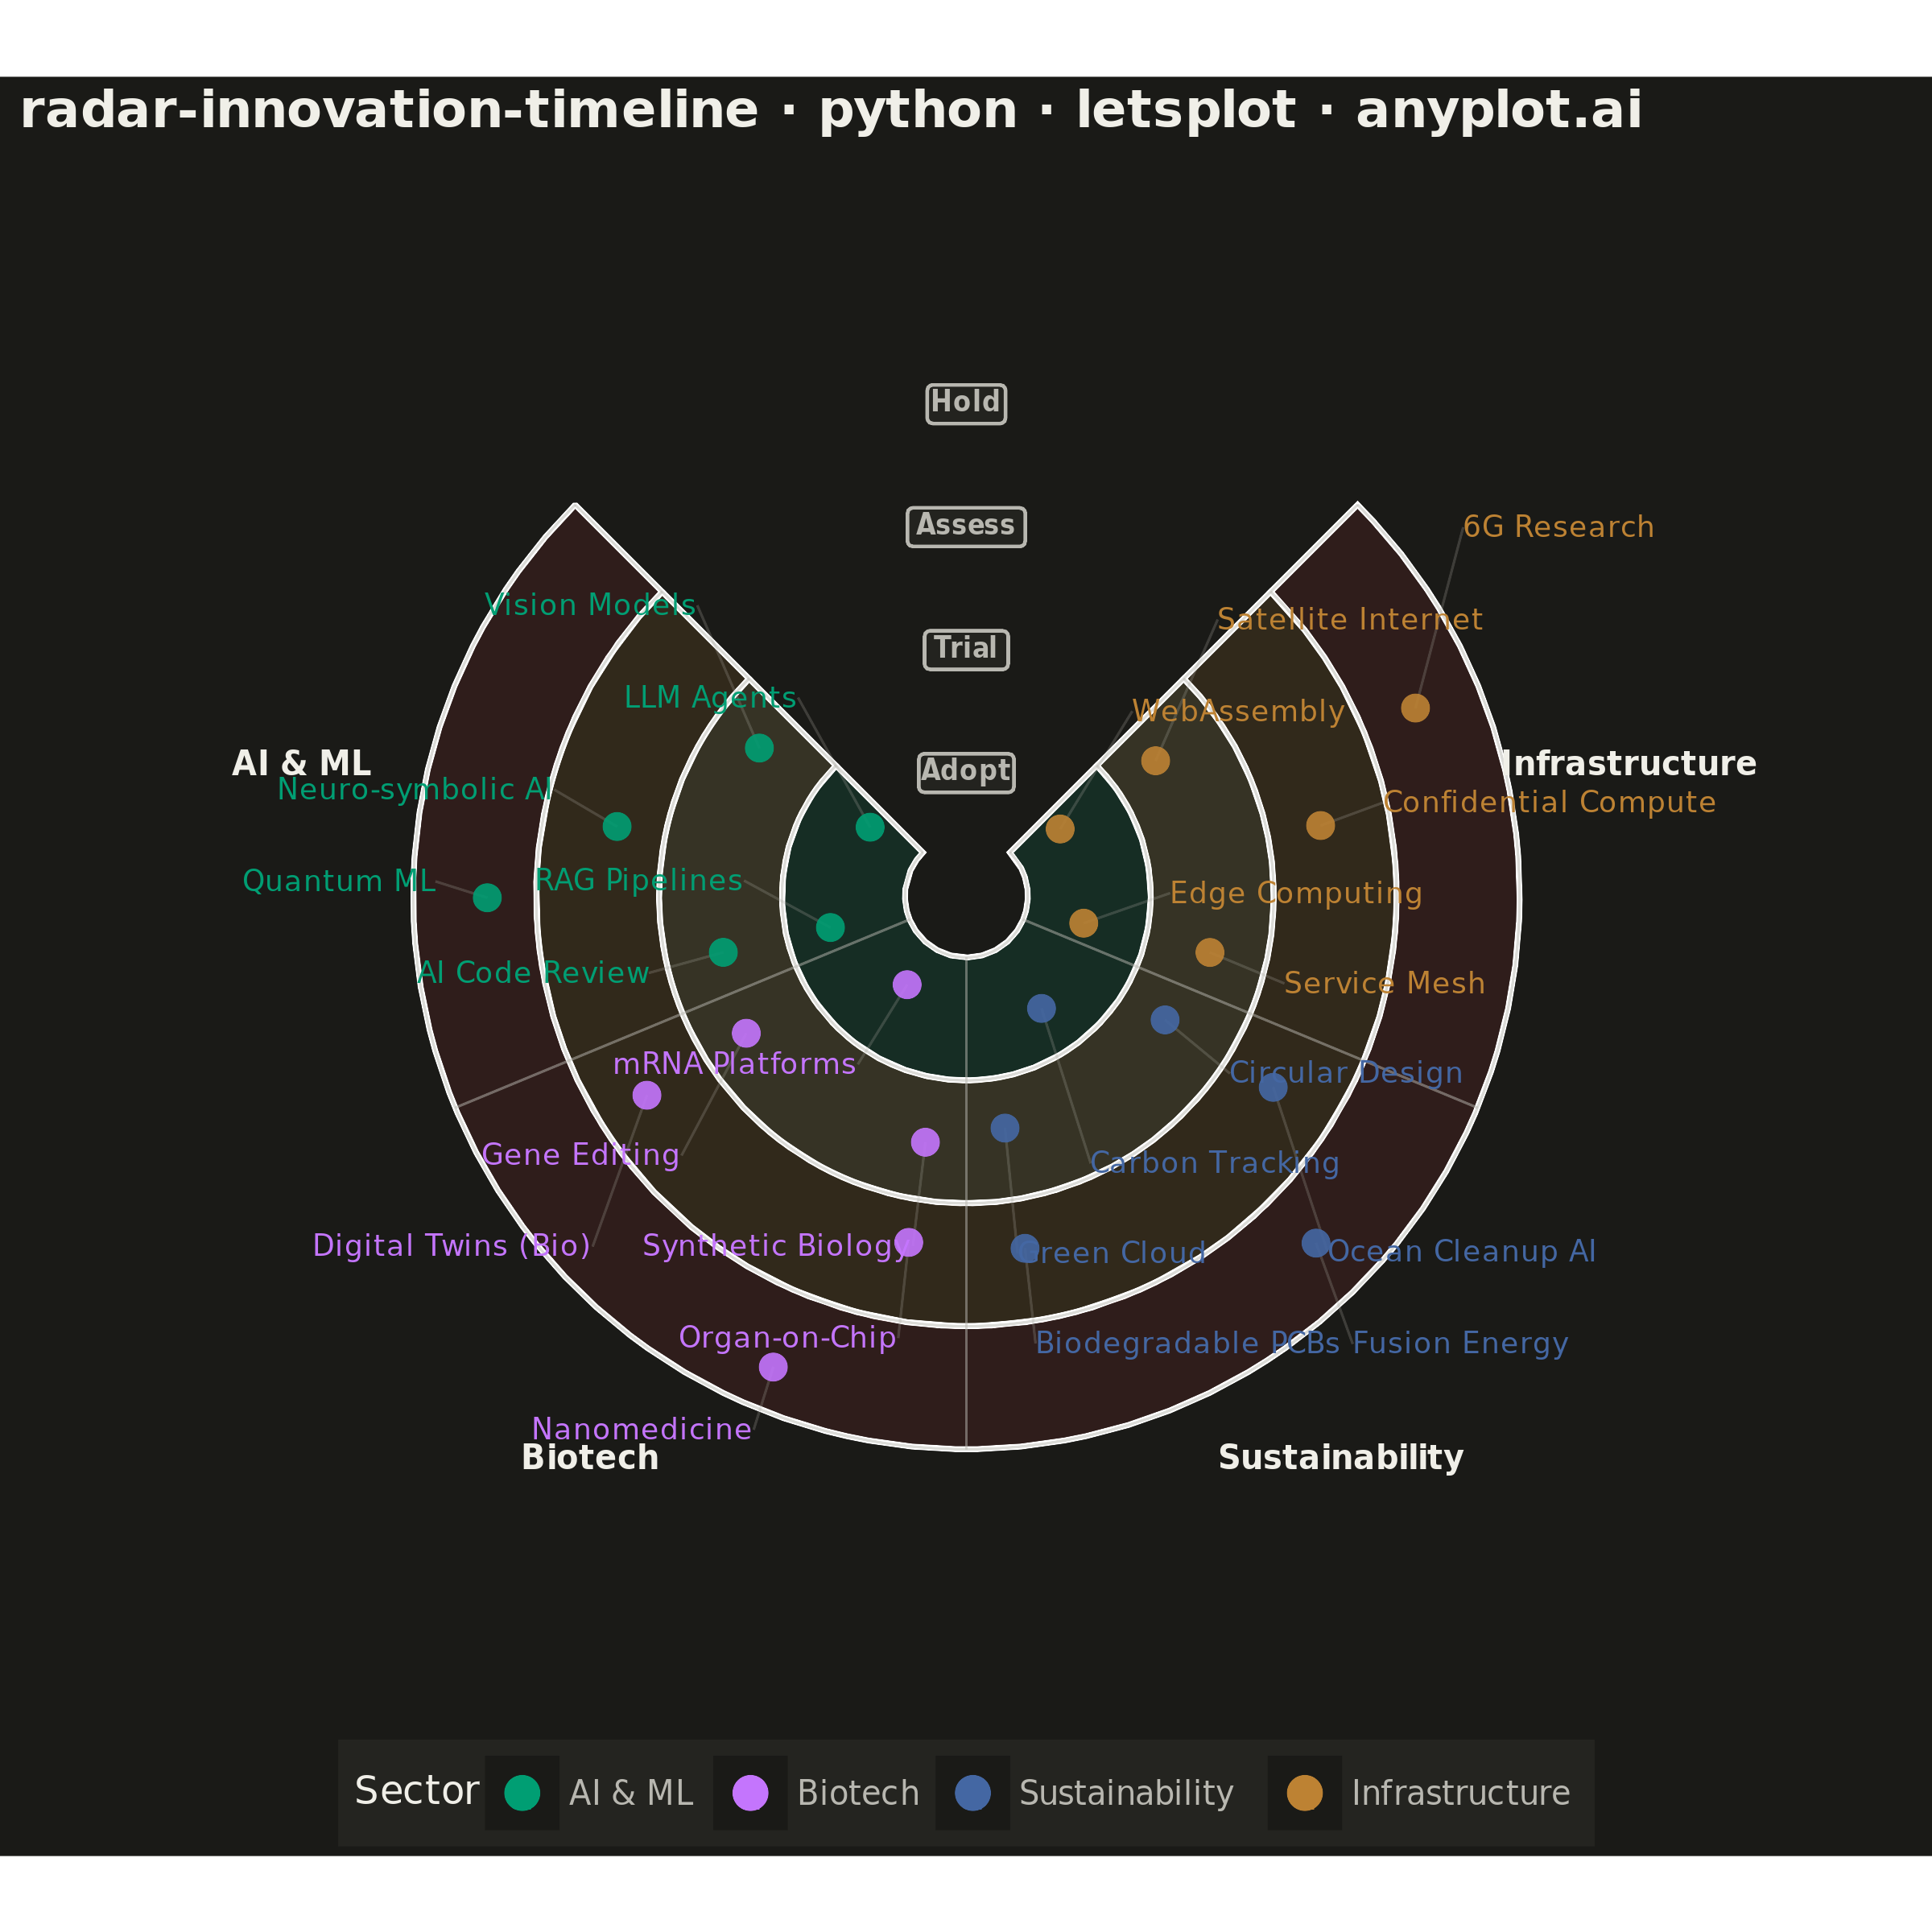
A radial chart that maps innovations, technologies, or trends onto concentric rings representing time horizons and angular sectors representing thematic categories. Inner rings represent near-term items (e.g., "Now", "Next 6 months") while outer rings represent longer-term or emerging trends (e.g., "2-5 years", "Future"). Each item is placed as a labeled point within its sector and ring, with distinct markers or colors encoding categories. Inspired by ThoughtWorks Technology Radar and similar strategic planning visualizations.
""" anyplot.ai
radar-innovation-timeline: Innovation Radar with Time-Horizon Rings
Library: letsplot 4.10.1 | Python 3.13.13
Quality: 85/100 | Updated: 2026-05-29
"""

import math
import os

import numpy as np
import pandas as pd
from lets_plot import (
    LetsPlot,
    aes,
    coord_fixed,
    element_blank,
    element_rect,
    element_text,
    geom_label,
    geom_path,
    geom_point,
    geom_polygon,
    geom_segment,
    geom_text,
    ggplot,
    ggsave,
    ggsize,
    labs,
    layer_tooltips,
    scale_color_manual,
    scale_x_continuous,
    scale_y_continuous,
    theme,
    theme_void,
)


LetsPlot.setup_html()

# Theme tokens — Imprint palette + theme-adaptive chrome
THEME = os.getenv("ANYPLOT_THEME", "light")
PAGE_BG = "#FAF8F1" if THEME == "light" else "#1A1A17"
ELEVATED_BG = "#FFFDF6" if THEME == "light" else "#242420"
INK = "#1A1A17" if THEME == "light" else "#F0EFE8"
INK_SOFT = "#4A4A44" if THEME == "light" else "#B8B7B0"
INK_MUTED = "#6B6A63" if THEME == "light" else "#A8A79F"

# Imprint categorical palette — 8 hues, hybrid-v3 sort
IMPRINT_PALETTE = ["#009E73", "#C475FD", "#4467A3", "#BD8233", "#AE3030", "#2ABCCD", "#954477", "#99B314"]

np.random.seed(42)

# --- Data ---
rings = ["Adopt", "Trial", "Assess", "Hold"]
# Sector order chosen to separate heavy-label sectors (AI & ML, Infrastructure) across the arc
sectors = ["AI & ML", "Biotech", "Sustainability", "Infrastructure"]

# Sector colors: Imprint palette positions 1–4 in canonical order
sector_colors = {
    "AI & ML": IMPRINT_PALETTE[0],  # #009E73 brand green
    "Biotech": IMPRINT_PALETTE[1],  # #C475FD lavender
    "Sustainability": IMPRINT_PALETTE[2],  # #4467A3 blue
    "Infrastructure": IMPRINT_PALETTE[3],  # #BD8233 ochre
}

# Ring fills: semantic green→amber→ochre→red gradient communicates adoption readiness
if THEME == "light":
    ring_fills = {"Adopt": "#DCEDC8", "Trial": "#FFF9C4", "Assess": "#FFE0B2", "Hold": "#FFCDD2"}
    ring_alpha = 0.55
else:
    # Imprint-derived tints at low alpha for dark background
    ring_fills = {"Adopt": "#009E73", "Trial": "#DDCC77", "Assess": "#BD8233", "Hold": "#AE3030"}
    ring_alpha = 0.14

ring_inner = {"Adopt": 0.5, "Trial": 1.5, "Assess": 2.5, "Hold": 3.5}
ring_outer = {"Adopt": 1.5, "Trial": 2.5, "Assess": 3.5, "Hold": 4.5}
# Angular nudge for Hold ring items to prevent overlap with sector header labels
ring_nudge = {"Adopt": 0.0, "Trial": 0.0, "Assess": 0.0, "Hold": 0.20}

# 270-degree arc (gap at top for ring labels)
ARC_START = math.pi * 3 / 4
ARC_SPAN = math.pi * 3 / 2
ARC_END = ARC_START + ARC_SPAN
SECTOR_SPAN = ARC_SPAN / len(sectors)

innovations = [
    {"name": "LLM Agents", "ring": "Adopt", "sector": "AI & ML"},
    {"name": "RAG Pipelines", "ring": "Adopt", "sector": "AI & ML"},
    {"name": "Vision Models", "ring": "Trial", "sector": "AI & ML"},
    {"name": "AI Code Review", "ring": "Trial", "sector": "AI & ML"},
    {"name": "Neuro-symbolic AI", "ring": "Assess", "sector": "AI & ML"},
    {"name": "Quantum ML", "ring": "Hold", "sector": "AI & ML"},
    {"name": "mRNA Platforms", "ring": "Adopt", "sector": "Biotech"},
    {"name": "Gene Editing", "ring": "Trial", "sector": "Biotech"},
    {"name": "Synthetic Biology", "ring": "Trial", "sector": "Biotech"},
    {"name": "Digital Twins (Bio)", "ring": "Assess", "sector": "Biotech"},
    {"name": "Organ-on-Chip", "ring": "Assess", "sector": "Biotech"},
    {"name": "Nanomedicine", "ring": "Hold", "sector": "Biotech"},
    {"name": "Carbon Tracking", "ring": "Adopt", "sector": "Sustainability"},
    {"name": "Green Cloud", "ring": "Trial", "sector": "Sustainability"},
    {"name": "Circular Design", "ring": "Trial", "sector": "Sustainability"},
    {"name": "Biodegradable PCBs", "ring": "Assess", "sector": "Sustainability"},
    {"name": "Ocean Cleanup AI", "ring": "Assess", "sector": "Sustainability"},
    {"name": "Fusion Energy", "ring": "Hold", "sector": "Sustainability"},
    {"name": "Edge Computing", "ring": "Adopt", "sector": "Infrastructure"},
    {"name": "WebAssembly", "ring": "Adopt", "sector": "Infrastructure"},
    {"name": "Service Mesh", "ring": "Trial", "sector": "Infrastructure"},
    {"name": "Satellite Internet", "ring": "Trial", "sector": "Infrastructure"},
    {"name": "Confidential Compute", "ring": "Assess", "sector": "Infrastructure"},
    {"name": "6G Research", "ring": "Hold", "sector": "Infrastructure"},
]

# --- Compute positions ---
df = pd.DataFrame(innovations)
sector_idx_map = {s: i for i, s in enumerate(sectors)}
ring_mid_map = {r: (ring_inner[r] + ring_outer[r]) / 2 for r in rings}

# Vectorized angular placement per sector/ring group
angles = np.zeros(len(df))
for (sector, ring), group in df.groupby(["sector", "ring"], sort=False):
    center = ARC_START + sector_idx_map[sector] * SECTOR_SPAN + SECTOR_SPAN / 2
    n = len(group)
    spread = SECTOR_SPAN * 0.72
    offsets = np.linspace(-spread / 2, spread / 2, n) if n > 1 else np.array([0.0])
    angles[group.index] = center + offsets + ring_nudge[ring]

df["angle"] = angles
df["radius"] = df["ring"].map(ring_mid_map) + np.random.uniform(-0.15, 0.15, len(df))
df["x"] = df["radius"] * np.cos(df["angle"])
df["y"] = df["radius"] * np.sin(df["angle"])

# Label positions: pushed radially outward
label_offsets = {"Adopt": 0.72, "Trial": 0.62, "Assess": 0.52, "Hold": 0.42}
df["label_r"] = df["radius"] + df["ring"].map(label_offsets)
df["lx"] = df["label_r"] * np.cos(df["angle"])
df["ly"] = df["label_r"] * np.sin(df["angle"])
df["side"] = np.where(df["lx"] < 0, "left", "right")

# Label repulsion: push overlapping labels apart vertically on each side
MIN_Y_SEP = 0.75
for _ in range(35):
    for side in ["left", "right"]:
        side_idx = df.loc[df["side"] == side].sort_values("ly").index.tolist()
        for k in range(len(side_idx) - 1):
            i, j = side_idx[k], side_idx[k + 1]
            if abs(df.loc[j, "lx"] - df.loc[i, "lx"]) < 2.5:
                dy = df.loc[j, "ly"] - df.loc[i, "ly"]
                if dy < MIN_Y_SEP:
                    push = (MIN_Y_SEP - dy) / 2
                    df.loc[j, "ly"] += push
                    df.loc[i, "ly"] -= push

# --- Structural geometry ---
arc_pts = np.linspace(ARC_START, ARC_END, 120)

# Ring background polygons (annular sectors)
ring_bg_rows = []
for rname in rings:
    r_in, r_out = ring_inner[rname], ring_outer[rname]
    xs = np.concatenate([r_out * np.cos(arc_pts), r_in * np.cos(arc_pts[::-1])])
    ys = np.concatenate([r_out * np.sin(arc_pts), r_in * np.sin(arc_pts[::-1])])
    for px, py in zip(np.append(xs, xs[0]), np.append(ys, ys[0]), strict=True):
        ring_bg_rows.append({"x": px, "y": py, "ring": rname})
ring_bg_df = pd.DataFrame(ring_bg_rows)

# Ring boundary arcs
bnd_rows = []
for r in [0.5, 1.5, 2.5, 3.5, 4.5]:
    for idx, a in enumerate(arc_pts):
        bnd_rows.append({"x": r * math.cos(a), "y": r * math.sin(a), "g": f"r{r}", "o": idx})
bnd_df = pd.DataFrame(bnd_rows).sort_values(["g", "o"])

# Sector divider spokes
spoke_angles = [ARC_START + i * SECTOR_SPAN for i in range(len(sectors) + 1)]
spoke_df = pd.DataFrame(
    [
        {"x": 0.5 * math.cos(a), "y": 0.5 * math.sin(a), "xend": 4.5 * math.cos(a), "yend": 4.5 * math.sin(a)}
        for a in spoke_angles
    ]
)

# Sector header labels along outer edge
sector_label_df = pd.DataFrame(
    [
        {
            "label": s,
            "x": 5.5 * math.cos(ARC_START + (i + 0.5) * SECTOR_SPAN),
            "y": 5.5 * math.sin(ARC_START + (i + 0.5) * SECTOR_SPAN),
        }
        for i, s in enumerate(sectors)
    ]
)

# Ring name labels in arc gap (90 degrees = top center)
gap_angle = math.pi / 2
ring_label_df = pd.DataFrame(
    [
        {"label": r, "x": ring_mid_map[r] * math.cos(gap_angle), "y": ring_mid_map[r] * math.sin(gap_angle)}
        for r in rings
    ]
)

# --- Build plot ---
plot = ggplot()

# Ring background fills with semantic color gradient (green=safe → pink=risky)
for rname in rings:
    rdata = ring_bg_df[ring_bg_df["ring"] == rname]
    plot += geom_polygon(aes("x", "y"), data=rdata, fill=ring_fills[rname], alpha=ring_alpha)

# Structural lines: ring boundaries and sector spokes
plot += geom_path(aes("x", "y", group="g"), data=bnd_df, color=INK_SOFT, size=0.3, alpha=0.5)
plot += geom_segment(aes(x="x", y="y", xend="xend", yend="yend"), data=spoke_df, color=INK_SOFT, size=0.3, alpha=0.5)

# Sector header labels
plot += geom_text(aes("x", "y", label="label"), data=sector_label_df, size=5, color=INK, fontface="bold")

# Ring labels with background box (geom_label for visual clarity over ring fills)
plot += geom_label(
    aes("x", "y", label="label"),
    data=ring_label_df,
    size=4,
    color=INK_SOFT,
    fontface="bold",
    fill=ELEVATED_BG,
    alpha=0.9,
)

# Thin connector lines from points to labels (aids readability after repulsion)
plot += geom_segment(aes(x="x", y="y", xend="lx", yend="ly"), data=df, size=0.3, alpha=0.25, color=INK_MUTED)

# Innovation points with interactive tooltips (letsplot-specific for HTML export)
plot += geom_point(
    aes("x", "y", color="sector"),
    data=df,
    size=4,
    alpha=0.9,
    tooltips=layer_tooltips().line("@name").line("Ring: @ring").line("Sector: @sector"),
)

# Innovation labels split by side for outward text alignment
for side, hj in [("left", 1), ("right", 0)]:
    side_df = df[df["side"] == side]
    plot += geom_text(aes("lx", "ly", label="name", color="sector"), data=side_df, size=4.5, hjust=hj)

title = "radar-innovation-timeline · python · letsplot · anyplot.ai"

# Styling — theme_void() removes all axis/grid defaults; custom theme restores chrome
plot += (
    theme_void()
    + scale_color_manual(values=sector_colors)
    + scale_x_continuous(limits=(-7.0, 7.0))
    + scale_y_continuous(limits=(-6.2, 5.5))
    + coord_fixed()
    + labs(title=title, color="Sector")
    + ggsize(600, 600)
    + theme(
        plot_title=element_text(size=16, color=INK, face="bold"),
        legend_title=element_text(size=12, color=INK),
        legend_text=element_text(size=10, color=INK_SOFT),
        legend_position="bottom",
        axis_title=element_blank(),
        axis_text=element_blank(),
        axis_ticks=element_blank(),
        axis_line=element_blank(),
        panel_grid=element_blank(),
        plot_background=element_rect(fill=PAGE_BG, color=PAGE_BG),
        panel_background=element_rect(fill=PAGE_BG, color=PAGE_BG),
        legend_background=element_rect(fill=ELEVATED_BG, color=INK_SOFT),
    )
)

# Save PNG (scale=4 → 2400×2400 px) and interactive HTML
ggsave(plot, f"plot-{THEME}.png", path=".", scale=4)
ggsave(plot, f"plot-{THEME}.html", path=".")
Runnable source as JSON, for any HTTP client: https://api.anyplot.ai/specs/radar-innovation-timeline/letsplot/code. Any spec id and library id listed in llms-full.txt fit the same URL shape; every URL below is complete and callable.
{
  "spec_id": "radar-innovation-timeline",
  "language": "python",
  "library": "letsplot",
  "page": "https://anyplot.ai/radar-innovation-timeline/python/letsplot",
  "hub": "https://anyplot.ai/radar-innovation-timeline",
  "code_json": "https://api.anyplot.ai/specs/radar-innovation-timeline/letsplot/code",
  "spec_json": "https://api.anyplot.ai/specs/radar-innovation-timeline",
  "render_light_png": "https://storage.googleapis.com/anyplot-images/plots/radar-innovation-timeline/python/letsplot/plot-light.png",
  "render_dark_png": "https://storage.googleapis.com/anyplot-images/plots/radar-innovation-timeline/python/letsplot/plot-dark.png",
  "interactive_light_html": "https://storage.googleapis.com/anyplot-images/plots/radar-innovation-timeline/python/letsplot/plot-light.html",
  "interactive_dark_html": "https://storage.googleapis.com/anyplot-images/plots/radar-innovation-timeline/python/letsplot/plot-dark.html",
  "quality_score": 85.0,
  "license": "MIT",
  "guide": "https://anyplot.ai/llms.txt"
}
Part of Innovation Radar with Time-Horizon Rings on anyplot.ai.