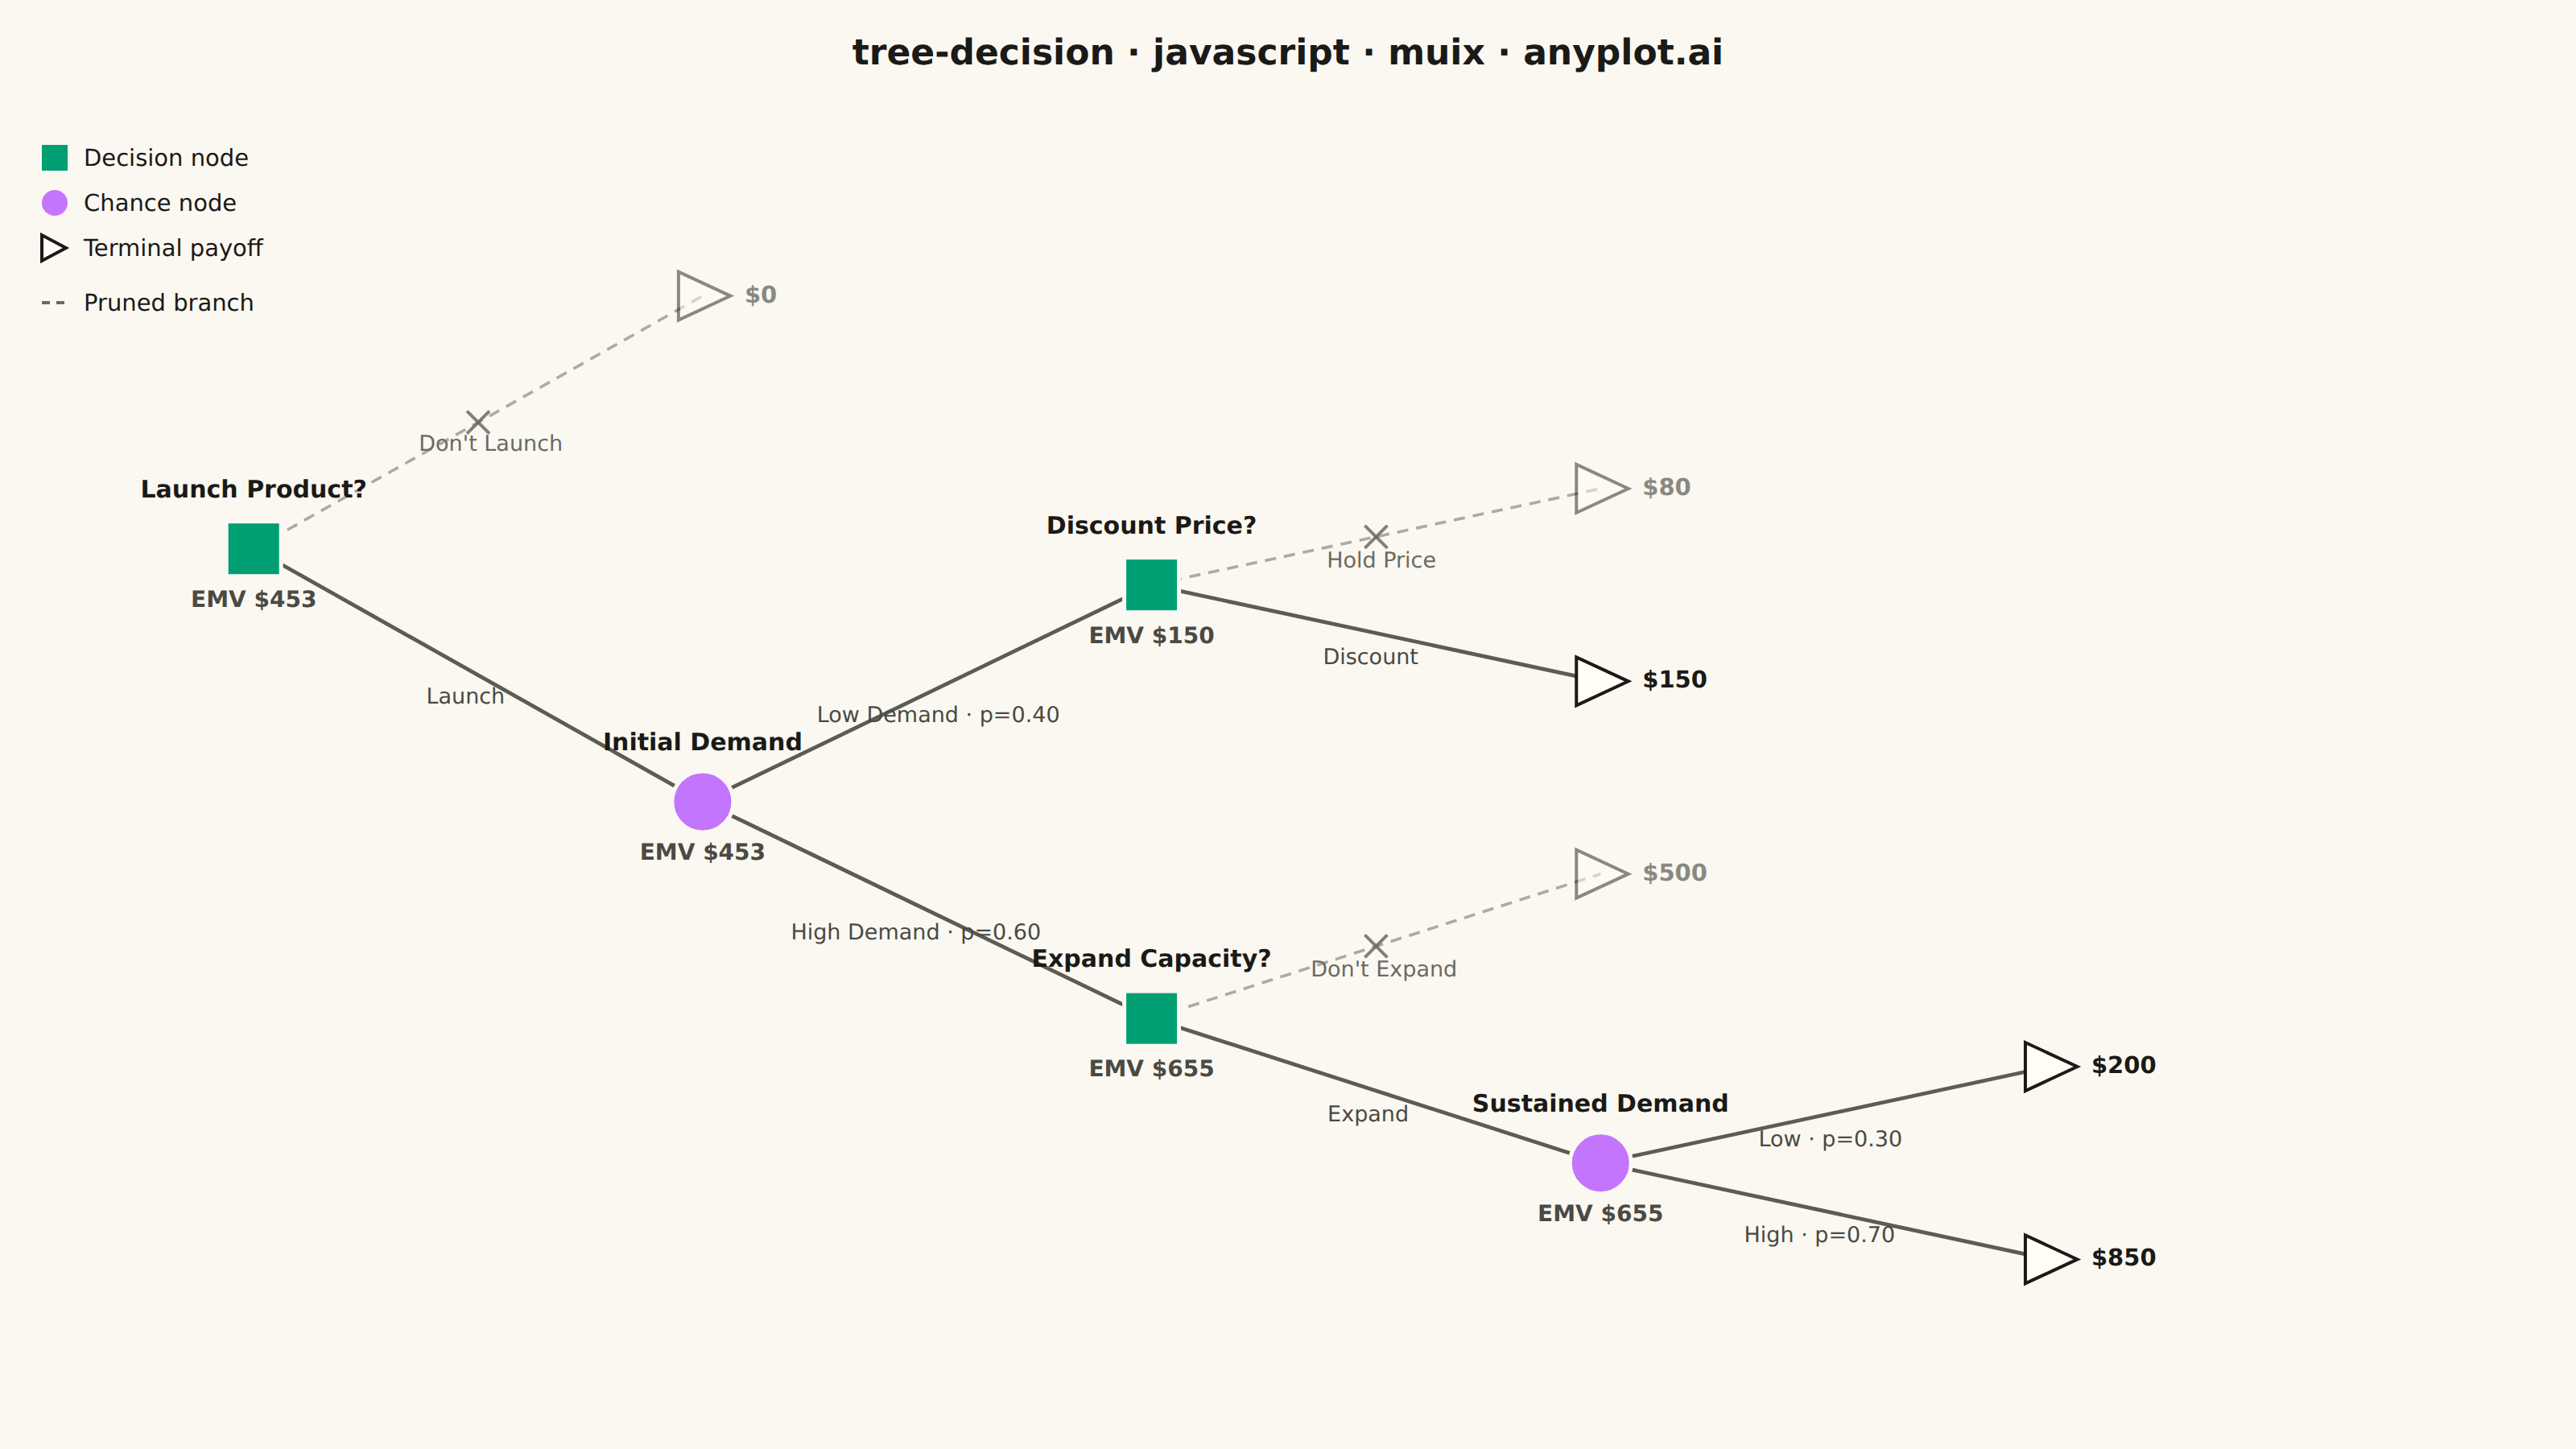
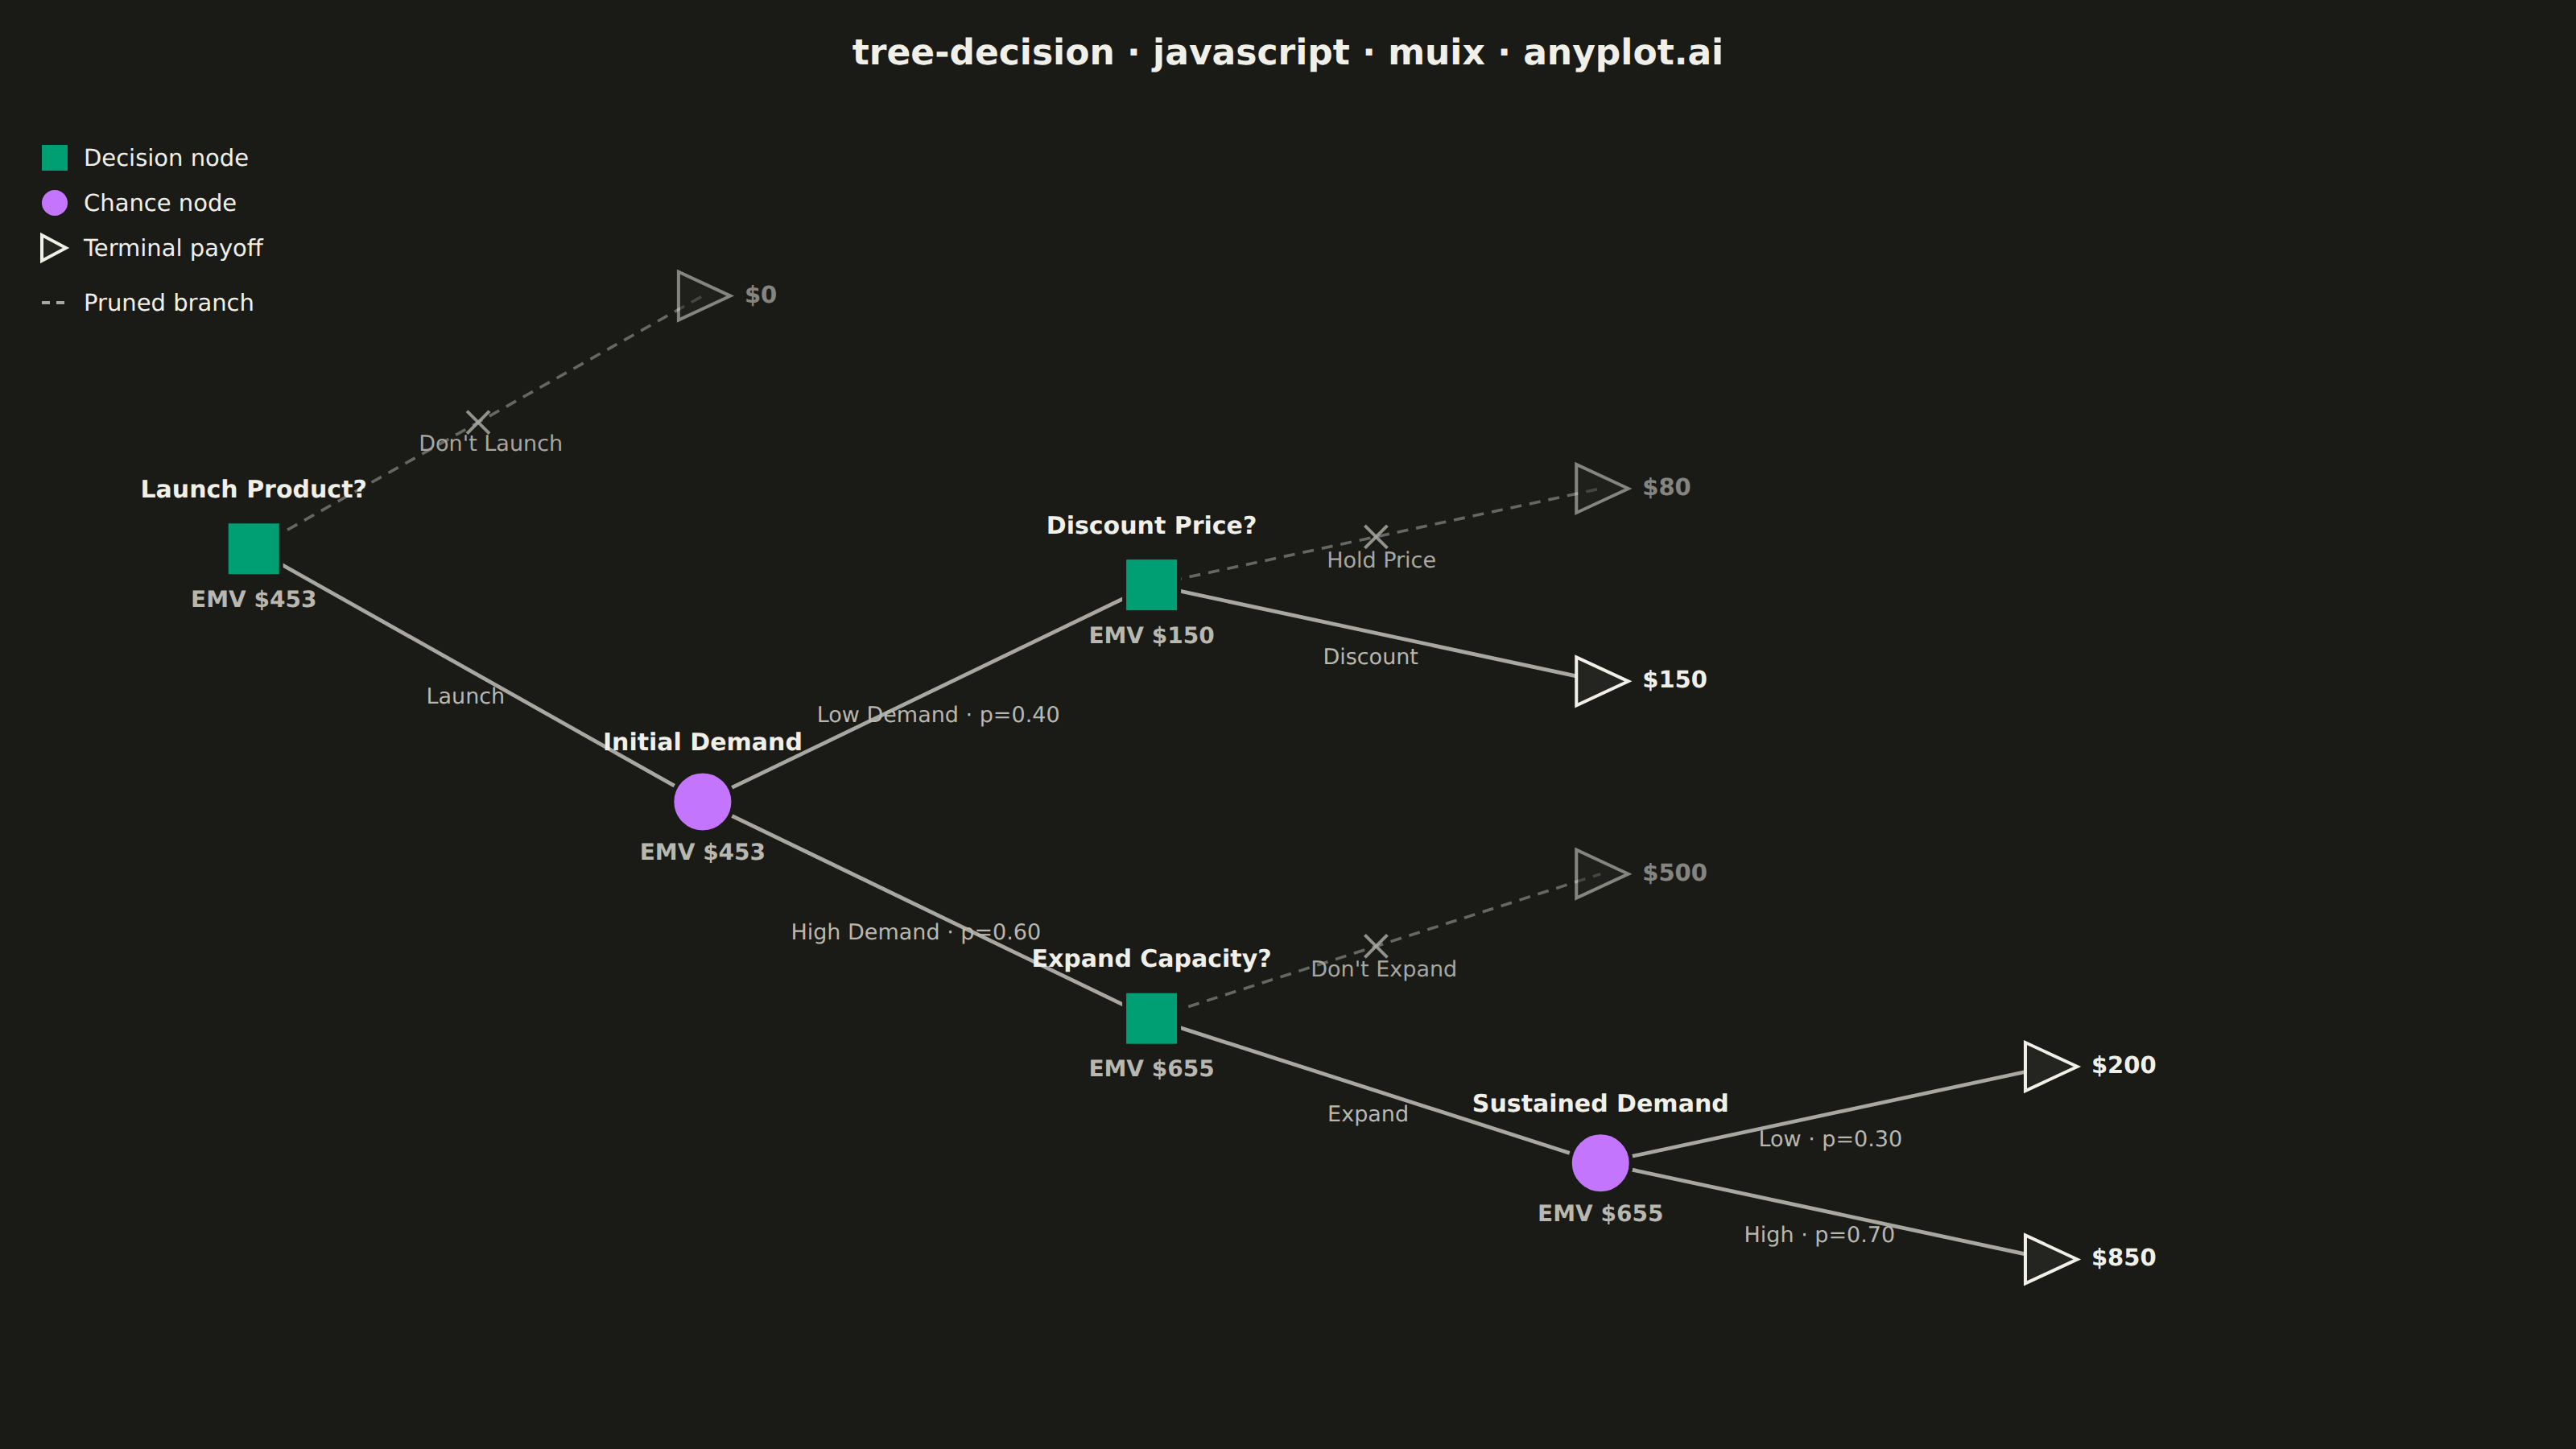
A tree-structured diagram for sequential decision analysis, displaying decision nodes (squares), chance nodes (circles), and terminal outcome nodes (triangles) connected by branching paths. Each chance branch is labeled with probabilities, terminal nodes show payoff values, and Expected Monetary Values (EMV) are calculated via rollback at each node. Rejected (pruned) branches are visually marked, making it easy to trace the optimal decision path through a multi-stage problem.
Preview render from the MUI X Charts implementation.