The same plot in 14 other libraries — Python: Altair, Bokeh, lets-plot, Matplotlib, Plotly, plotnine, Pygal, Seaborn; R: ggplot2; JavaScript: Chart.js, D3.js, Apache ECharts, Highcharts, MUI X Charts. Compare all 15 side by side: Decision Tree Visualization with Probabilities in Python, R, Julia and JavaScript.
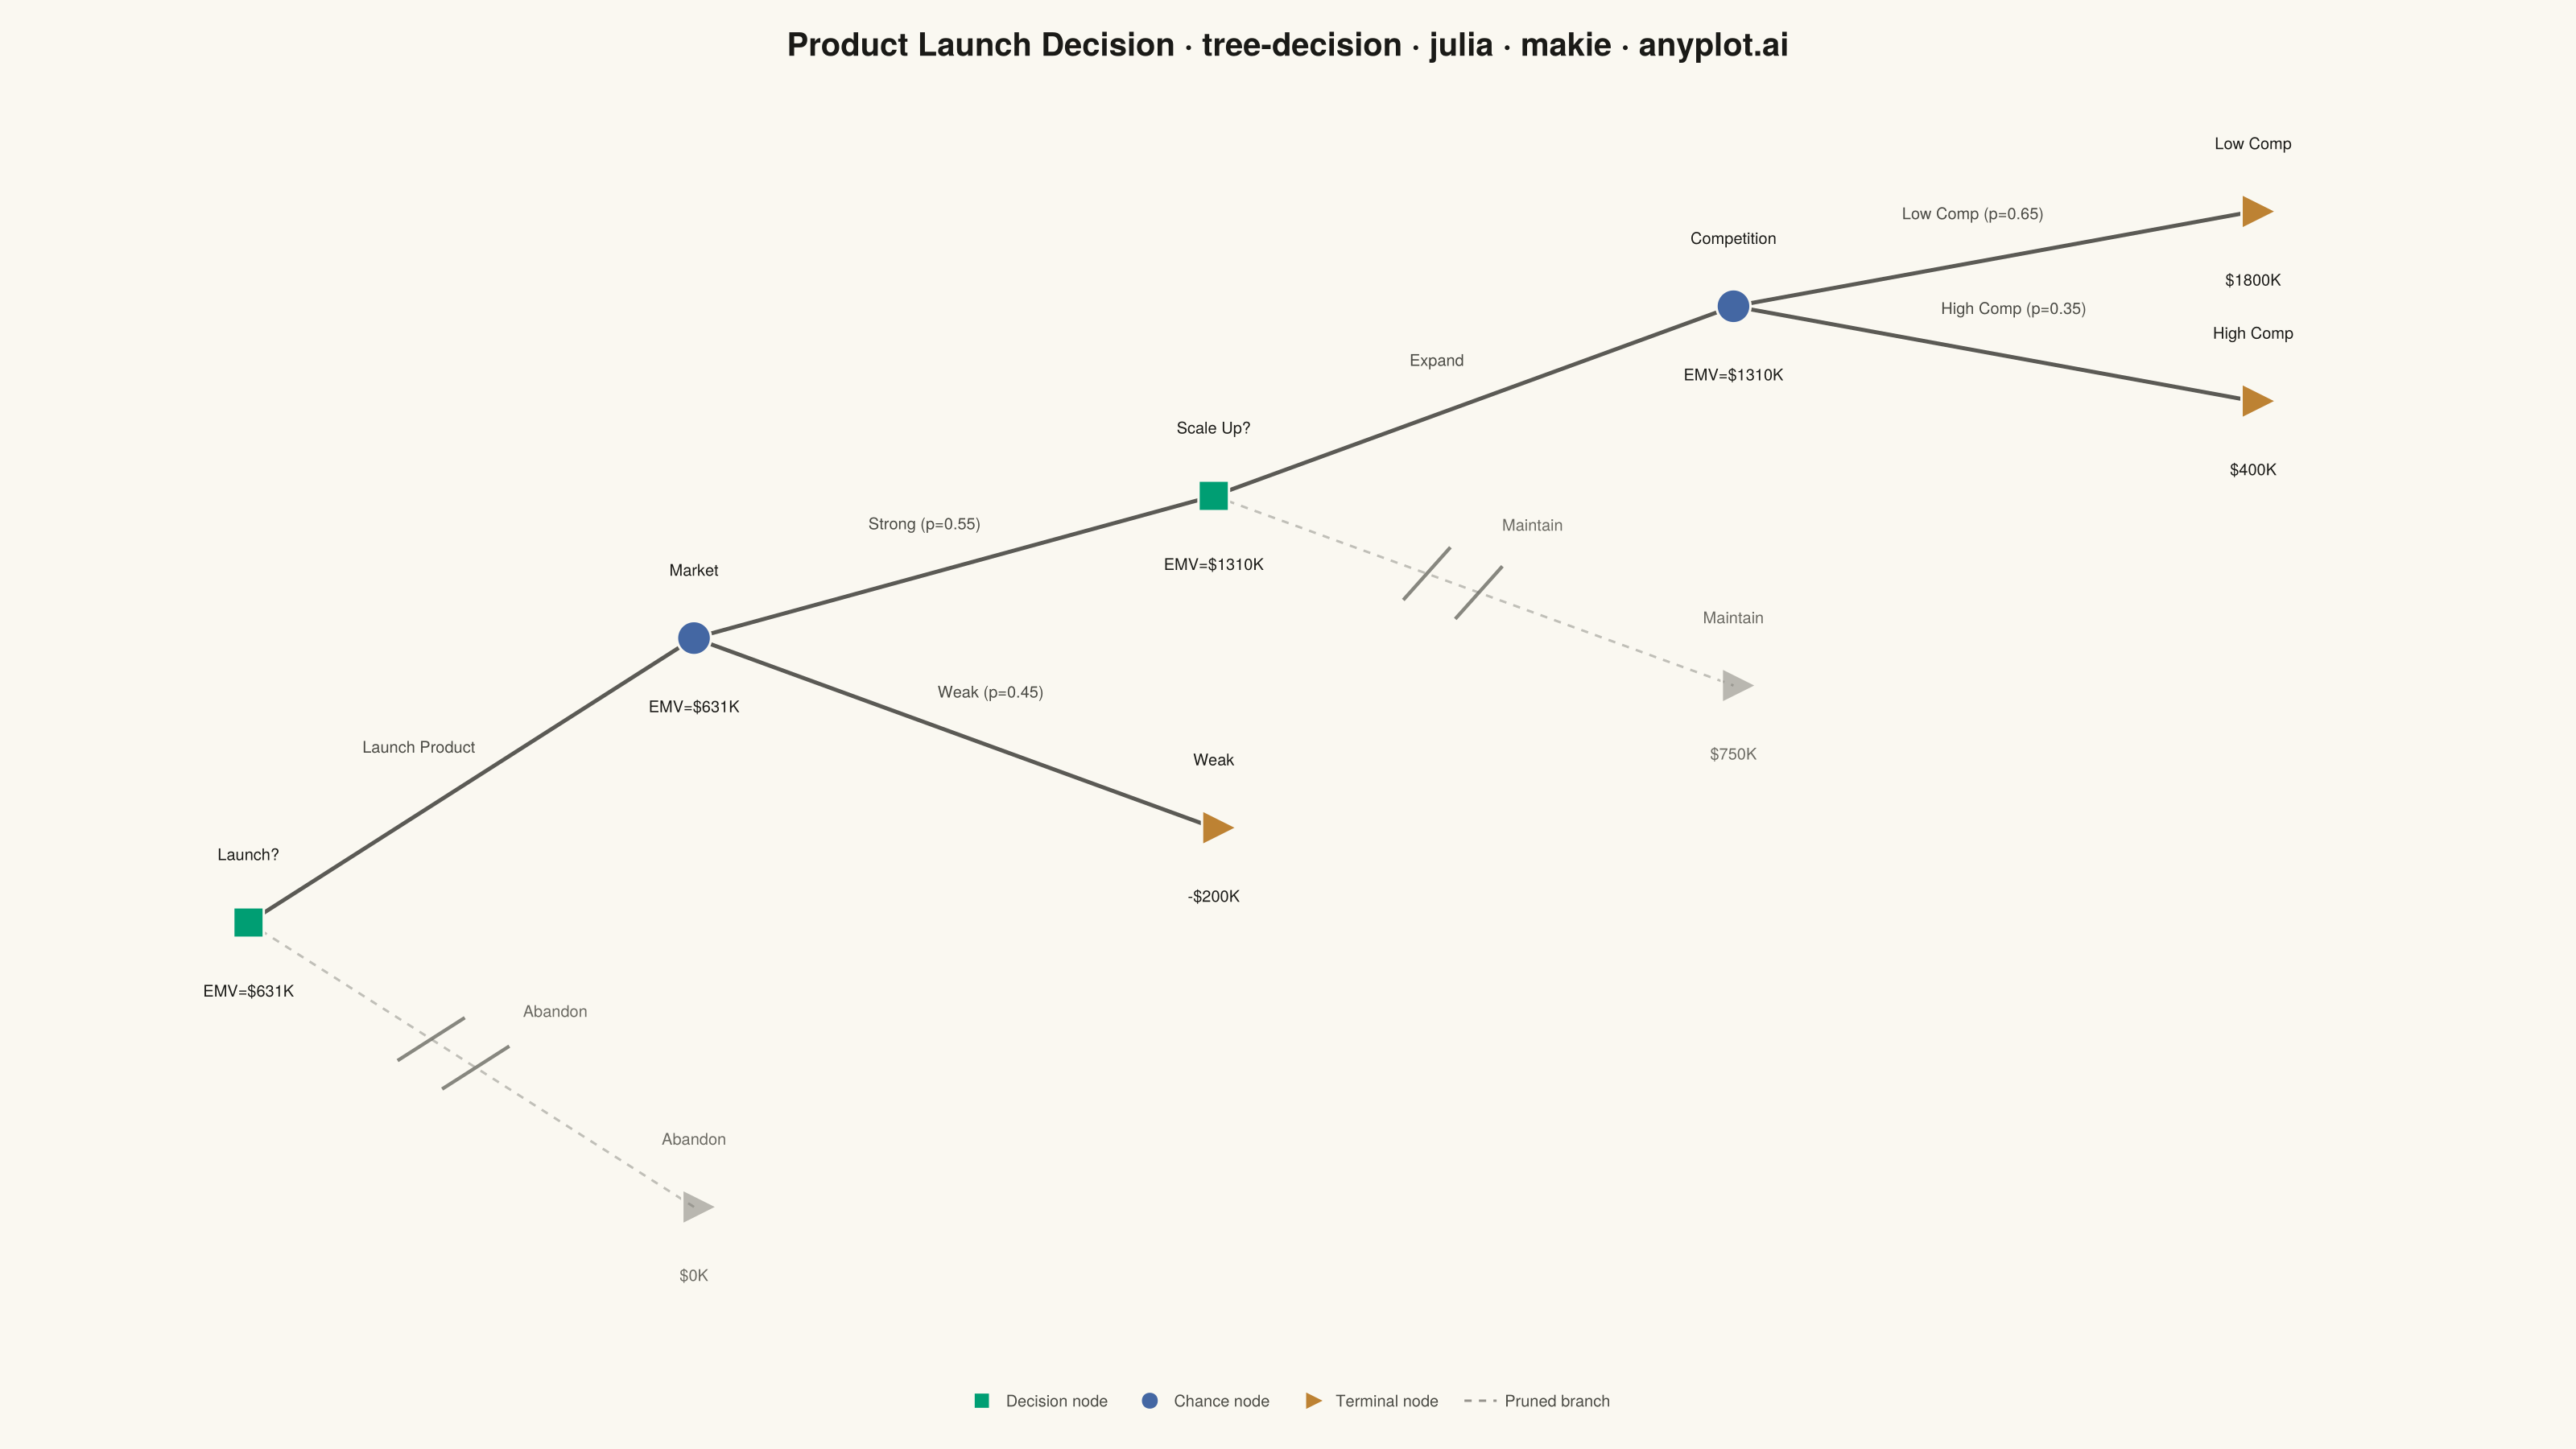
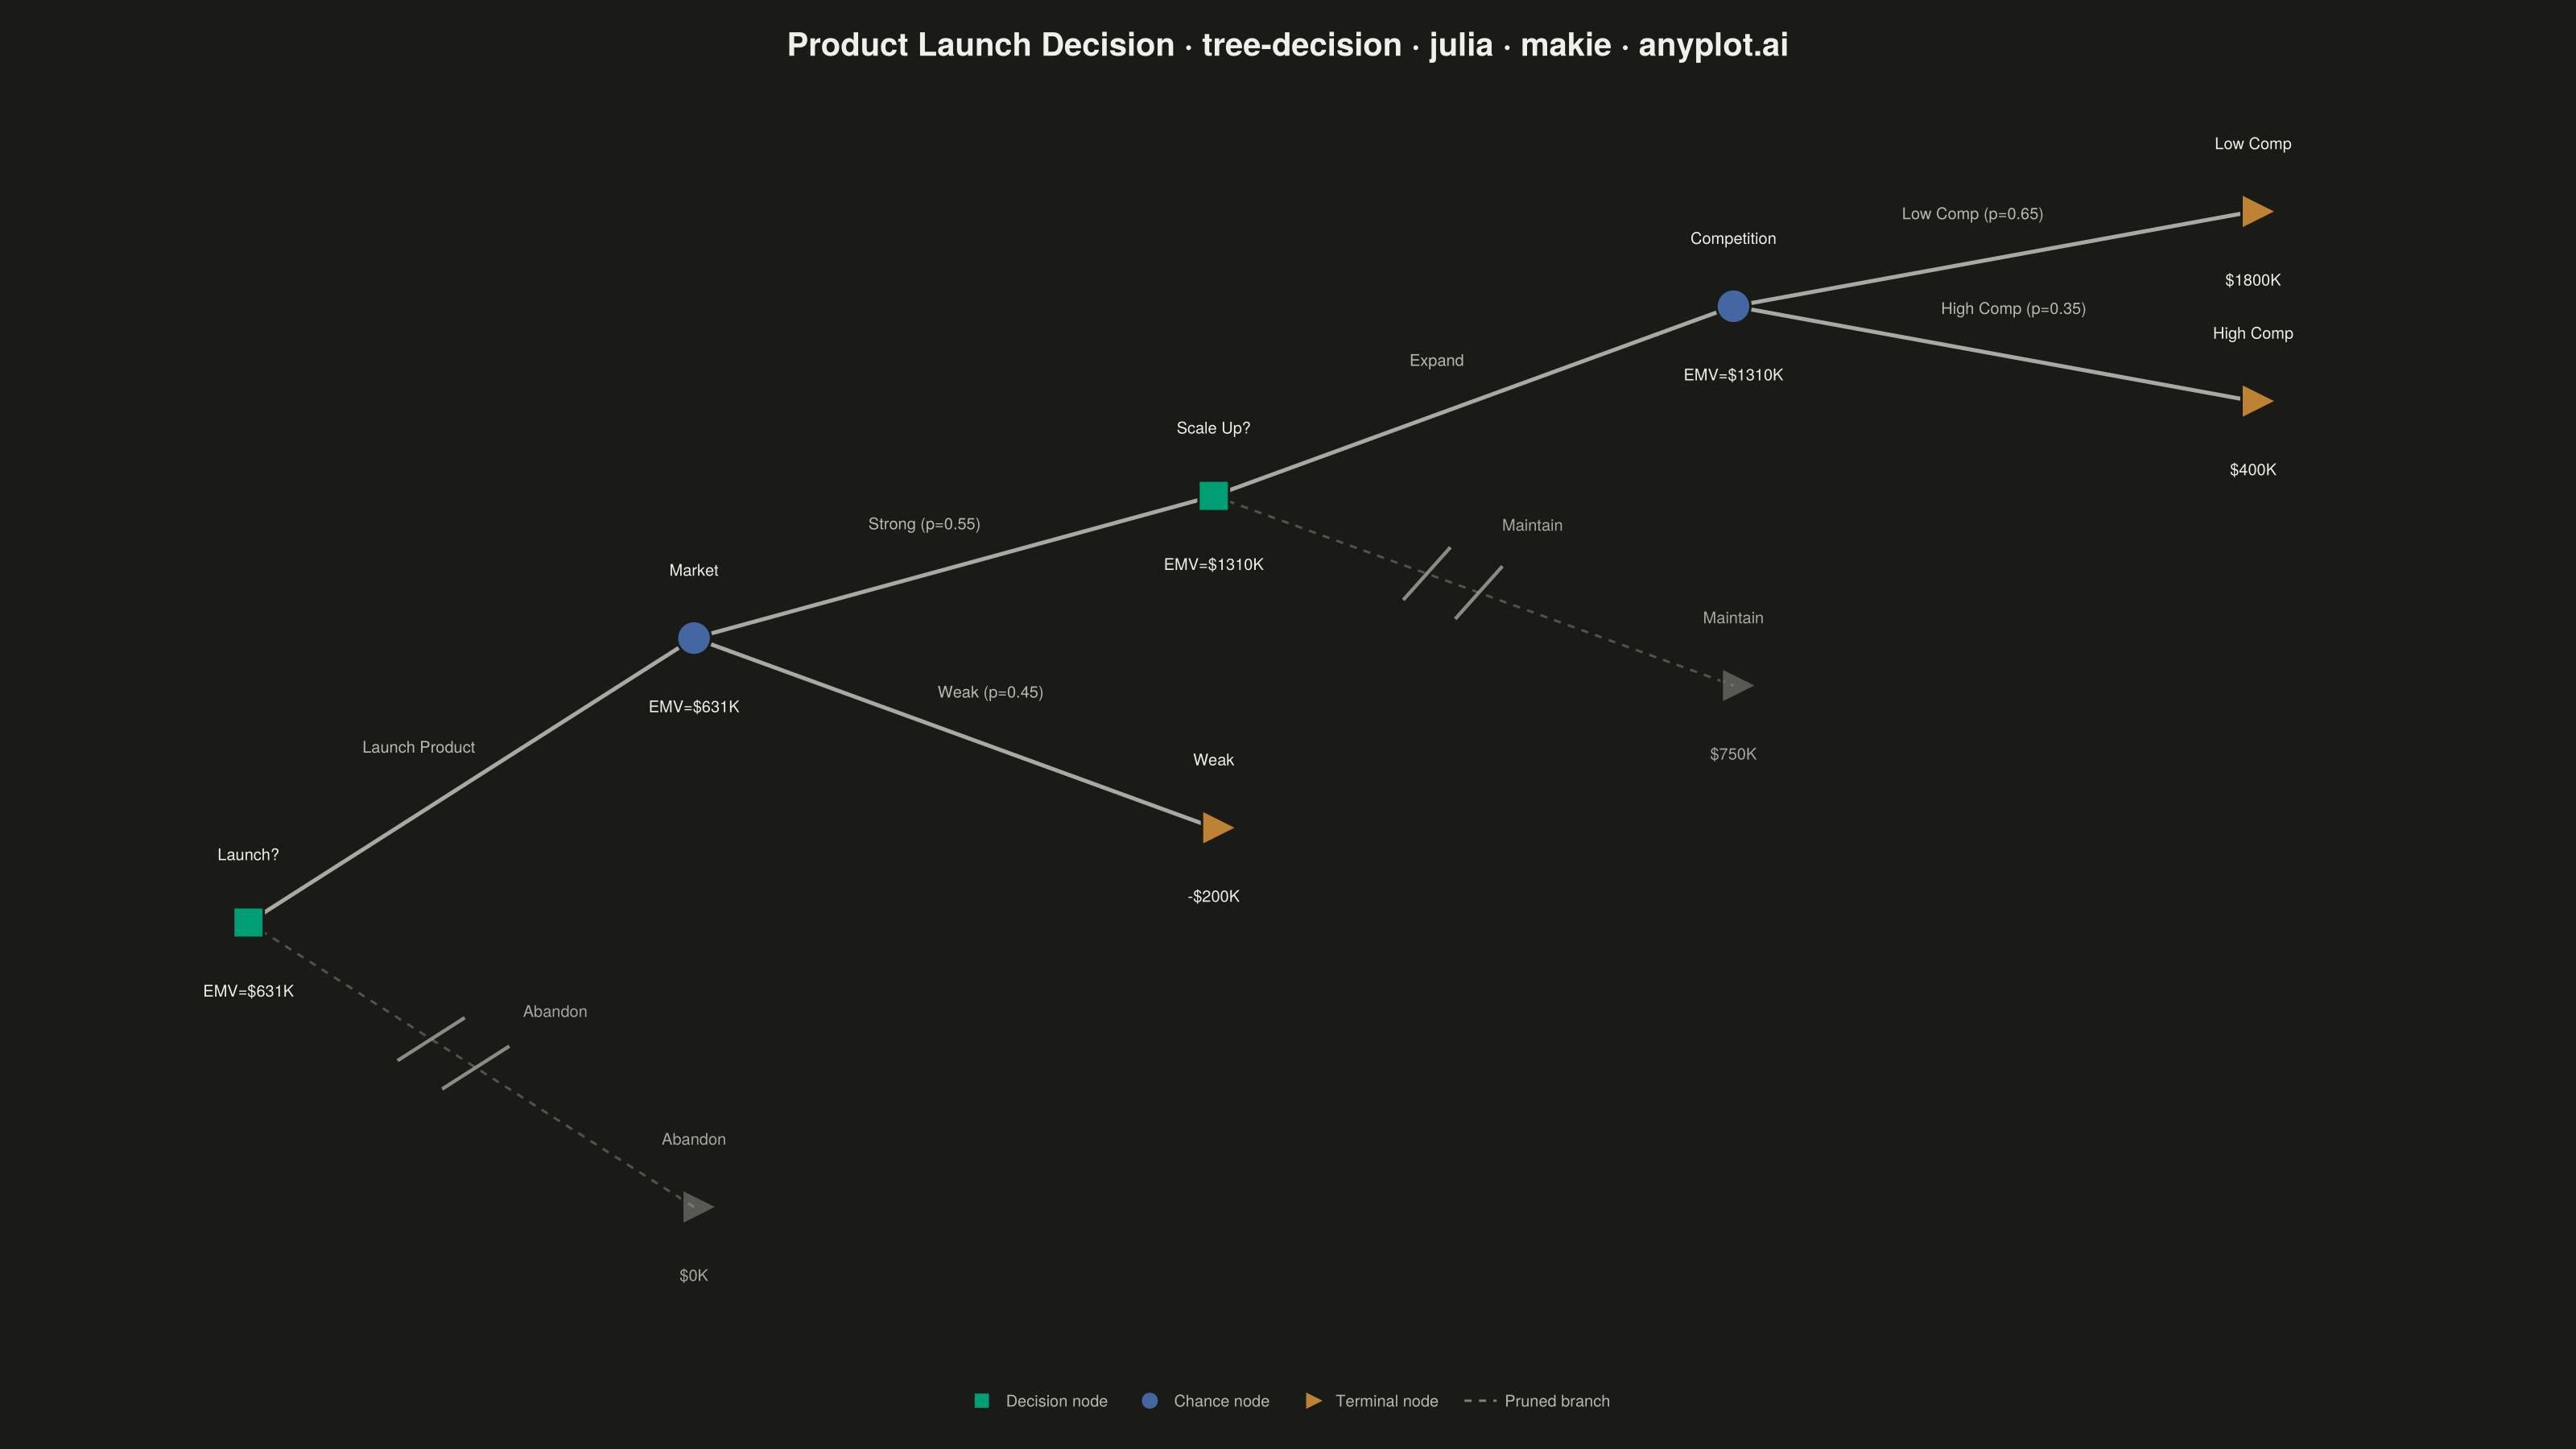
A tree-structured diagram for sequential decision analysis, displaying decision nodes (squares), chance nodes (circles), and terminal outcome nodes (triangles) connected by branching paths. Each chance branch is labeled with probabilities, terminal nodes show payoff values, and Expected Monetary Values (EMV) are calculated via rollback at each node. Rejected (pruned) branches are visually marked, making it easy to trace the optimal decision path through a multi-stage problem.
# anyplot.ai
# tree-decision: Decision Tree Visualization with Probabilities
# Library: makie 0.22.10 | Julia 1.11.9
# Quality: 85/100 | Created: 2026-06-02

using CairoMakie
using Colors
using Random

Random.seed!(42)

# Theme tokens
const THEME       = get(ENV, "ANYPLOT_THEME", "light")
const PAGE_BG     = THEME == "light" ? colorant"#FAF8F1" : colorant"#1A1A17"
const ELEVATED_BG = THEME == "light" ? colorant"#FFFDF6" : colorant"#242420"
const INK         = THEME == "light" ? colorant"#1A1A17" : colorant"#F0EFE8"
const INK_SOFT    = THEME == "light" ? colorant"#4A4A44" : colorant"#B8B7B0"
const INK_MUTED   = THEME == "light" ? colorant"#6B6A63" : colorant"#A8A79F"

const IMPRINT_PALETTE = [
    colorant"#009E73",
    colorant"#C475FD",
    colorant"#4467A3",
    colorant"#BD8233",
    colorant"#AE3030",
    colorant"#2ABCCD",
    colorant"#954477",
    colorant"#99B314",
]

const COL_DECISION = IMPRINT_PALETTE[1]  # brand green — decision nodes
const COL_CHANCE   = IMPRINT_PALETTE[3]  # blue         — chance nodes
const COL_TERMINAL = IMPRINT_PALETTE[4]  # ochre        — terminal nodes

# Data: software company product-launch decision tree
# Stage 1: Launch (D1) vs Abandon (T1)
# Stage 2 (after strong market): Expand (D2→C2) vs Maintain (T4)
# Rollback:
#   EMV(C2)  = 0.65×1800 + 0.35×400  = 1310
#   EMV(D2)  = max(1310, 750) = 1310  → Expand wins, Maintain pruned
#   EMV(C1)  = 0.55×1310 + 0.45×(−200) = 631
#   EMV(D1)  = max(631, 0) = 631      → Launch wins, Abandon pruned

const node_ids    = ["D1",       "T1",       "C1",     "T5",      "D2",       "T4",       "C2",          "T2",      "T3"]
const node_types  = [:decision,  :terminal,  :chance,  :terminal, :decision,  :terminal,  :chance,       :terminal, :terminal]
const node_xs     = [0.0,        3.0,        3.0,      6.5,       6.5,        10.0,       10.0,          13.5,      13.5]
const node_ys     = [1.5,       -1.5,        4.5,      2.5,       6.0,         4.0,        8.0,           9.0,       7.0]
const node_emvs   = [631.0,      0.0,      631.0,    -200.0,   1310.0,       750.0,     1310.0,        1800.0,    400.0]
const node_pruned = [false,      true,     false,     false,    false,        true,      false,         false,     false]
const node_names  = ["Launch?",  "Abandon", "Market", "Weak",   "Scale Up?", "Maintain", "Competition", "Low Comp","High Comp"]

const edge_froms  = ["D1",     "D1",              "C1",             "C1",               "D2",       "D2",    "C2",                "C2"]
const edge_tos    = ["T1",     "C1",              "T5",             "D2",               "T4",       "C2",    "T2",                "T3"]
const edge_labels = ["Abandon","Launch Product",  "Weak (p=0.45)",  "Strong (p=0.55)", "Maintain", "Expand","Low Comp (p=0.65)", "High Comp (p=0.35)"]
const edge_pruned = [true,     false,             false,            false,              true,       false,   false,               false]

const pos_lookup = Dict{String,Tuple{Float64,Float64}}(
    node_ids[i] => (node_xs[i], node_ys[i]) for i in eachindex(node_ids)
)

# Title — scale fontsize linearly when title exceeds 67-char baseline
title_str = "Product Launch Decision · tree-decision · julia · makie · anyplot.ai"
n_chars   = length(title_str)
title_sz  = max(13, round(Int, 20 * min(1.0, 67.0 / n_chars)))

# Figure — landscape 3200×1800 px (size 1600×900 × px_per_unit 2)
fig = Figure(
    size            = (1600, 900),
    fontsize        = 11,
    backgroundcolor = PAGE_BG,
)

ax = Axis(
    fig[1, 1];
    backgroundcolor    = PAGE_BG,
    title              = title_str,
    titlesize          = title_sz,
    titlecolor         = INK,
    topspinevisible    = false,
    rightspinevisible  = false,
    leftspinevisible   = false,
    bottomspinevisible = false,
    xgridvisible       = false,
    ygridvisible       = false,
    xticksvisible      = false,
    yticksvisible      = false,
    xticklabelsvisible = false,
    yticklabelsvisible = false,
)

xlims!(ax, -1.5, 15.5)
ylims!(ax, -3.0, 10.5)

# Draw edges (rendered before nodes so markers sit on top)
for i in eachindex(edge_froms)
    x1, y1 = pos_lookup[edge_froms[i]]
    x2, y2 = pos_lookup[edge_tos[i]]
    is_pr  = edge_pruned[i]
    dx     = x2 - x1
    dy     = y2 - y1
    elen   = sqrt(dx^2 + dy^2)

    ec  = is_pr ? RGBAf(INK_MUTED.r, INK_MUTED.g, INK_MUTED.b, 0.4f0) :
                  RGBAf(INK_SOFT.r,  INK_SOFT.g,  INK_SOFT.b,  0.9f0)
    lw  = is_pr ? 1.5 : 2.5
    lst = is_pr ? :dash : :solid

    lines!(ax, [x1, x2], [y1, y2]; color = ec, linewidth = lw, linestyle = lst)

    # Double-slash pruning marks (two perpendicular strokes across the edge)
    if is_pr
        nx_ = (-dy / elen) * 0.32
        ny_ = (dx  / elen) * 0.32
        pc  = RGBAf(INK_MUTED.r, INK_MUTED.g, INK_MUTED.b, 0.8f0)
        for frac in (0.41, 0.51)
            ox = x1 + dx * frac
            oy = y1 + dy * frac
            lines!(ax, [ox - nx_, ox + nx_], [oy - ny_, oy + ny_];
                   color = pc, linewidth = 2.2)
        end
    end

    # Branch label offset perpendicular to edge (counter-clockwise normal)
    # Pruned-edge labels use a larger offset to avoid collision with double-slash marks
    mx     = (x1 + x2) / 2
    my     = (y1 + y2) / 2
    off    = is_pr ? 0.8 : 0.5
    nx_off = (-dy / elen) * off
    ny_off = (dx  / elen) * off
    lc     = is_pr ? INK_MUTED : INK_SOFT
    text!(ax, mx + nx_off, my + ny_off;
          text = edge_labels[i], color = lc, fontsize = 10, align = (:center, :center))
end

# Draw nodes
for i in eachindex(node_ids)
    x      = node_xs[i]
    y      = node_ys[i]
    ntype  = node_types[i]
    emv    = node_emvs[i]
    pruned = node_pruned[i]
    name   = node_names[i]

    nc = if pruned
        RGBAf(INK_MUTED.r, INK_MUTED.g, INK_MUTED.b, 0.45f0)
    elseif ntype == :decision
        COL_DECISION
    elseif ntype == :chance
        COL_CHANCE
    else
        COL_TERMINAL
    end

    mk = ntype == :decision  ? :rect :
         ntype == :chance    ? :circle :
                               :rtriangle

    scatter!(ax, [x], [y];
             marker = mk, color = nc, markersize = 30,
             strokewidth = 1.5, strokecolor = PAGE_BG)

    lc = pruned ? INK_MUTED : INK

    # Short node name above the marker
    text!(ax, x, y + 0.62;
          text = name, color = lc, fontsize = 10, align = (:center, :bottom))

    # EMV (decision/chance) or payoff (terminal) below the marker
    emv_abs = abs(Int(round(emv)))
    emv_str = if ntype == :terminal
        emv >= 0 ? "\$$(emv_abs)K" : "-\$$(emv_abs)K"
    else
        emv >= 0 ? "EMV=\$$(emv_abs)K" : "EMV=-\$$(emv_abs)K"
    end
    text!(ax, x, y - 0.62;
          text = emv_str, color = lc, fontsize = 10, align = (:center, :top))
end

# Legend in bottom strip
leg_elems = [
    MarkerElement(marker = :rect,      color = COL_DECISION, strokewidth = 0, markersize = 14),
    MarkerElement(marker = :circle,    color = COL_CHANCE,   strokewidth = 0, markersize = 14),
    MarkerElement(marker = :rtriangle, color = COL_TERMINAL, strokewidth = 0, markersize = 14),
    LineElement(color = RGBAf(INK_MUTED.r, INK_MUTED.g, INK_MUTED.b, 0.7f0), linewidth = 1.5, linestyle = :dash),
]
leg_labels = ["Decision node", "Chance node", "Terminal node", "Pruned branch"]

Legend(
    fig[2, 1],
    leg_elems,
    leg_labels;
    orientation  = :horizontal,
    framevisible = false,
    labelcolor   = INK_SOFT,
    labelsize    = 10,
    padding      = (10f0, 10f0, 4f0, 4f0),
)
rowsize!(fig.layout, 2, Fixed(28))

save("plot-$(THEME).png", fig; px_per_unit = 2)
Runnable source as JSON, for any HTTP client: https://api.anyplot.ai/specs/tree-decision/makie/code. Any spec id and library id listed in llms-full.txt fit the same URL shape; every URL below is complete and callable.
{
  "spec_id": "tree-decision",
  "language": "julia",
  "library": "makie",
  "page": "https://anyplot.ai/tree-decision/julia/makie",
  "hub": "https://anyplot.ai/tree-decision",
  "code_json": "https://api.anyplot.ai/specs/tree-decision/makie/code",
  "spec_json": "https://api.anyplot.ai/specs/tree-decision",
  "render_light_png": "https://storage.googleapis.com/anyplot-images/plots/tree-decision/julia/makie/plot-light.png",
  "render_dark_png": "https://storage.googleapis.com/anyplot-images/plots/tree-decision/julia/makie/plot-dark.png",
  "quality_score": 85.0,
  "license": "MIT",
  "guide": "https://anyplot.ai/llms.txt"
}
Part of Decision Tree Visualization with Probabilities on anyplot.ai.