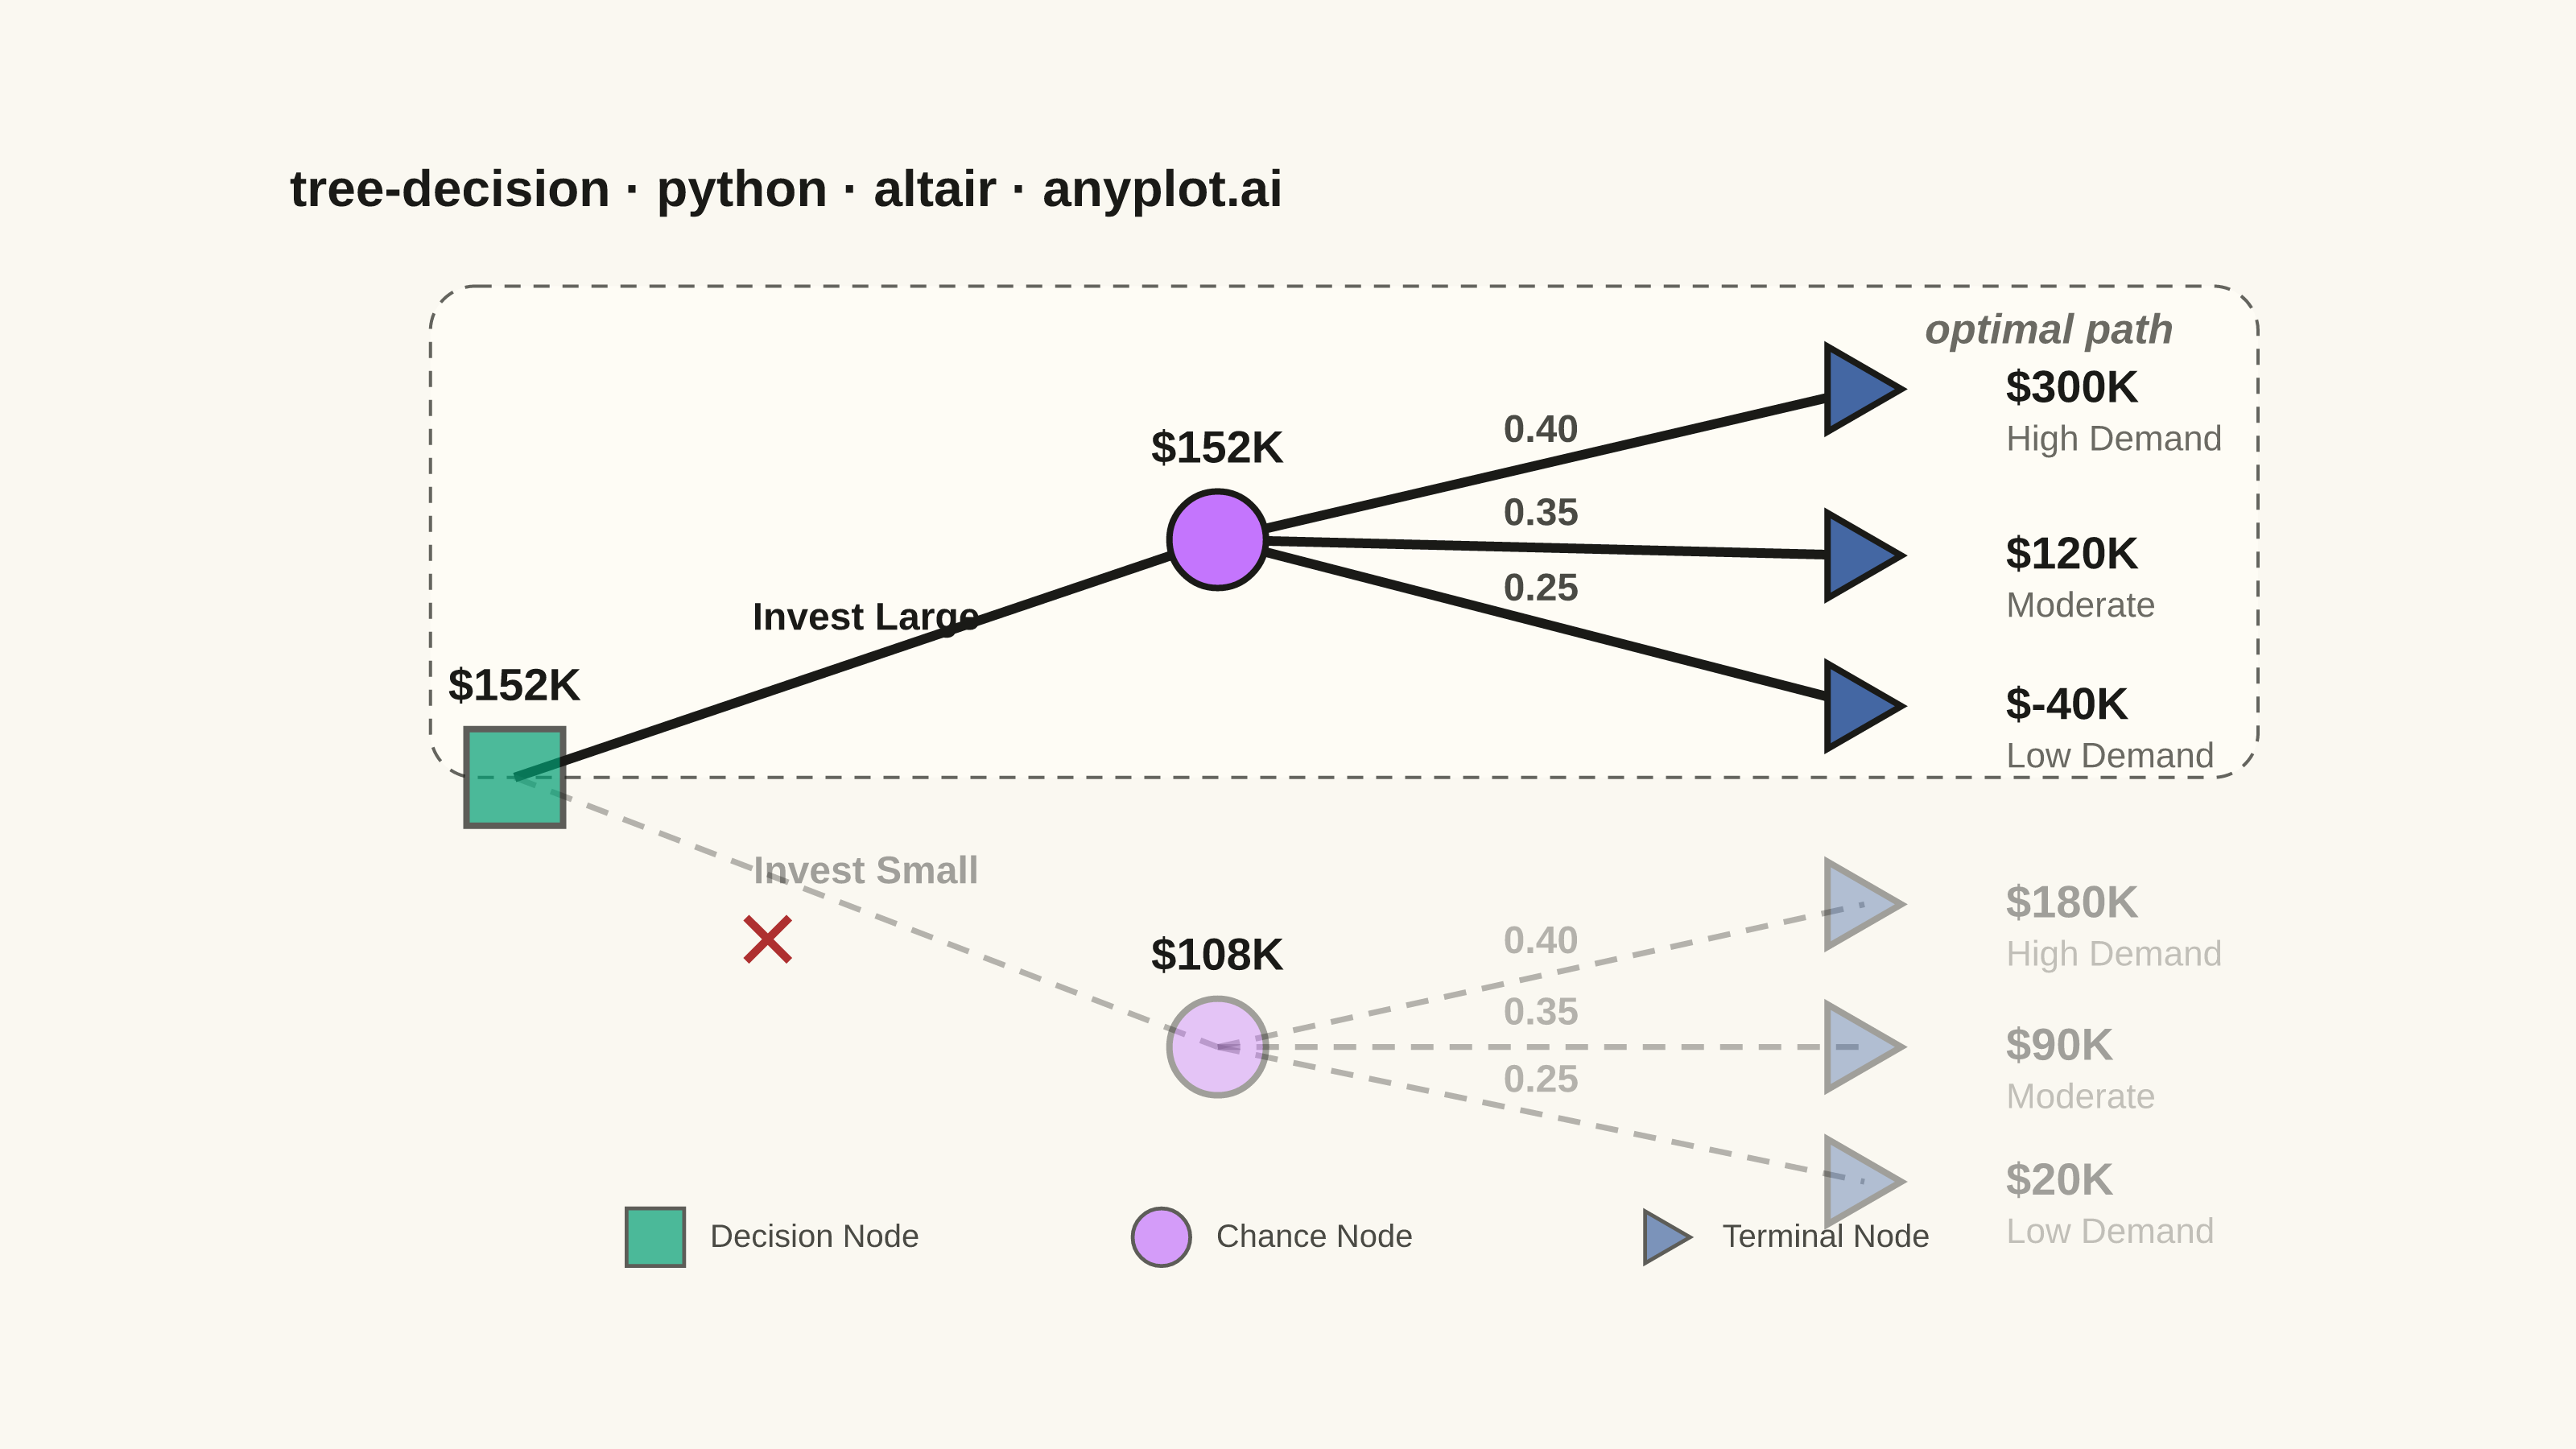
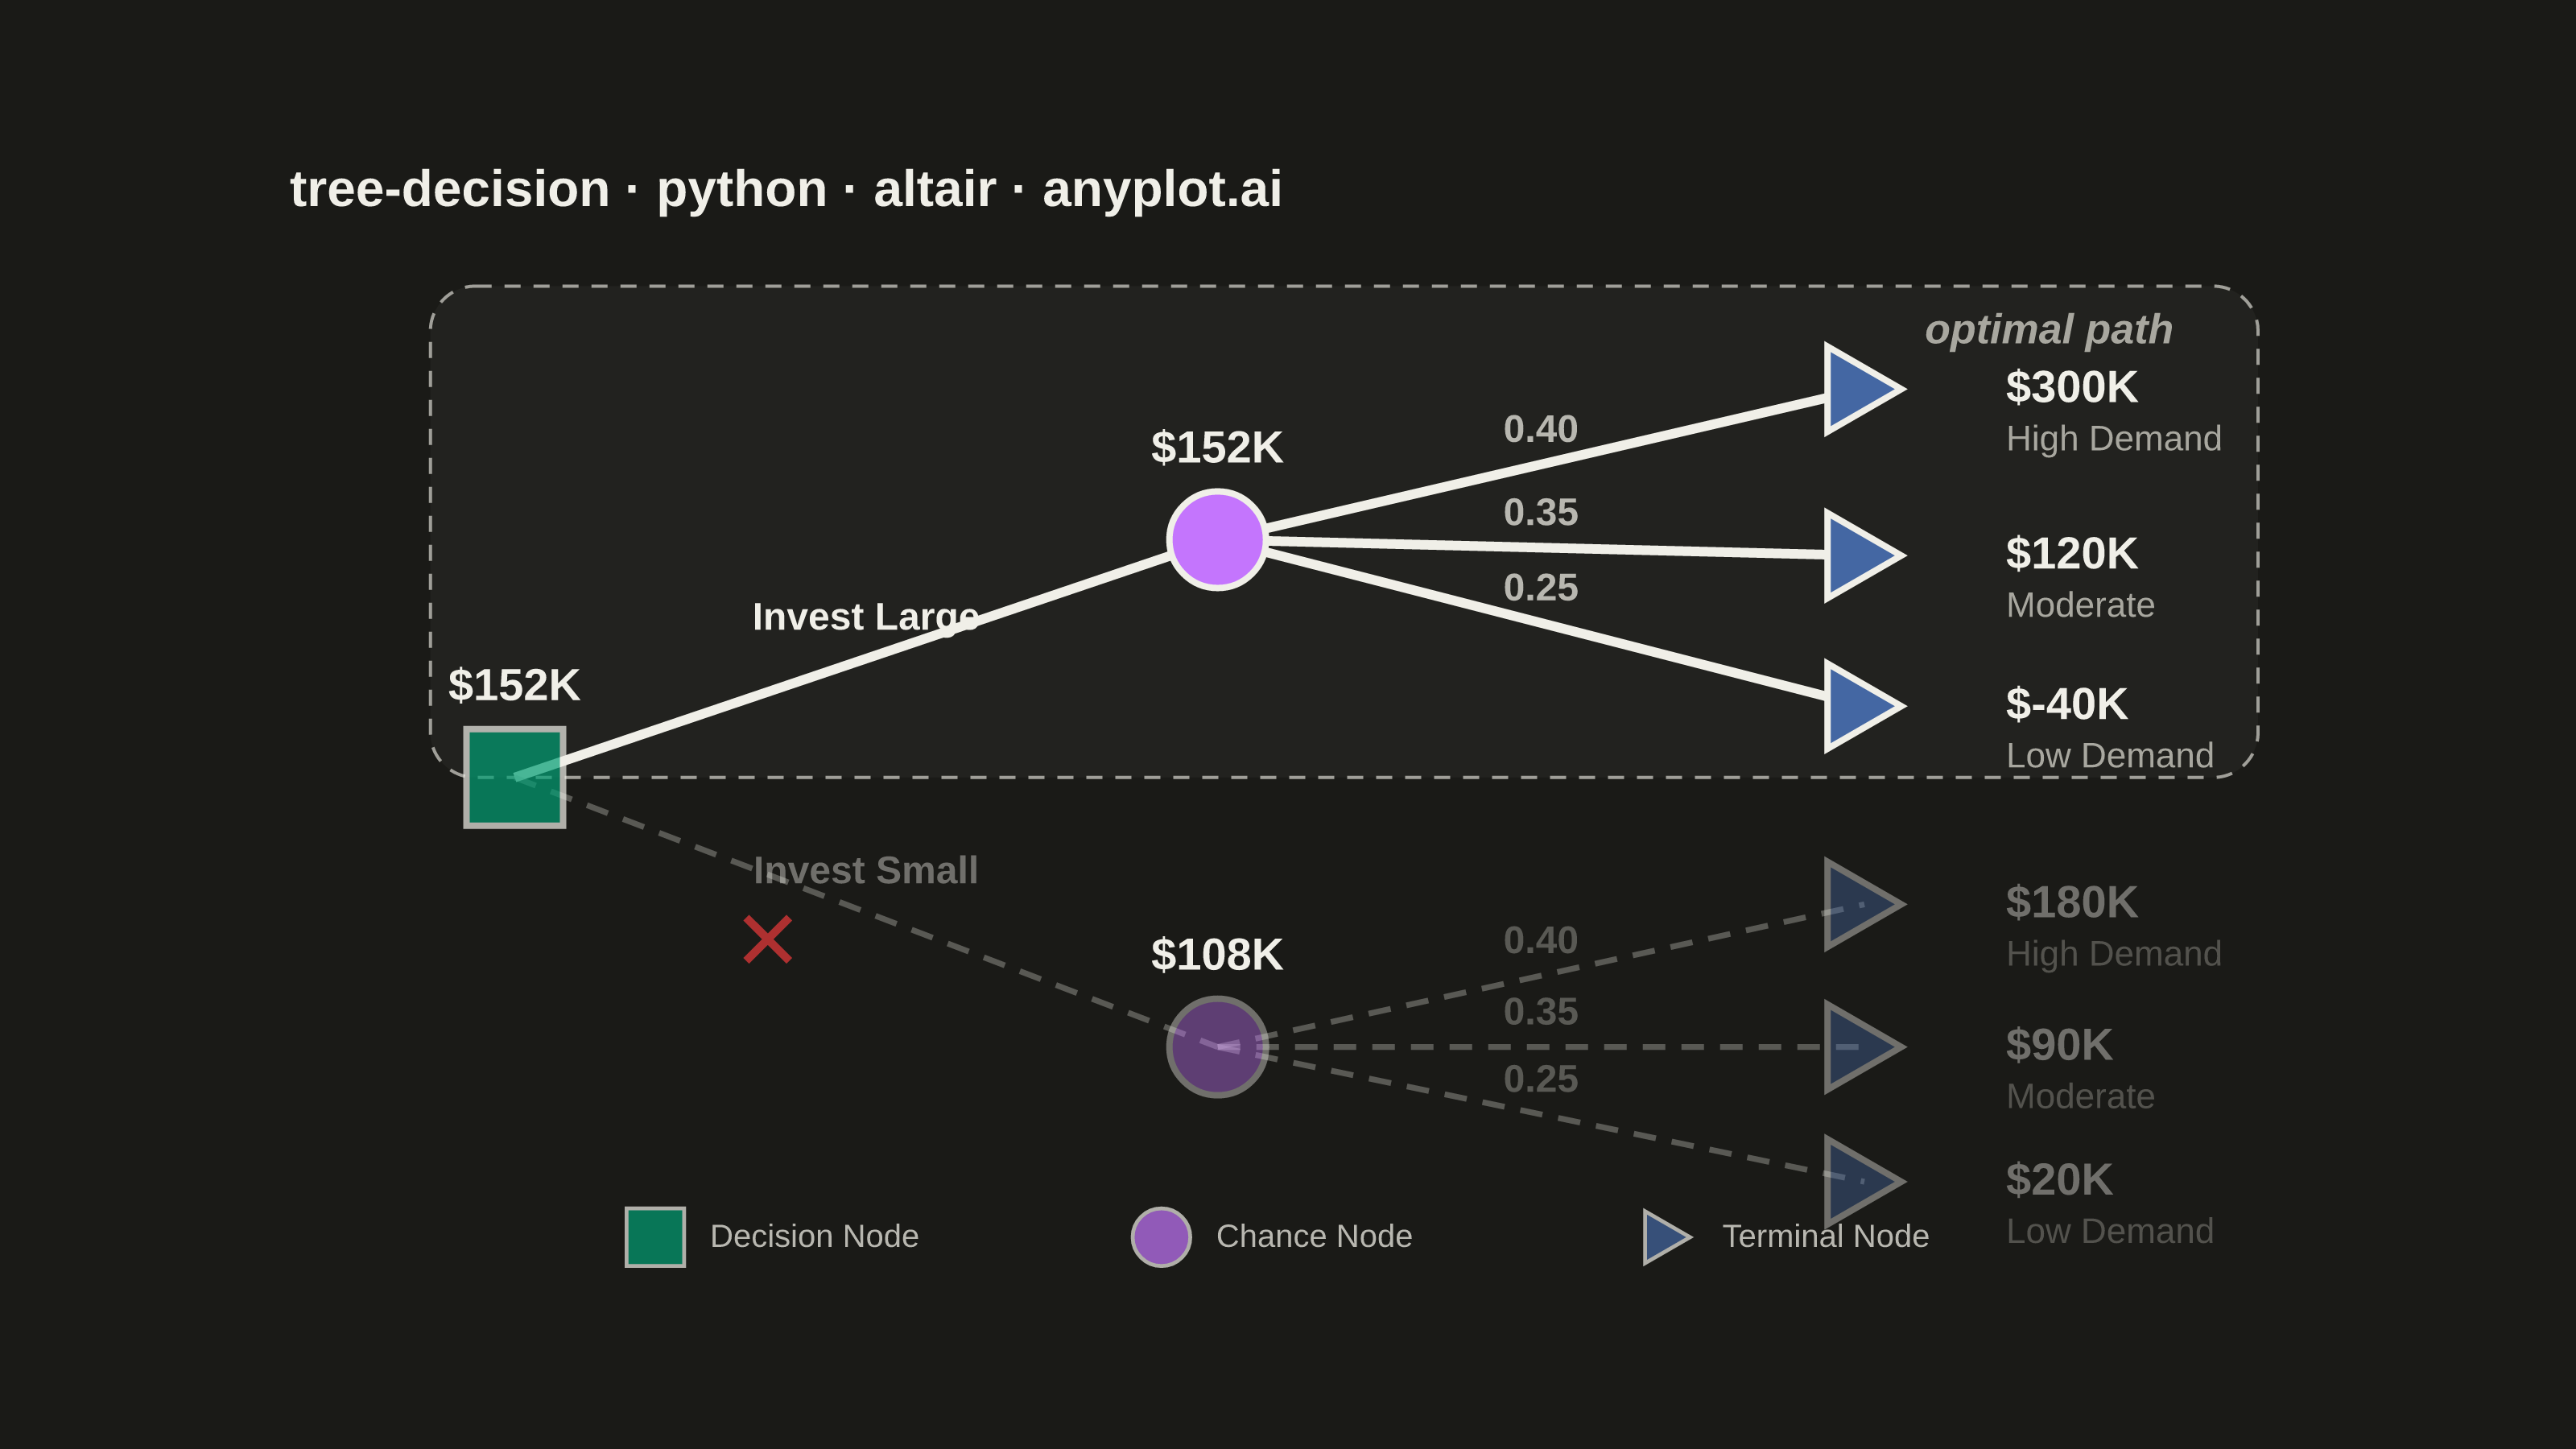
A tree-structured diagram for sequential decision analysis, displaying decision nodes (squares), chance nodes (circles), and terminal outcome nodes (triangles) connected by branching paths. Each chance branch is labeled with probabilities, terminal nodes show payoff values, and Expected Monetary Values (EMV) are calculated via rollback at each node. Rejected (pruned) branches are visually marked, making it easy to trace the optimal decision path through a multi-stage problem.
""" anyplot.ai
tree-decision: Decision Tree Visualization with Probabilities
Library: altair 6.1.0 | Python 3.13.13
Quality: 92/100 | Updated: 2026-06-02
"""

import os

import altair as alt
import pandas as pd
from PIL import Image


THEME = os.getenv("ANYPLOT_THEME", "light")

PAGE_BG = "#FAF8F1" if THEME == "light" else "#1A1A17"
ELEVATED_BG = "#FFFDF6" if THEME == "light" else "#242420"
INK = "#1A1A17" if THEME == "light" else "#F0EFE8"
INK_SOFT = "#4A4A44" if THEME == "light" else "#B8B7B0"
INK_MUTED = "#6B6A63" if THEME == "light" else "#A8A79F"

# Imprint palette — canonical order for node types
DECISION_COLOR = "#009E73"  # position 1 (green) — first categorical series
CHANCE_COLOR = "#C475FD"  # position 2 (lavender)
TERMINAL_COLOR = "#4467A3"  # position 3 (blue)
PRUNE_RED = "#AE3030"  # semantic anchor — bad/loss/error

# Data - Two-stage investment decision tree
nodes_df = pd.DataFrame(
    [
        {
            "id": "D1",
            "type": "decision",
            "x": 50,
            "y": 300,
            "emv": "$152K",
            "label": "",
            "payoff": "",
            "detail": "Root decision | EMV=$152K | Optimal: Invest Large",
            "pruned": False,
        },
        {
            "id": "C1",
            "type": "chance",
            "x": 300,
            "y": 150,
            "emv": "$152K",
            "label": "Invest\nLarge",
            "payoff": "",
            "detail": "Chance | EMV=$152K | 0.40×300+0.35×120+0.25×(-40)",
            "pruned": False,
        },
        {
            "id": "C2",
            "type": "chance",
            "x": 300,
            "y": 470,
            "emv": "$108K",
            "label": "Invest\nSmall",
            "payoff": "",
            "detail": "Chance (pruned) | EMV=$108K | 0.40×180+0.35×90+0.25×20",
            "pruned": True,
        },
        {
            "id": "T1",
            "type": "terminal",
            "x": 530,
            "y": 55,
            "emv": "",
            "label": "High Demand",
            "payoff": "$300K",
            "detail": "High Demand | Payoff=$300K | Prob=0.40",
            "pruned": False,
        },
        {
            "id": "T2",
            "type": "terminal",
            "x": 530,
            "y": 160,
            "emv": "",
            "label": "Moderate",
            "payoff": "$120K",
            "detail": "Moderate Demand | Payoff=$120K | Prob=0.35",
            "pruned": False,
        },
        {
            "id": "T3",
            "type": "terminal",
            "x": 530,
            "y": 255,
            "emv": "",
            "label": "Low Demand",
            "payoff": "$-40K",
            "detail": "Low Demand | Payoff=-$40K | Prob=0.25",
            "pruned": False,
        },
        {
            "id": "T4",
            "type": "terminal",
            "x": 530,
            "y": 380,
            "emv": "",
            "label": "High Demand",
            "payoff": "$180K",
            "detail": "High Demand | Payoff=$180K | Prob=0.40",
            "pruned": True,
        },
        {
            "id": "T5",
            "type": "terminal",
            "x": 530,
            "y": 470,
            "emv": "",
            "label": "Moderate",
            "payoff": "$90K",
            "detail": "Moderate Demand | Payoff=$90K | Prob=0.35",
            "pruned": True,
        },
        {
            "id": "T6",
            "type": "terminal",
            "x": 530,
            "y": 555,
            "emv": "",
            "label": "Low Demand",
            "payoff": "$20K",
            "detail": "Low Demand | Payoff=$20K | Prob=0.25",
            "pruned": True,
        },
    ]
)

edges_df = pd.DataFrame(
    [
        {"x": 50, "y": 300, "x2": 300, "y2": 150, "label": "Invest Large", "prob": "", "pruned": False},
        {"x": 50, "y": 300, "x2": 300, "y2": 470, "label": "Invest Small", "prob": "", "pruned": True},
        {"x": 300, "y": 150, "x2": 530, "y2": 55, "label": "", "prob": "0.40", "pruned": False},
        {"x": 300, "y": 150, "x2": 530, "y2": 160, "label": "", "prob": "0.35", "pruned": False},
        {"x": 300, "y": 150, "x2": 530, "y2": 255, "label": "", "prob": "0.25", "pruned": False},
        {"x": 300, "y": 470, "x2": 530, "y2": 380, "label": "", "prob": "0.40", "pruned": True},
        {"x": 300, "y": 470, "x2": 530, "y2": 470, "label": "", "prob": "0.35", "pruned": True},
        {"x": 300, "y": 470, "x2": 530, "y2": 555, "label": "", "prob": "0.25", "pruned": True},
    ]
)

# Shared scales — inverted y so tree grows downward
x_scale = alt.Scale(domain=[-30, 680])
y_scale = alt.Scale(domain=[620, -30])
x_enc = alt.X("x:Q", scale=x_scale, axis=None)
y_enc = alt.Y("y:Q", scale=y_scale, axis=None)

hover = alt.selection_point(on="pointerover", fields=["id"], empty=False)
node_tooltip = [
    alt.Tooltip("id:N", title="Node"),
    alt.Tooltip("type:N", title="Type"),
    alt.Tooltip("detail:N", title="Info"),
]

# Subtle background panel behind optimal path (storytelling)
optimal_path_bg = pd.DataFrame([{"x": 20, "y": -10, "x2": 670, "y2": 300}])
optimal_bg = (
    alt.Chart(optimal_path_bg)
    .mark_rect(cornerRadius=14, color=ELEVATED_BG, opacity=0.85, stroke=INK_SOFT, strokeWidth=1.0, strokeDash=[5, 4])
    .encode(x=alt.X("x:Q", scale=x_scale, axis=None), y=alt.Y("y:Q", scale=y_scale, axis=None), x2="x2:Q", y2="y2:Q")
)

optimal_label = (
    alt.Chart(pd.DataFrame([{"x": 640, "y": 18}]))
    .mark_text(fontSize=13, fontStyle="italic", color=INK_MUTED, align="right", fontWeight="bold")
    .encode(
        x=alt.X("x:Q", scale=x_scale, axis=None),
        y=alt.Y("y:Q", scale=y_scale, axis=None),
        text=alt.value("optimal path"),
    )
)

# Edges
active_edges = edges_df[~edges_df["pruned"]]
pruned_edges = edges_df[edges_df["pruned"]]

active_lines = (
    alt.Chart(active_edges).mark_rule(strokeWidth=3.0, color=INK).encode(x=x_enc, y=y_enc, x2="x2:Q", y2="y2:Q")
)

pruned_lines = (
    alt.Chart(pruned_edges)
    .mark_rule(strokeWidth=1.8, strokeDash=[7, 5], opacity=0.40, color=INK_SOFT)
    .encode(x=x_enc, y=y_enc, x2="x2:Q", y2="y2:Q")
)

# Pruned cross mark — uses Imprint semantic-red anchor
pruned_cross = (
    alt.Chart(pd.DataFrame([{"cx": 140, "cy": 405}]))
    .mark_text(fontSize=26, fontWeight="bold", color=PRUNE_RED, text="✕")
    .encode(x=alt.X("cx:Q", scale=x_scale, axis=None), y=alt.Y("cy:Q", scale=y_scale, axis=None))
)

# Node subsets
chance_df = nodes_df[nodes_df["type"] == "chance"]
terminal_df = nodes_df[nodes_df["type"] == "terminal"]
decision_df = nodes_df[nodes_df["type"] == "decision"]

decision_nodes = (
    alt.Chart(decision_df)
    .mark_square(size=900, color=DECISION_COLOR, stroke=INK, strokeWidth=2.0)
    .encode(x=x_enc, y=y_enc, size=alt.condition(hover, alt.value(1100), alt.value(900)), tooltip=node_tooltip)
    .add_params(hover)
)

chance_nodes = (
    alt.Chart(chance_df)
    .mark_circle(size=900, color=CHANCE_COLOR, stroke=INK, strokeWidth=2.0)
    .encode(
        x=x_enc,
        y=y_enc,
        opacity=alt.condition(alt.datum.pruned == True, alt.value(0.40), alt.value(1.0)),
        size=alt.condition(hover, alt.value(1100), alt.value(900)),
        tooltip=node_tooltip,
    )
    .add_params(hover)
)

terminal_nodes = (
    alt.Chart(terminal_df)
    .mark_point(shape="triangle-right", size=700, filled=True, color=TERMINAL_COLOR, stroke=INK, strokeWidth=2.0)
    .encode(
        x=x_enc,
        y=y_enc,
        opacity=alt.condition(alt.datum.pruned == True, alt.value(0.40), alt.value(1.0)),
        size=alt.condition(hover, alt.value(880), alt.value(700)),
        tooltip=node_tooltip,
    )
    .add_params(hover)
)

# Text labels
emv_labels = (
    alt.Chart(nodes_df)
    .transform_filter(alt.datum.emv != "")
    .mark_text(fontSize=14, fontWeight="bold", dy=-28, color=INK)
    .encode(x=x_enc, y=y_enc, text="emv:N")
)

payoff_labels = (
    alt.Chart(nodes_df)
    .transform_filter(alt.datum.payoff != "")
    .mark_text(fontSize=14, fontWeight="bold", dx=44, align="left", color=INK)
    .encode(
        x=x_enc,
        y=y_enc,
        text="payoff:N",
        opacity=alt.condition(alt.datum.pruned == True, alt.value(0.40), alt.value(1.0)),
    )
)

terminal_desc = (
    alt.Chart(nodes_df)
    .transform_filter(alt.datum.type == "terminal")
    .mark_text(fontSize=11, dx=44, dy=16, align="left", color=INK_MUTED)
    .encode(
        x=x_enc,
        y=y_enc,
        text="label:N",
        opacity=alt.condition(alt.datum.pruned == True, alt.value(0.40), alt.value(1.0)),
    )
)

# Edge midpoint labels
edges_df["mx"] = (edges_df["x"] + edges_df["x2"]) / 2
edges_df["my"] = (edges_df["y"] + edges_df["y2"]) / 2

branch_label_df = edges_df[edges_df["label"] != ""]
prob_label_df = edges_df[edges_df["prob"] != ""]

branch_labels = (
    alt.Chart(branch_label_df)
    .mark_text(fontSize=12, fontWeight="bold", dy=-13, color=INK)
    .encode(
        x=alt.X("mx:Q", scale=x_scale, axis=None),
        y=alt.Y("my:Q", scale=y_scale, axis=None),
        text="label:N",
        opacity=alt.condition(alt.datum.pruned == True, alt.value(0.40), alt.value(1.0)),
    )
)

prob_labels = (
    alt.Chart(prob_label_df)
    .mark_text(fontSize=12, dy=-11, color=INK_SOFT, fontWeight="bold")
    .encode(
        x=alt.X("mx:Q", scale=x_scale, axis=None),
        y=alt.Y("my:Q", scale=y_scale, axis=None),
        text="prob:N",
        opacity=alt.condition(alt.datum.pruned == True, alt.value(0.40), alt.value(1.0)),
    )
)

# Legend
legend_data = pd.DataFrame(
    [
        {"lx": 100, "ly": 590, "label": "Decision Node", "shape": "square"},
        {"lx": 280, "ly": 590, "label": "Chance Node", "shape": "circle"},
        {"lx": 460, "ly": 590, "label": "Terminal Node", "shape": "triangle"},
    ]
)

legend_sq = (
    alt.Chart(legend_data.query("shape == 'square'"))
    .mark_square(size=320, color=DECISION_COLOR, stroke=INK, strokeWidth=1.2)
    .encode(x=alt.X("lx:Q", scale=x_scale, axis=None), y=alt.Y("ly:Q", scale=y_scale, axis=None))
)
legend_ci = (
    alt.Chart(legend_data.query("shape == 'circle'"))
    .mark_circle(size=320, color=CHANCE_COLOR, stroke=INK, strokeWidth=1.2)
    .encode(x=alt.X("lx:Q", scale=x_scale, axis=None), y=alt.Y("ly:Q", scale=y_scale, axis=None))
)
legend_tr = (
    alt.Chart(legend_data.query("shape == 'triangle'"))
    .mark_point(shape="triangle-right", size=260, filled=True, color=TERMINAL_COLOR, stroke=INK, strokeWidth=1.2)
    .encode(x=alt.X("lx:Q", scale=x_scale, axis=None), y=alt.Y("ly:Q", scale=y_scale, axis=None))
)
legend_txt = (
    alt.Chart(legend_data)
    .mark_text(fontSize=10, dx=17, align="left", color=INK_SOFT)
    .encode(x=alt.X("lx:Q", scale=x_scale, axis=None), y=alt.Y("ly:Q", scale=y_scale, axis=None), text="label:N")
)

# Combine all layers — landscape inner view 620×320 → PIL-padded to 3200×1800
chart = (
    alt.layer(
        optimal_bg,
        active_lines,
        pruned_lines,
        pruned_cross,
        decision_nodes,
        chance_nodes,
        terminal_nodes,
        emv_labels,
        payoff_labels,
        terminal_desc,
        branch_labels,
        prob_labels,
        optimal_label,
        legend_sq,
        legend_ci,
        legend_tr,
        legend_txt,
    )
    .properties(
        width=620,
        height=320,
        background=PAGE_BG,
        title=alt.Title(
            "tree-decision · python · altair · anyplot.ai", fontSize=16, color=INK, anchor="start", offset=12
        ),
    )
    .configure_view(fill=PAGE_BG, strokeWidth=0)
    .configure_title(color=INK)
)

TW, TH = 3200, 1800
chart.save(f"plot-{THEME}.png", scale_factor=4.0)

_img = Image.open(f"plot-{THEME}.png").convert("RGB")
_w, _h = _img.size
if _w > TW or _h > TH:
    raise SystemExit(
        f"altair vl-convert produced {_w}×{_h}, exceeds target {TW}×{TH}. "
        f"Shrink chart .properties(width=, height=) values and re-render."
    )
if _w < TW or _h < TH:
    _canvas = Image.new("RGB", (TW, TH), PAGE_BG)
    _canvas.paste(_img, ((TW - _w) // 2, (TH - _h) // 2))
    _canvas.save(f"plot-{THEME}.png")

chart.save(f"plot-{THEME}.html")
Runnable source as JSON, for any HTTP client: https://api.anyplot.ai/specs/tree-decision/altair/code. Any spec id and library id listed in llms-full.txt fit the same URL shape; every URL below is complete and callable.
{
  "spec_id": "tree-decision",
  "language": "python",
  "library": "altair",
  "page": "https://anyplot.ai/tree-decision/python/altair",
  "hub": "https://anyplot.ai/tree-decision",
  "code_json": "https://api.anyplot.ai/specs/tree-decision/altair/code",
  "spec_json": "https://api.anyplot.ai/specs/tree-decision",
  "render_light_png": "https://storage.googleapis.com/anyplot-images/plots/tree-decision/python/altair/plot-light.png",
  "render_dark_png": "https://storage.googleapis.com/anyplot-images/plots/tree-decision/python/altair/plot-dark.png",
  "interactive_light_html": "https://storage.googleapis.com/anyplot-images/plots/tree-decision/python/altair/plot-light.html",
  "interactive_dark_html": "https://storage.googleapis.com/anyplot-images/plots/tree-decision/python/altair/plot-dark.html",
  "quality_score": 92.0,
  "license": "MIT",
  "guide": "https://anyplot.ai/llms.txt"
}
Part of Decision Tree Visualization with Probabilities on anyplot.ai.