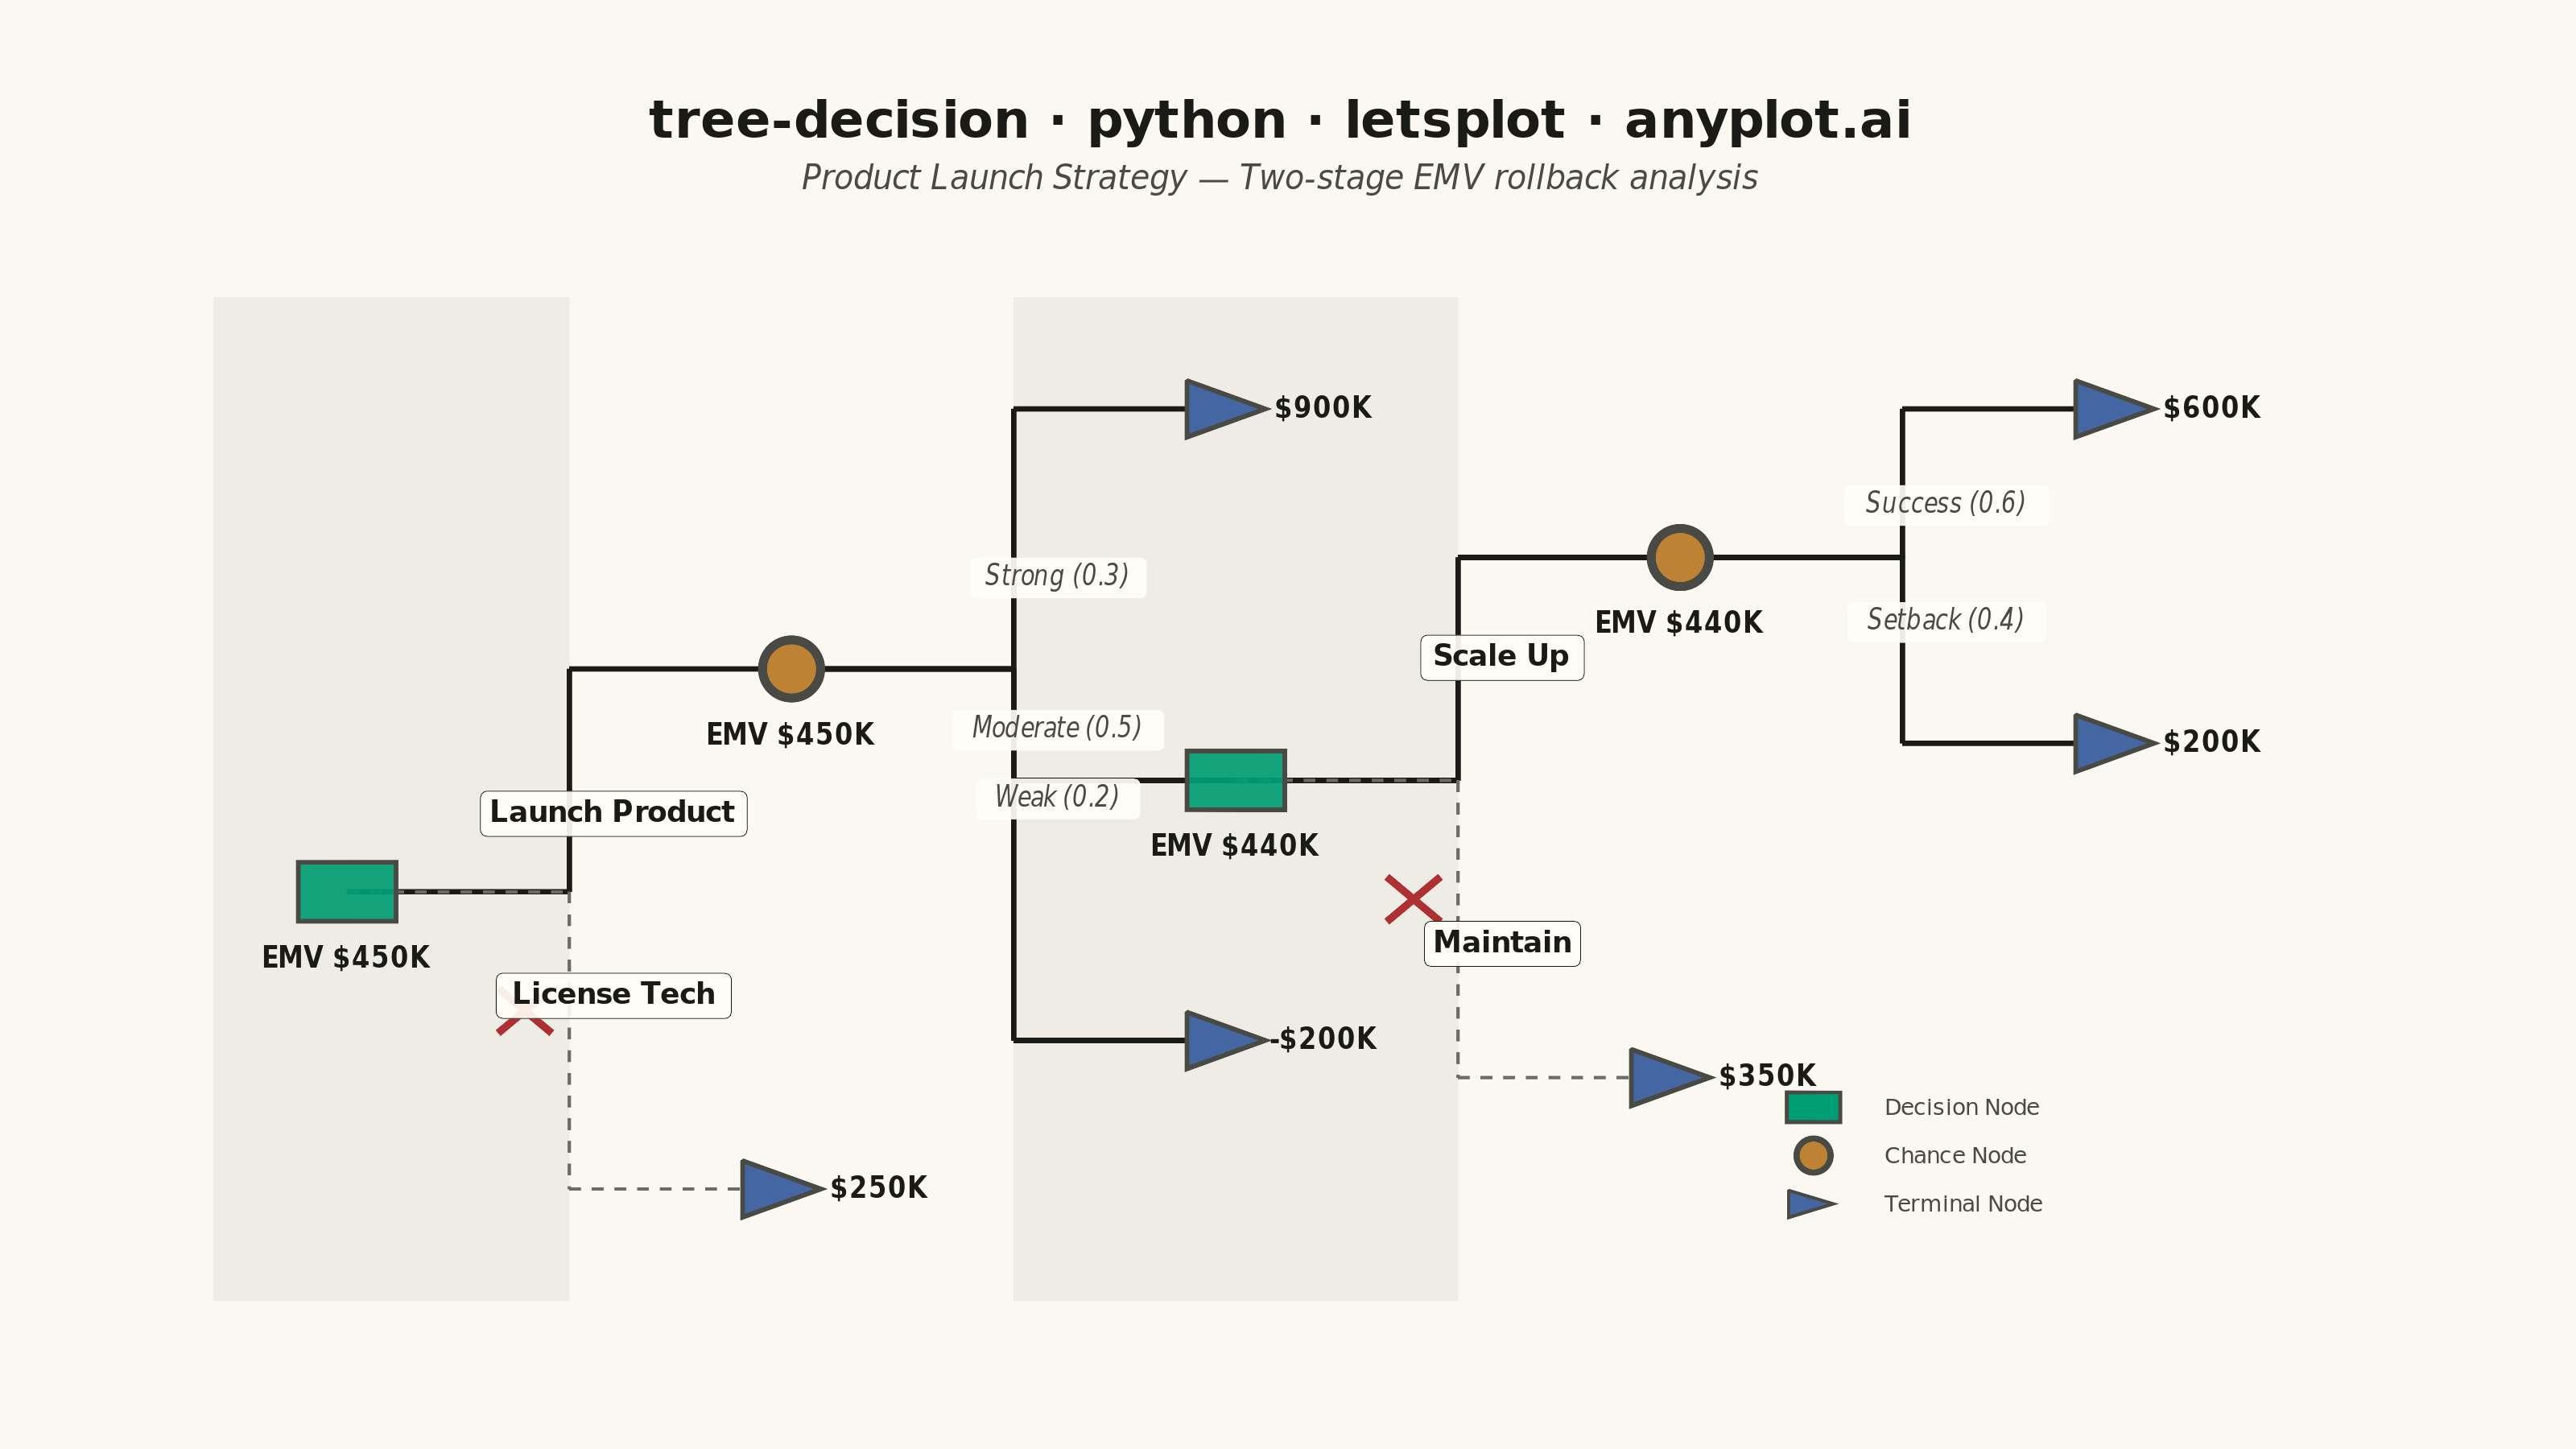
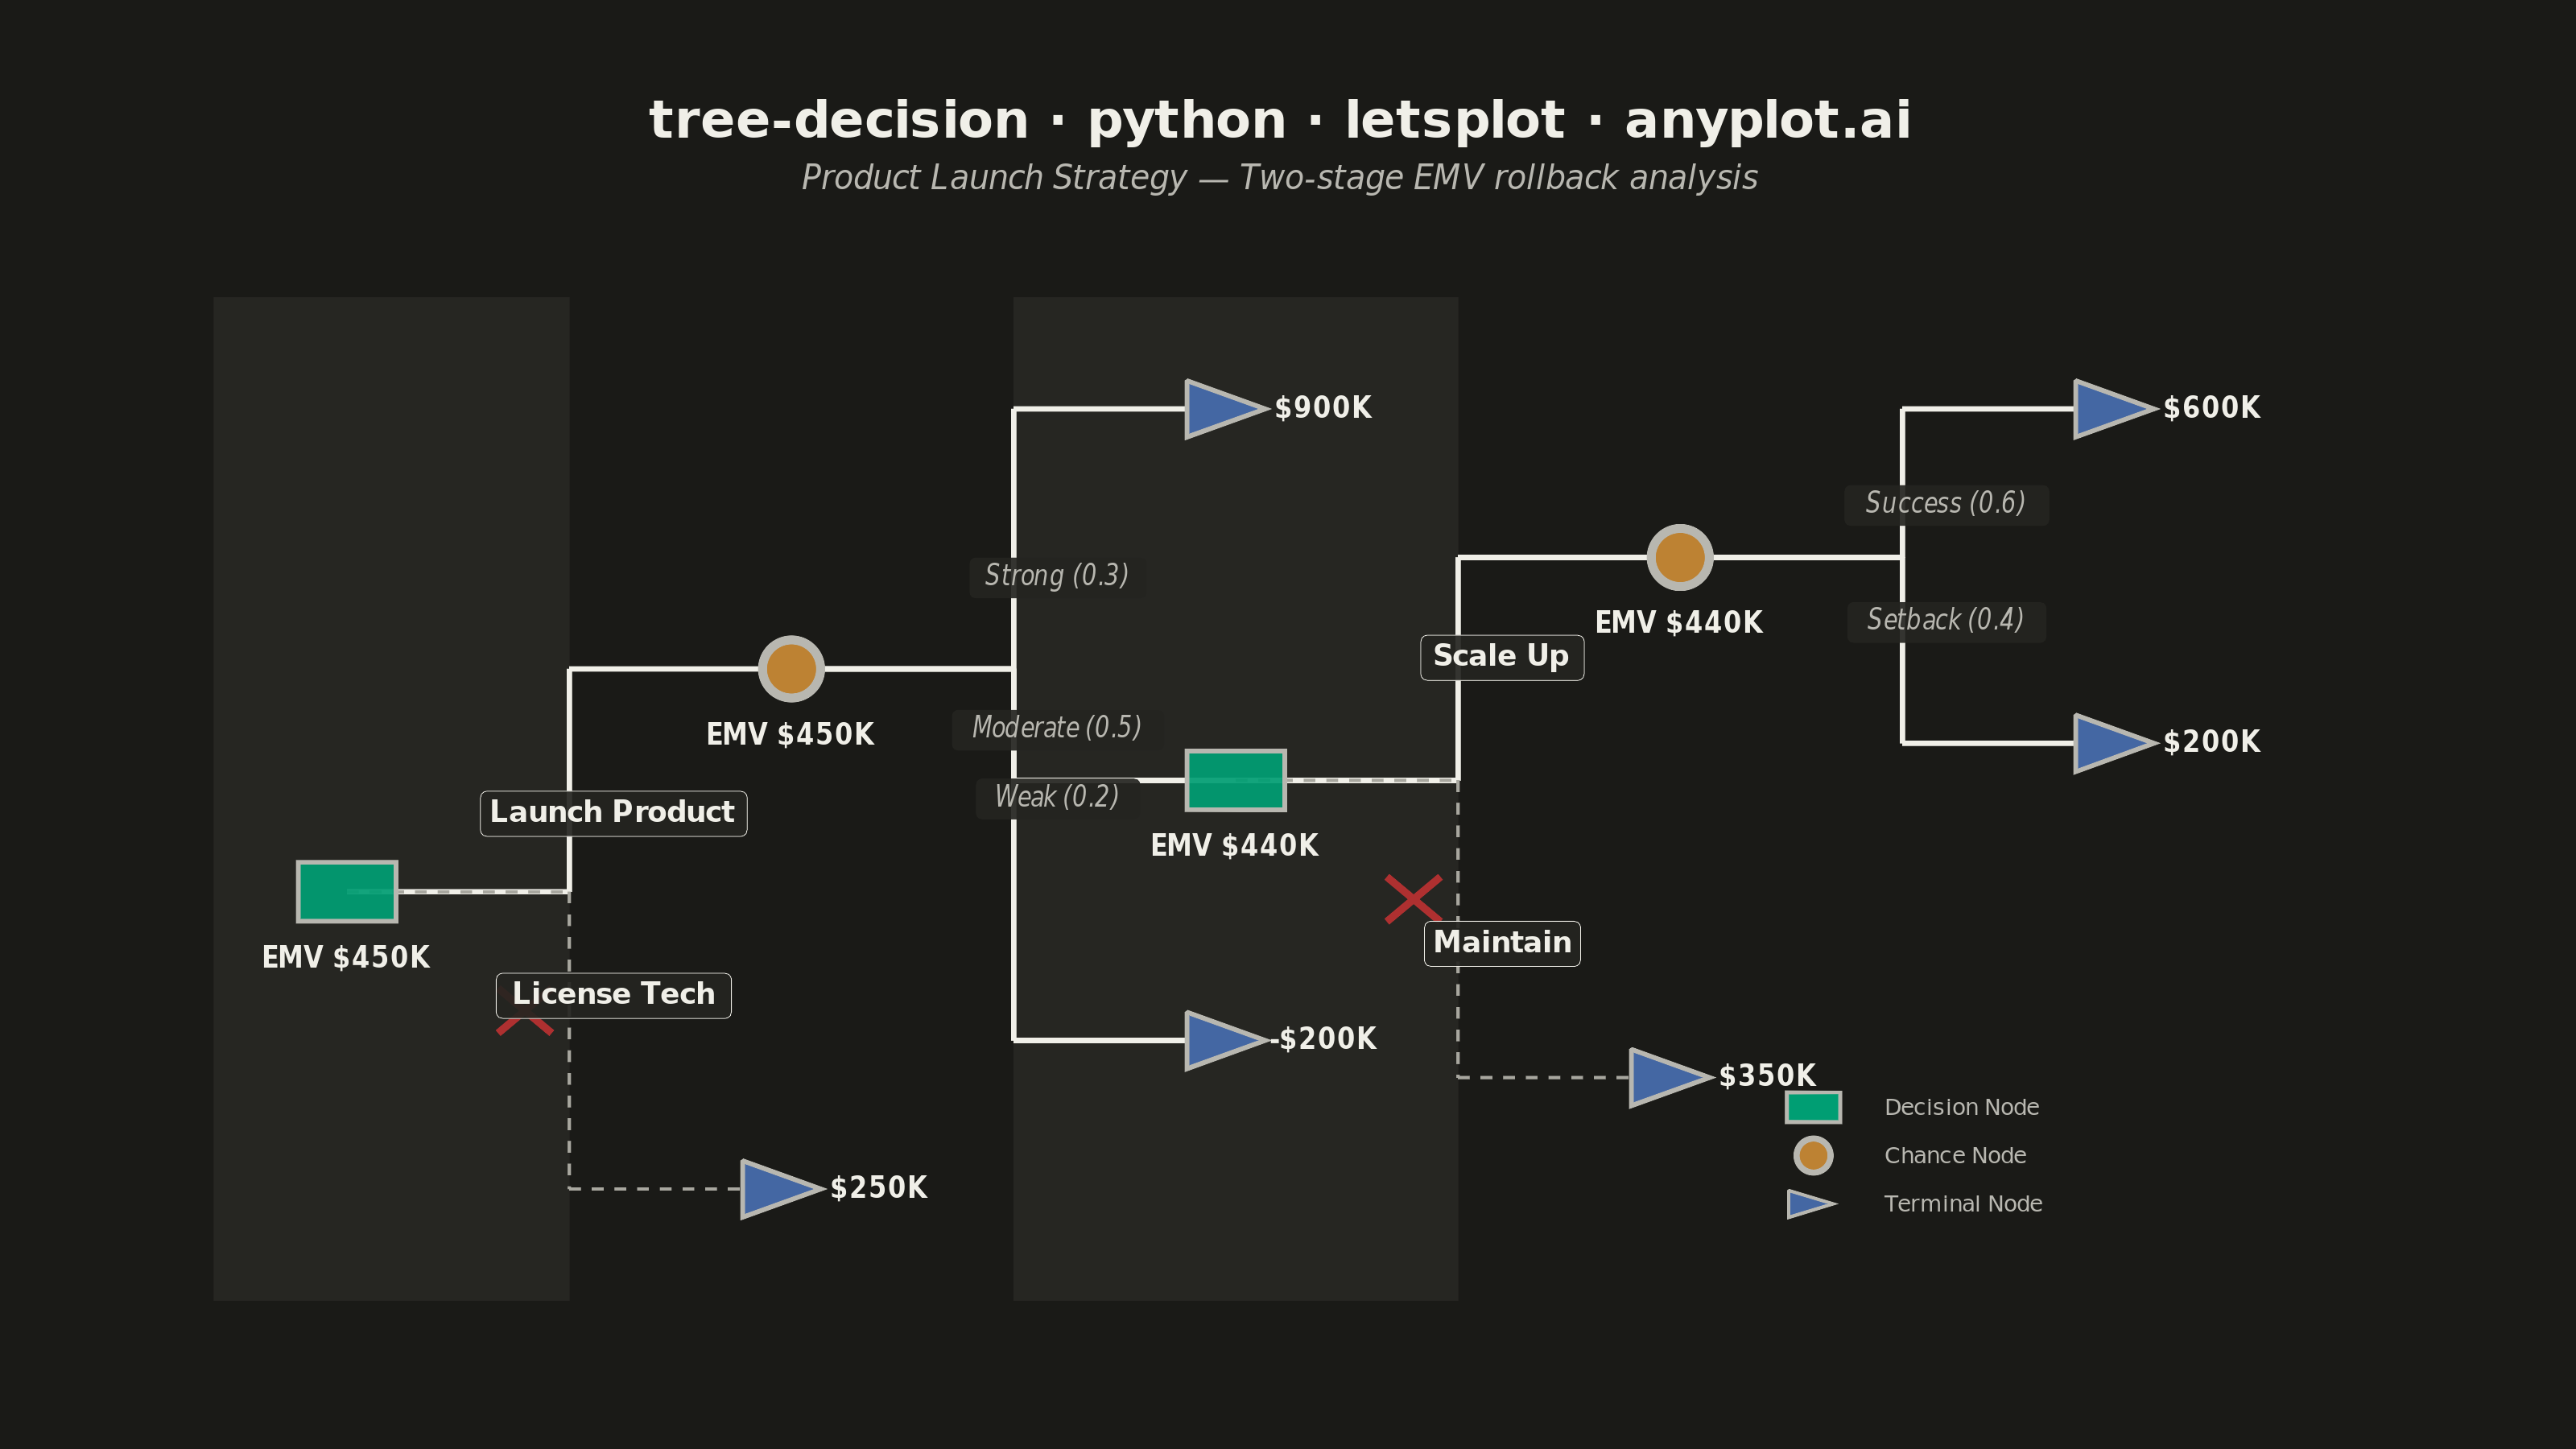
A tree-structured diagram for sequential decision analysis, displaying decision nodes (squares), chance nodes (circles), and terminal outcome nodes (triangles) connected by branching paths. Each chance branch is labeled with probabilities, terminal nodes show payoff values, and Expected Monetary Values (EMV) are calculated via rollback at each node. Rejected (pruned) branches are visually marked, making it easy to trace the optimal decision path through a multi-stage problem.
""" anyplot.ai
tree-decision: Decision Tree Visualization with Probabilities
Library: letsplot 4.10.1 | Python 3.13.13
Quality: 87/100 | Updated: 2026-06-02
"""

import os

import pandas as pd
from lets_plot import (
    LetsPlot,
    aes,
    element_rect,
    element_text,
    geom_label,
    geom_point,
    geom_polygon,
    geom_rect,
    geom_segment,
    geom_text,
    ggplot,
    ggsize,
    labs,
    scale_x_continuous,
    scale_y_continuous,
    theme,
    theme_void,
)
from lets_plot.export import ggsave


LetsPlot.setup_html()

# Theme-adaptive chrome
THEME = os.getenv("ANYPLOT_THEME", "light")
PAGE_BG = "#FAF8F1" if THEME == "light" else "#1A1A17"
ELEVATED_BG = "#FFFDF6" if THEME == "light" else "#242420"
INK = "#1A1A17" if THEME == "light" else "#F0EFE8"
INK_SOFT = "#4A4A44" if THEME == "light" else "#B8B7B0"
INK_MUTED = "#6B6A63" if THEME == "light" else "#A8A79F"

# Imprint palette — node types in canonical order (positions 1, 2, 3)
IMPRINT = ["#009E73", "#C475FD", "#4467A3", "#BD8233", "#AE3030", "#2ABCCD", "#954477", "#99B314"]
COL_DECISION = IMPRINT[0]  # #009E73 brand green — always first series
COL_CHANCE = IMPRINT[3]  # #BD8233 ochre — warm tone fits probability/uncertainty
COL_TERMINAL = IMPRINT[2]  # #4467A3 blue — neutral outcome nodes
PRUNE_RED = IMPRINT[4]  # #AE3030 semantic red for pruning (rejected branches)

# Two-stage product launch decision tree
# EMV rollback:
#   C2: 0.6×$600K + 0.4×$200K = $440K
#   D2: max($440K, $350K) = $440K → Maintain pruned
#   C1: 0.3×$900K + 0.5×$440K + 0.2×(−$200K) = $450K
#   D1: max($450K, $250K) = $450K → License Tech pruned

node_records = [
    {"id": "D1", "type": "decision", "x": 0, "y": 6.0, "value": "EMV $450K"},
    {"id": "C1", "type": "chance", "x": 5, "y": 9.0, "value": "EMV $450K"},
    {"id": "T6", "type": "terminal", "x": 5, "y": 2.0, "value": "$250K"},
    {"id": "T1", "type": "terminal", "x": 10, "y": 12.5, "value": "$900K"},
    {"id": "D2", "type": "decision", "x": 10, "y": 7.5, "value": "EMV $440K"},
    {"id": "T2", "type": "terminal", "x": 10, "y": 4.0, "value": "-$200K"},
    {"id": "C2", "type": "chance", "x": 15, "y": 10.5, "value": "EMV $440K"},
    {"id": "T3", "type": "terminal", "x": 15, "y": 3.5, "value": "$350K"},
    {"id": "T4", "type": "terminal", "x": 20, "y": 12.5, "value": "$600K"},
    {"id": "T5", "type": "terminal", "x": 20, "y": 8.0, "value": "$200K"},
]

branch_records = [
    {"from_id": "D1", "to_id": "C1", "label": "Launch Product", "pruned": False, "is_prob": False},
    {"from_id": "D1", "to_id": "T6", "label": "License Tech", "pruned": True, "is_prob": False},
    {"from_id": "C1", "to_id": "T1", "label": "Strong (0.3)", "pruned": False, "is_prob": True},
    {"from_id": "C1", "to_id": "D2", "label": "Moderate (0.5)", "pruned": False, "is_prob": True},
    {"from_id": "C1", "to_id": "T2", "label": "Weak (0.2)", "pruned": False, "is_prob": True},
    {"from_id": "D2", "to_id": "C2", "label": "Scale Up", "pruned": False, "is_prob": False},
    {"from_id": "D2", "to_id": "T3", "label": "Maintain", "pruned": True, "is_prob": False},
    {"from_id": "C2", "to_id": "T4", "label": "Success (0.6)", "pruned": False, "is_prob": True},
    {"from_id": "C2", "to_id": "T5", "label": "Setback (0.4)", "pruned": False, "is_prob": True},
]

node_lookup = {r["id"]: r for r in node_records}

# Elbow connectors (horizontal → vertical → horizontal)
active_segs, pruned_segs = [], []
for b in branch_records:
    f, t = node_lookup[b["from_id"]], node_lookup[b["to_id"]]
    mx = (f["x"] + t["x"]) / 2
    segs = [
        {"x": f["x"], "y": f["y"], "xend": mx, "yend": f["y"]},
        {"x": mx, "y": f["y"], "xend": mx, "yend": t["y"]},
        {"x": mx, "y": t["y"], "xend": t["x"], "yend": t["y"]},
    ]
    (pruned_segs if b["pruned"] else active_segs).extend(segs)

df_active = pd.DataFrame(active_segs)
df_pruned = pd.DataFrame(pruned_segs)

# Branch labels — placed on vertical segment
# Use 0.55 fraction near D2 to spread labels away from the congested node
prob_labels, dec_labels = [], []
for b in branch_records:
    f, t = node_lookup[b["from_id"]], node_lookup[b["to_id"]]
    mx = (f["x"] + t["x"]) / 2
    frac = 0.55 if (b["from_id"] == "D2" or b["to_id"] == "D2") else 0.35
    ly = f["y"] + (t["y"] - f["y"]) * frac
    rec = {"x": mx + 0.5, "y": ly, "label": b["label"]}
    (prob_labels if b["is_prob"] else dec_labels).append(rec)

df_prob = pd.DataFrame(prob_labels)
df_dec = pd.DataFrame(dec_labels)

# Decision node rectangles (coordinate-space sizing)
rect_half = 0.55
df_dec_rects = pd.DataFrame(
    [
        {
            "xmin": r["x"] - rect_half,
            "xmax": r["x"] + rect_half,
            "ymin": r["y"] - rect_half * 0.72,
            "ymax": r["y"] + rect_half * 0.72,
        }
        for r in node_records
        if r["type"] == "decision"
    ]
)

# Chance nodes (circles via geom_point)
df_chance = pd.DataFrame([r for r in node_records if r["type"] == "chance"])

# Terminal node triangles (right-pointing)
tri_w, tri_h = 0.55, 0.38
tri_polys = []
for r in node_records:
    if r["type"] == "terminal":
        gid = f"tri_{r['id']}"
        tri_polys.extend(
            [
                {"x": r["x"] - tri_w, "y": r["y"] + tri_h, "group": gid},
                {"x": r["x"] - tri_w, "y": r["y"] - tri_h, "group": gid},
                {"x": r["x"] + tri_w * 0.6, "y": r["y"], "group": gid},
            ]
        )
df_triangles = pd.DataFrame(tri_polys)

# Value labels: EMV below non-terminal nodes, payoffs right of terminals
emv_recs, pay_recs = [], []
for r in node_records:
    if r["type"] == "terminal":
        pay_recs.append({"x": r["x"] + 1.0, "y": r["y"], "label": r["value"]})
    else:
        emv_recs.append({"x": r["x"], "y": r["y"] - 0.9, "label": r["value"]})
df_emv = pd.DataFrame(emv_recs)
df_pay = pd.DataFrame(pay_recs)

# Pruning X crosses (Imprint semantic red)
prune_marks = []
for b in branch_records:
    if b["pruned"]:
        f, t = node_lookup[b["from_id"]], node_lookup[b["to_id"]]
        cx = f["x"] + (t["x"] - f["x"]) * 0.4
        cy = f["y"] + (t["y"] - f["y"]) * 0.4
        d = 0.3
        prune_marks += [
            {"x": cx - d, "y": cy - d, "xend": cx + d, "yend": cy + d},
            {"x": cx - d, "y": cy + d, "xend": cx + d, "yend": cy - d},
        ]
df_prune = pd.DataFrame(prune_marks)

# Manual legend (bottom-right area)
lx, lby = 16.5, 1.8
df_leg_labels = pd.DataFrame(
    [
        {"x": lx + 0.8, "y": lby + 1.3, "label": "Decision Node"},
        {"x": lx + 0.8, "y": lby + 0.65, "label": "Chance Node"},
        {"x": lx + 0.8, "y": lby, "label": "Terminal Node"},
    ]
)
df_leg_rect = pd.DataFrame([{"xmin": lx - 0.3, "xmax": lx + 0.3, "ymin": lby + 1.1, "ymax": lby + 1.5}])
df_leg_tri = pd.DataFrame(
    [
        {"x": lx - 0.28, "y": lby + 0.18, "group": "lt"},
        {"x": lx - 0.28, "y": lby - 0.18, "group": "lt"},
        {"x": lx + 0.22, "y": lby, "group": "lt"},
    ]
)

# Subtle depth shading bands to distinguish tree stages
depth_bands = pd.DataFrame(
    [{"xmin": -1.5, "xmax": 2.5, "ymin": 0.5, "ymax": 14.0}, {"xmin": 7.5, "xmax": 12.5, "ymin": 0.5, "ymax": 14.0}]
)

# ── Build plot ────────────────────────────────────────────────────────────────
p = (
    ggplot()
    # Depth shading bands (more visible than before)
    + geom_rect(
        aes(xmin="xmin", xmax="xmax", ymin="ymin", ymax="ymax"),
        data=depth_bands,
        fill=INK,
        color="transparent",
        size=0,
        alpha=0.055,
    )
    # Active branches
    + geom_segment(aes(x="x", y="y", xend="xend", yend="yend"), data=df_active, size=0.7, color=INK)
    # Pruned branches (dashed, muted)
    + geom_segment(
        aes(x="x", y="y", xend="xend", yend="yend"), data=df_pruned, size=0.4, color=INK_MUTED, linetype="dashed"
    )
    # Pruning X marks
    + geom_segment(aes(x="x", y="y", xend="xend", yend="yend"), data=df_prune, size=1.0, color=PRUNE_RED)
    # Decision nodes as filled rectangles (Imprint brand green)
    + geom_rect(
        aes(xmin="xmin", xmax="xmax", ymin="ymin", ymax="ymax"),
        data=df_dec_rects,
        fill=COL_DECISION,
        color=INK_SOFT,
        size=0.6,
        alpha=0.92,
    )
    # Chance nodes as circles (Imprint ochre)
    + geom_point(aes(x="x", y="y"), data=df_chance, shape=21, size=7, fill=COL_CHANCE, color=INK_SOFT, stroke=1.2)
    # Terminal nodes as right-pointing triangles (Imprint blue)
    + geom_polygon(aes(x="x", y="y", group="group"), data=df_triangles, fill=COL_TERMINAL, color=INK_SOFT, size=0.6)
    # Probability branch labels (italic, elevated background)
    + geom_label(
        aes(x="x", y="y", label="label"),
        data=df_prob,
        size=4,
        color=INK_SOFT,
        fill=ELEVATED_BG,
        alpha=0.92,
        label_padding=0.28,
        label_r=0.15,
        label_size=0,
        fontface="italic",
    )
    # Decision branch labels (bold)
    + geom_label(
        aes(x="x", y="y", label="label"),
        data=df_dec,
        size=4.5,
        color=INK,
        fill=ELEVATED_BG,
        alpha=0.92,
        label_padding=0.28,
        label_r=0.15,
        label_size=0.2,
        fontface="bold",
    )
    # EMV labels below non-terminal nodes
    + geom_text(aes(x="x", y="y", label="label"), data=df_emv, size=4, color=INK, fontface="bold")
    # Payoff labels right of terminal nodes
    + geom_text(aes(x="x", y="y", label="label"), data=df_pay, size=4, color=INK, fontface="bold")
    # Legend: decision rectangle
    + geom_rect(
        aes(xmin="xmin", xmax="xmax", ymin="ymin", ymax="ymax"),
        data=df_leg_rect,
        fill=COL_DECISION,
        color=INK_SOFT,
        size=0.5,
    )
    # Legend: chance circle
    + geom_point(
        aes(x="x", y="y"),
        data=pd.DataFrame([{"x": lx, "y": lby + 0.65}]),
        shape=21,
        size=4,
        fill=COL_CHANCE,
        color=INK_SOFT,
        stroke=0.8,
    )
    # Legend: terminal triangle
    + geom_polygon(aes(x="x", y="y", group="group"), data=df_leg_tri, fill=COL_TERMINAL, color=INK_SOFT, size=0.4)
    # Legend text labels
    + geom_text(aes(x="x", y="y", label="label"), data=df_leg_labels, size=3.5, color=INK_SOFT, hjust=0)
    + scale_x_continuous(limits=[-2, 23])
    + scale_y_continuous(limits=[0.0, 14.5])
    + labs(
        title="tree-decision · python · letsplot · anyplot.ai",
        subtitle="Product Launch Strategy — Two-stage EMV rollback analysis",
    )
    + theme_void()
    + theme(
        plot_title=element_text(size=16, hjust=0.5, face="bold", color=INK),
        plot_subtitle=element_text(size=11, hjust=0.5, color=INK_SOFT, face="italic"),
        plot_margin=[30, 20, 15, 15],
        plot_background=element_rect(fill=PAGE_BG, color=PAGE_BG),
    )
    + ggsize(800, 450)
)

ggsave(p, f"plot-{THEME}.png", path=".", scale=4)
ggsave(p, f"plot-{THEME}.html", path=".")
Runnable source as JSON, for any HTTP client: https://api.anyplot.ai/specs/tree-decision/letsplot/code. Any spec id and library id listed in llms-full.txt fit the same URL shape; every URL below is complete and callable.
{
  "spec_id": "tree-decision",
  "language": "python",
  "library": "letsplot",
  "page": "https://anyplot.ai/tree-decision/python/letsplot",
  "hub": "https://anyplot.ai/tree-decision",
  "code_json": "https://api.anyplot.ai/specs/tree-decision/letsplot/code",
  "spec_json": "https://api.anyplot.ai/specs/tree-decision",
  "render_light_png": "https://storage.googleapis.com/anyplot-images/plots/tree-decision/python/letsplot/plot-light.png",
  "render_dark_png": "https://storage.googleapis.com/anyplot-images/plots/tree-decision/python/letsplot/plot-dark.png",
  "interactive_light_html": "https://storage.googleapis.com/anyplot-images/plots/tree-decision/python/letsplot/plot-light.html",
  "interactive_dark_html": "https://storage.googleapis.com/anyplot-images/plots/tree-decision/python/letsplot/plot-dark.html",
  "quality_score": 87.0,
  "license": "MIT",
  "guide": "https://anyplot.ai/llms.txt"
}
Part of Decision Tree Visualization with Probabilities on anyplot.ai.