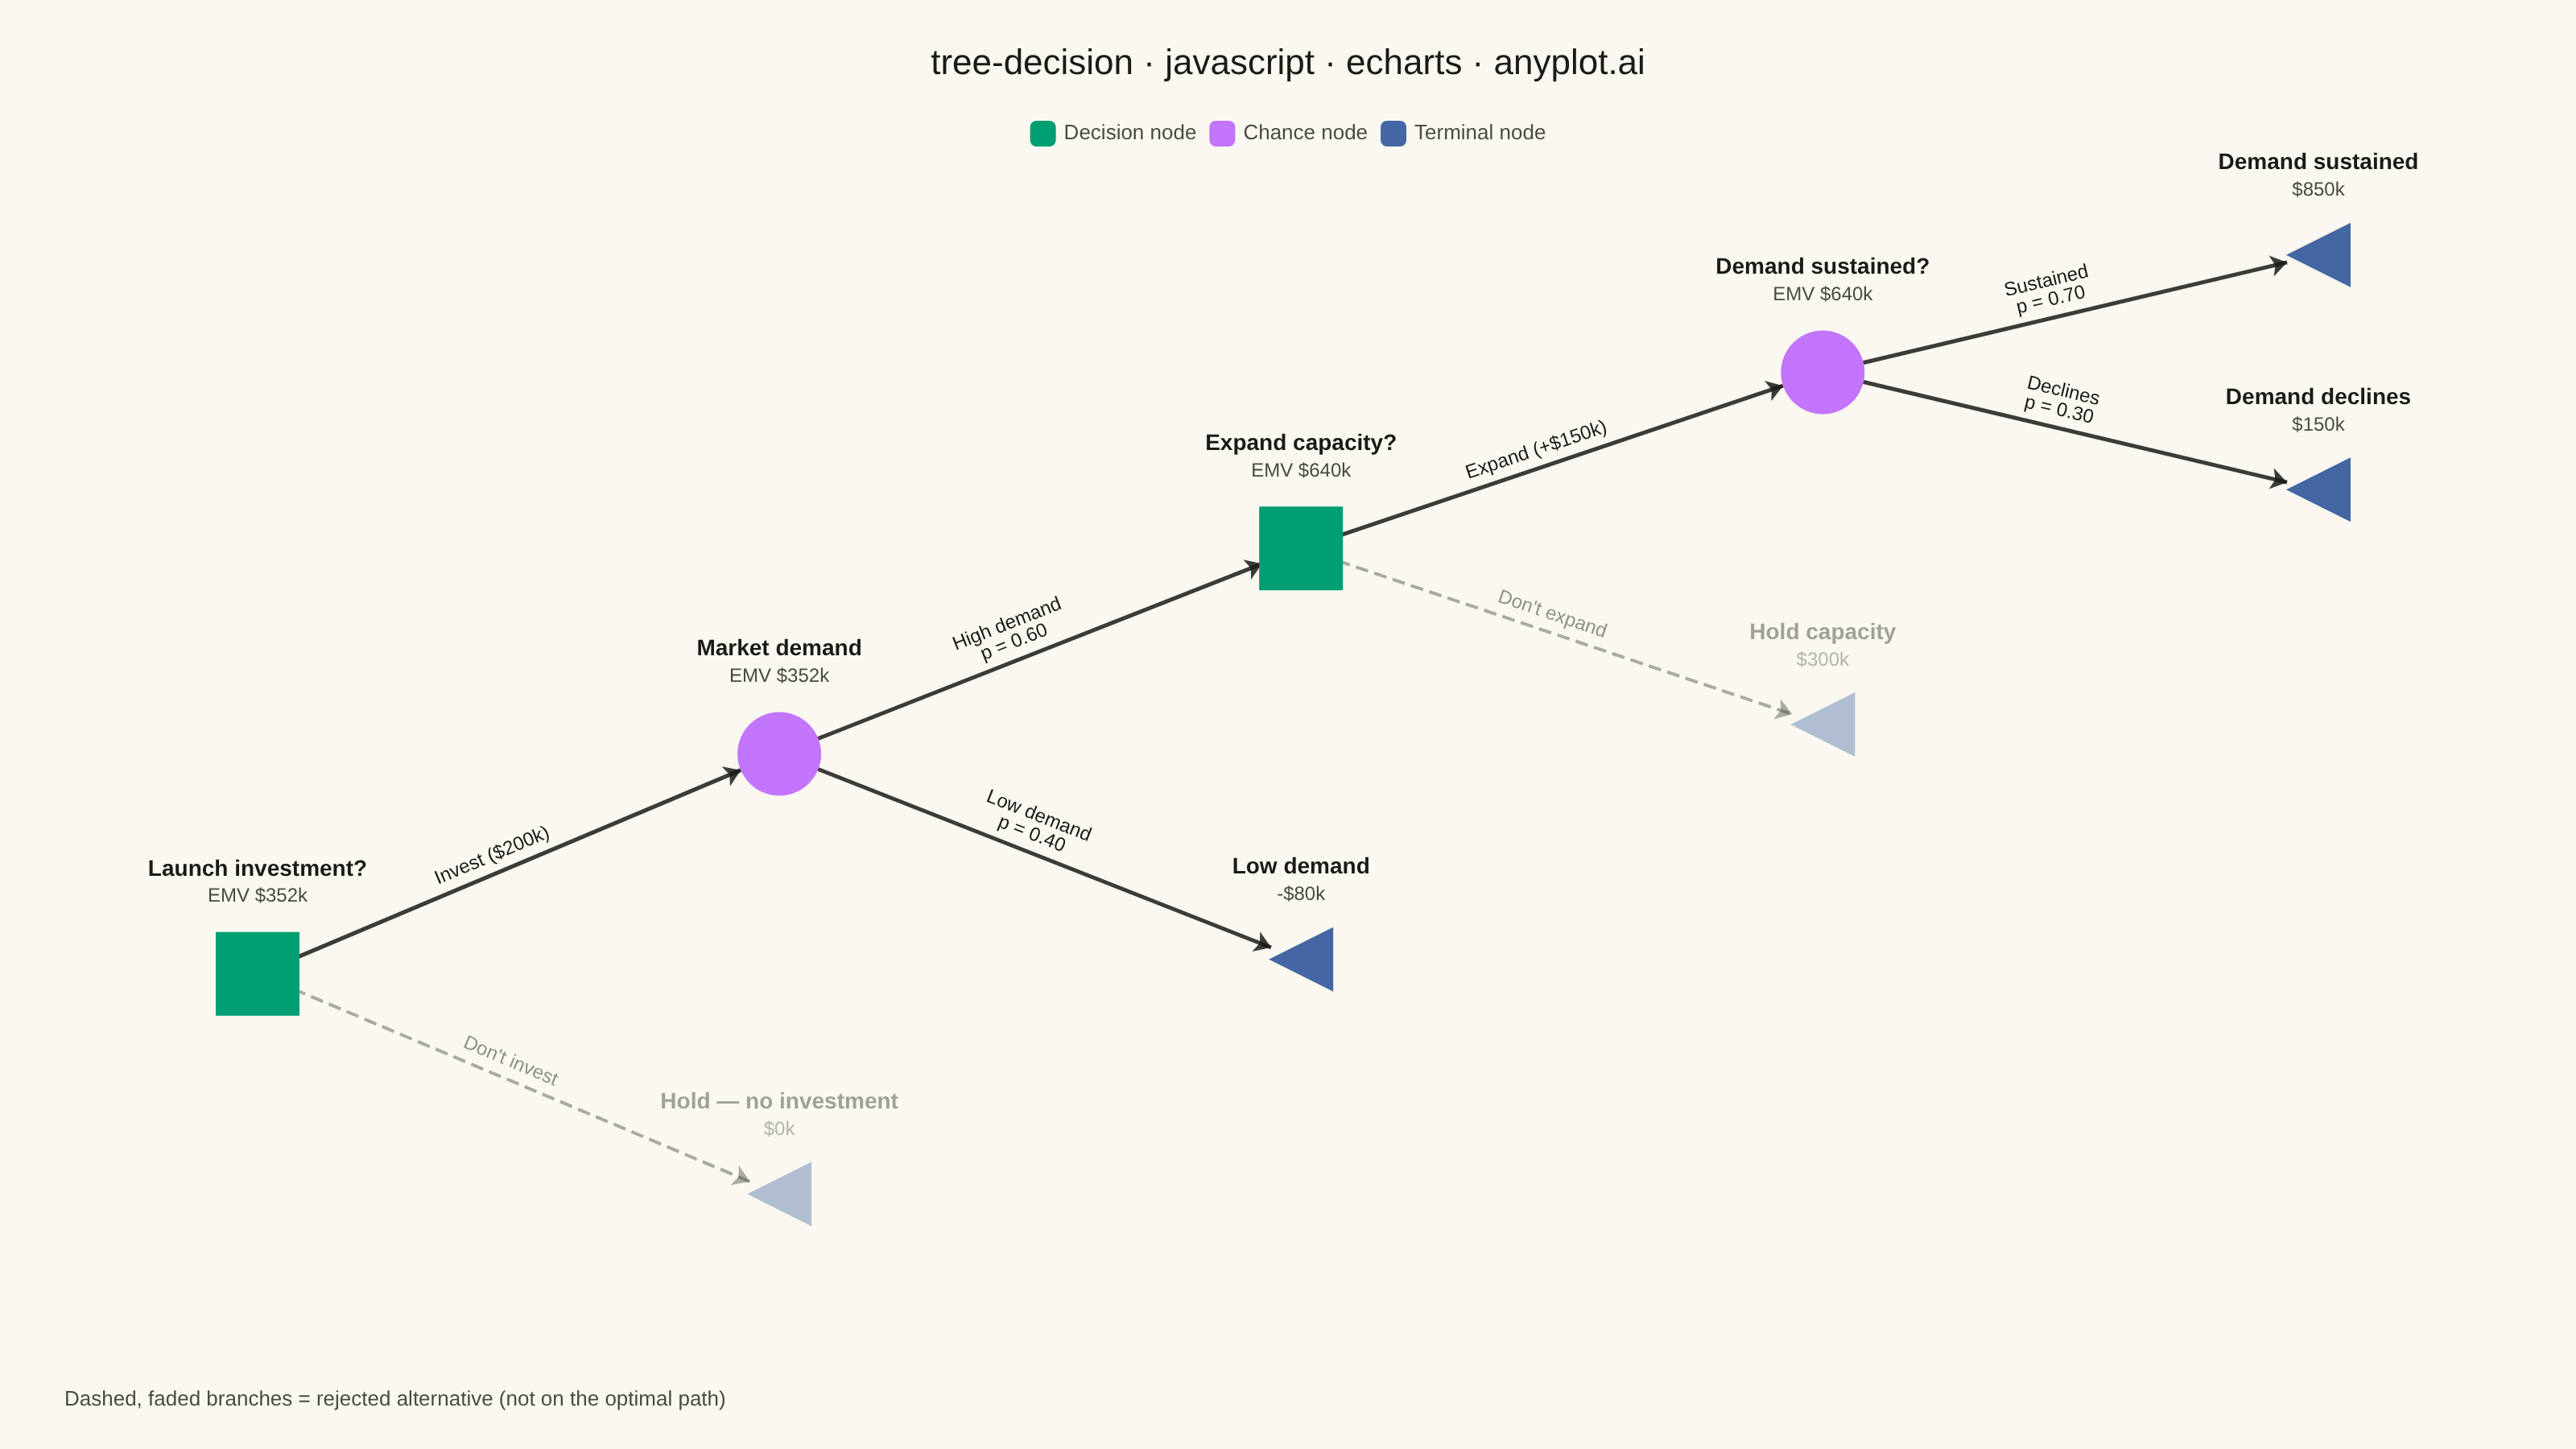
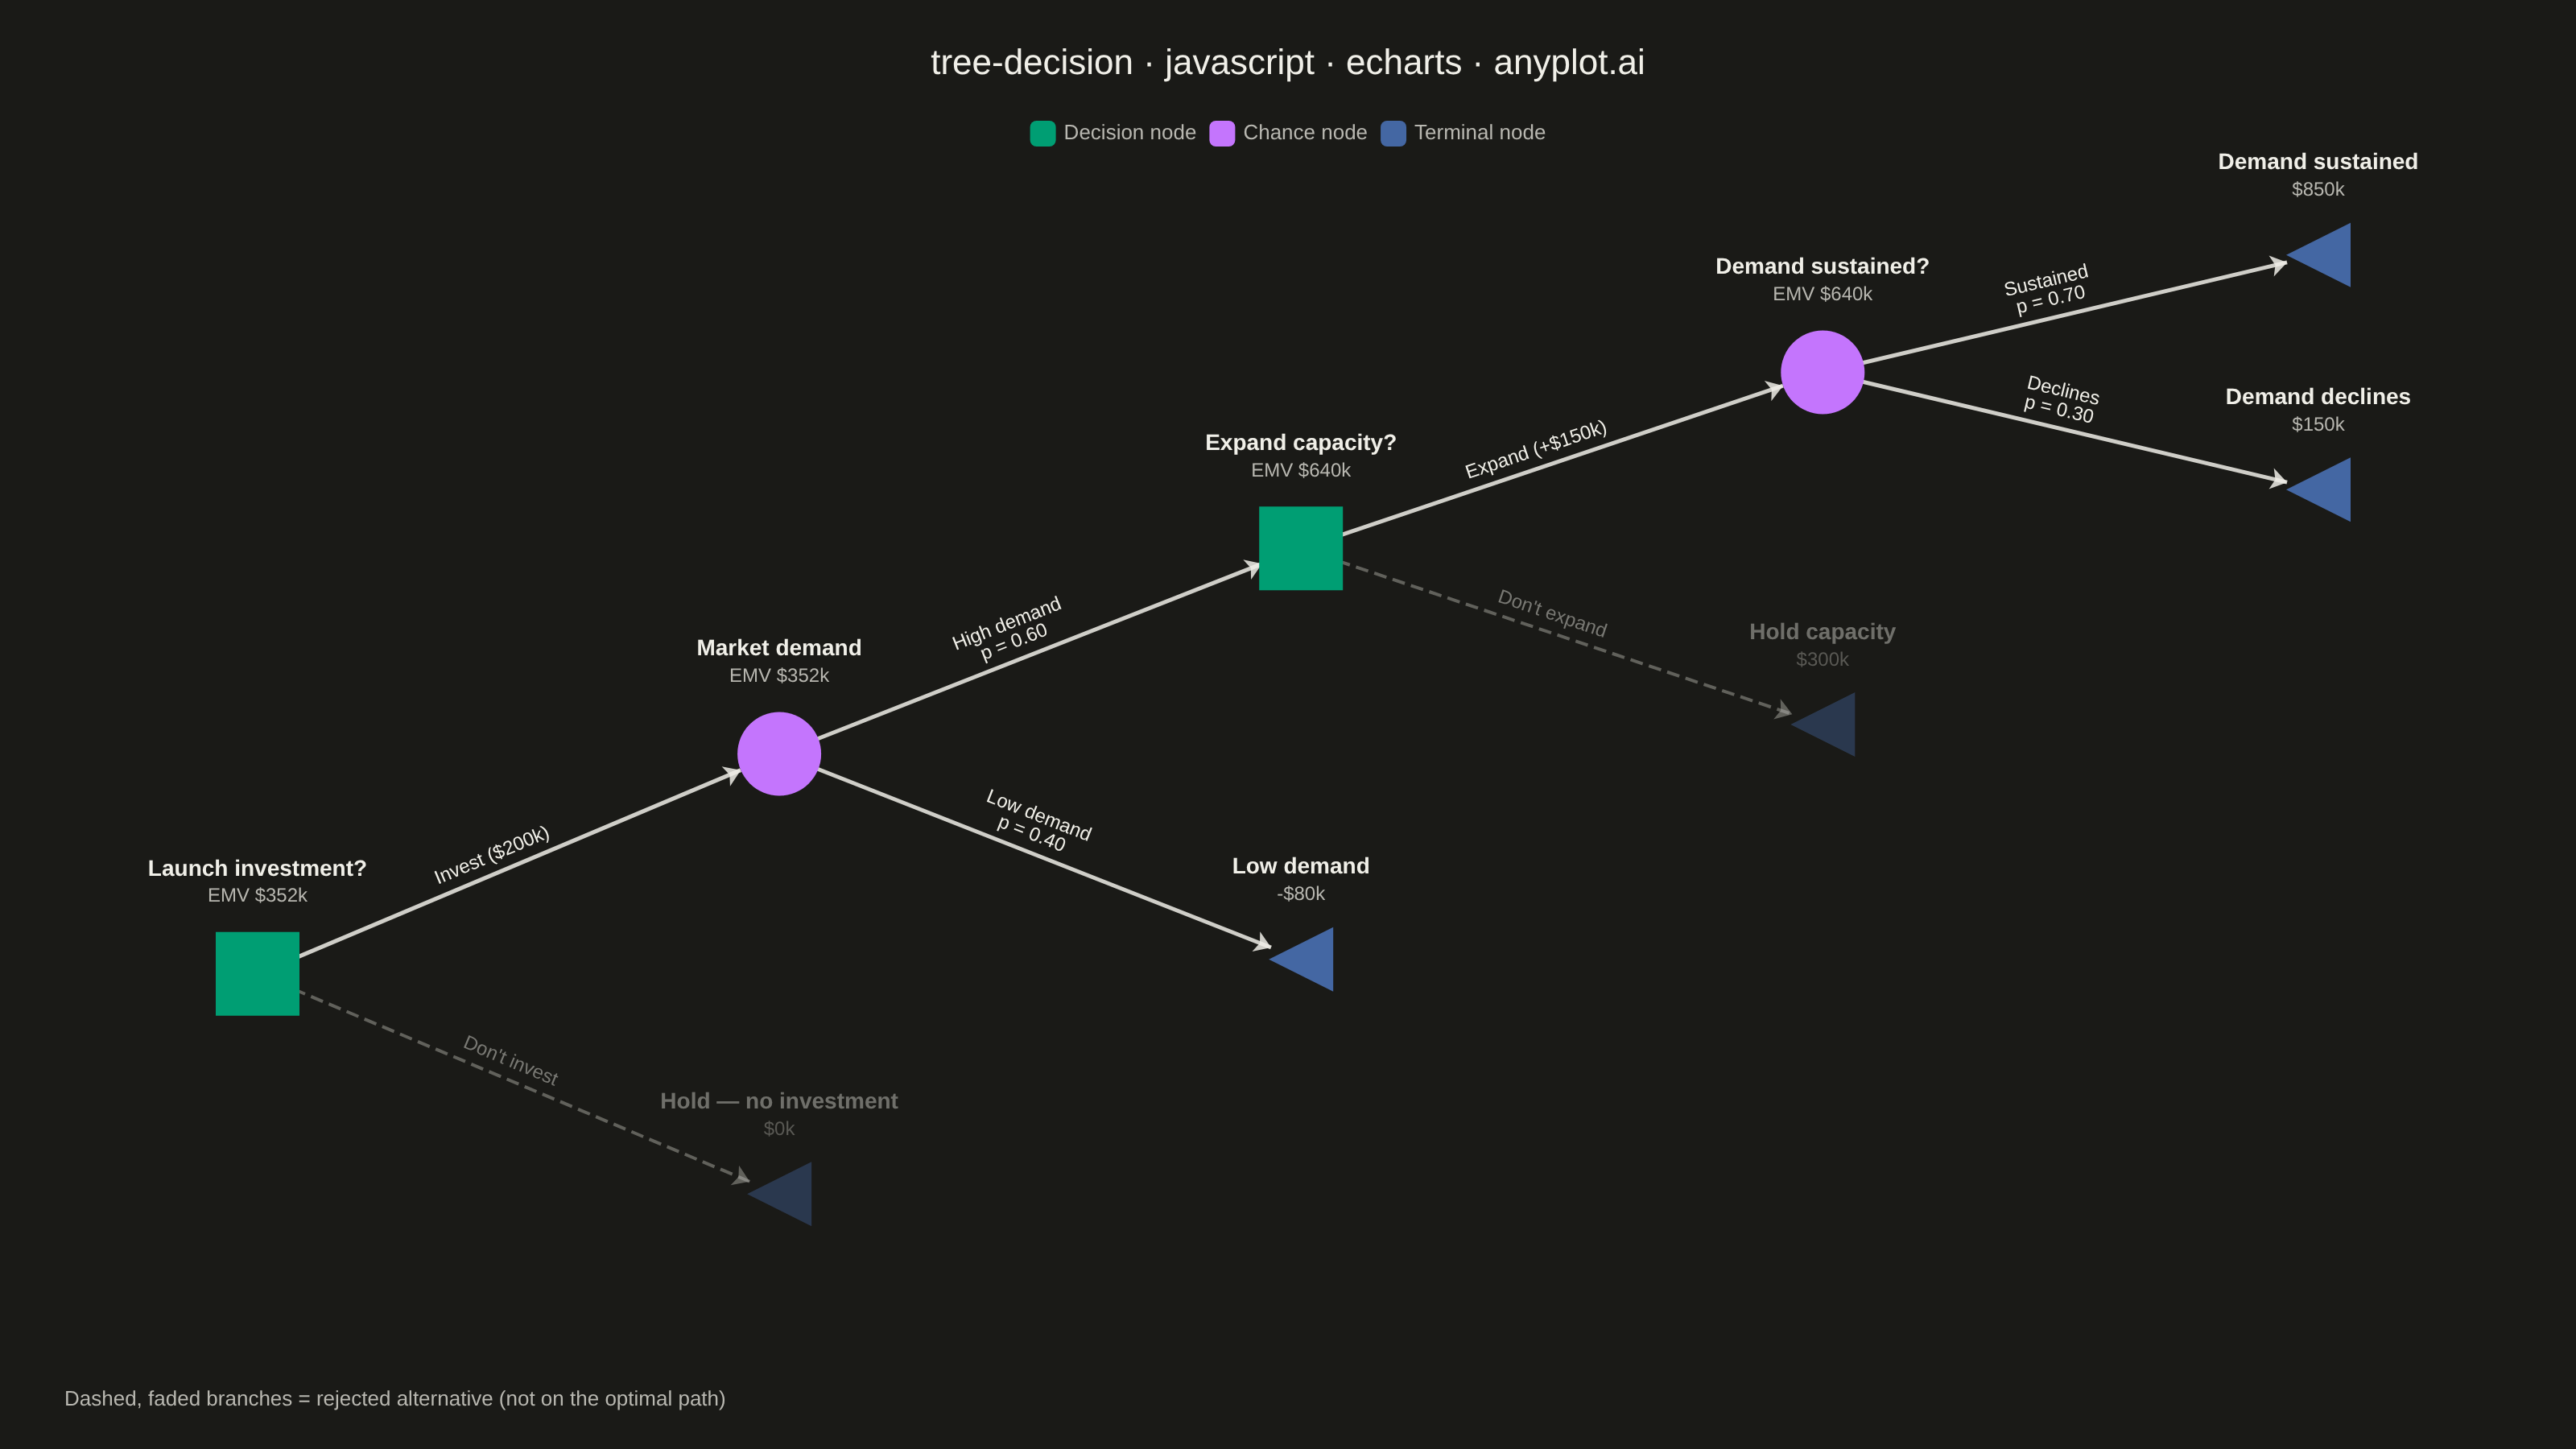
The same plot in 14 other libraries — JavaScript: Chart.js, D3.js, Highcharts, MUI X Charts; Python: Altair, Bokeh, lets-plot, Matplotlib, Plotly, plotnine, Pygal, Seaborn; R: ggplot2; Julia: Makie.jl. Compare all 15 side by side: Decision Tree Visualization with Probabilities in Python, R, Julia and JavaScript.
A tree-structured diagram for sequential decision analysis, displaying decision nodes (squares), chance nodes (circles), and terminal outcome nodes (triangles) connected by branching paths. Each chance branch is labeled with probabilities, terminal nodes show payoff values, and Expected Monetary Values (EMV) are calculated via rollback at each node. Rejected (pruned) branches are visually marked, making it easy to trace the optimal decision path through a multi-stage problem.
// anyplot.ai
// tree-decision: Decision Tree Visualization with Probabilities
// Library: echarts 6.1.0 | JavaScript 22.23.2
// Quality: 92/100 | Created: 2026-08-26

const t = window.ANYPLOT_TOKENS;
const W = window.ANYPLOT_SIZE.width;
const H = window.ANYPLOT_SIZE.height;

// --- Data: a two-stage product-launch investment decision -------------------
// Mirrors the spec's node schema directly (node_id/node_type/parent_id/
// branch_label/probability/payoff/emv/pruned), values in $ thousands. EMV is
// rolled back from the terminal payoffs: at each chance node it's the
// probability-weighted average of its children; at each decision node it's
// the max EMV among its option children (the losing option is "pruned").
const records = [
  { node_id: "d1", node_type: "decision", parent_id: null, name: "Launch investment?", branch_label: null, probability: null, payoff: null, emv: 352, pruned: false },
  { node_id: "t_hold", node_type: "terminal", parent_id: "d1", name: "Hold — no investment", branch_label: "Don't invest", probability: null, payoff: 0, emv: null, pruned: true },
  { node_id: "c1", node_type: "chance", parent_id: "d1", name: "Market demand", branch_label: "Invest ($200k)", probability: null, payoff: null, emv: 352, pruned: false },
  { node_id: "t_low", node_type: "terminal", parent_id: "c1", name: "Low demand", branch_label: "Low demand", probability: 0.4, payoff: -80, emv: null, pruned: false },
  { node_id: "d2", node_type: "decision", parent_id: "c1", name: "Expand capacity?", branch_label: "High demand", probability: 0.6, payoff: null, emv: 640, pruned: false },
  { node_id: "t_noexp", node_type: "terminal", parent_id: "d2", name: "Hold capacity", branch_label: "Don't expand", probability: null, payoff: 300, emv: null, pruned: true },
  { node_id: "c2", node_type: "chance", parent_id: "d2", name: "Demand sustained?", branch_label: "Expand (+$150k)", probability: null, payoff: null, emv: 640, pruned: false },
  { node_id: "t_decline", node_type: "terminal", parent_id: "c2", name: "Demand declines", branch_label: "Declines", probability: 0.3, payoff: 150, emv: null, pruned: false },
  { node_id: "t_sustain", node_type: "terminal", parent_id: "c2", name: "Demand sustained", branch_label: "Sustained", probability: 0.7, payoff: 850, emv: null, pruned: false },
];

// --- Layout: fixed left-to-right coordinates as fractions of the mount ------
const COL = [0.08, 0.28, 0.48, 0.68, 0.87].map((f) => f * W);
const ROW = {
  d1: 0.69, t_hold: 0.84,
  c1: 0.54, t_low: 0.68,
  d2: 0.40, t_noexp: 0.52,
  c2: 0.28, t_decline: 0.36, t_sustain: 0.20,
};
const COL_OF = { d1: 0, t_hold: 1, c1: 1, t_low: 2, d2: 2, t_noexp: 3, c2: 3, t_decline: 4, t_sustain: 4 };

// --- Visual mapping per node type -------------------------------------------
const SYMBOL = { decision: "rect", chance: "circle", terminal: "triangle" };
const SIZE = { decision: 52, chance: 52, terminal: [40, 40] };
const CATEGORY = { decision: 0, chance: 1, terminal: 2 };
const money = (v) => `${v < 0 ? "-" : ""}$${Math.abs(v)}k`;

const nodes = records.map((r) => ({
  id: r.node_id,
  name: r.name,
  x: COL[COL_OF[r.node_id]],
  y: ROW[r.node_id] * H,
  symbol: SYMBOL[r.node_type],
  symbolSize: SIZE[r.node_type],
  symbolRotate: r.node_type === "terminal" ? 90 : 0, // right-pointing triangle
  category: CATEGORY[r.node_type],
  itemStyle: { color: t.palette[CATEGORY[r.node_type]], opacity: r.pruned ? 0.4 : 1 },
  label: {
    show: true,
    position: "top",
    distance: r.node_type === "terminal" ? 12 : 14,
    formatter: r.node_type === "terminal" ? `{name|${r.name}}\n{val|${money(r.payoff)}}` : `{name|${r.name}}\n{val|EMV ${money(r.emv)}}`,
    rich: {
      name: { color: t.ink, fontSize: 14, fontWeight: 600, lineHeight: 18, align: "center" },
      val: { color: t.inkSoft, fontSize: 12, lineHeight: 16, align: "center" },
    },
  },
  record: r,
}));

const byId = Object.fromEntries(records.map((r) => [r.node_id, r]));
const links = records
  .filter((r) => r.parent_id !== null)
  .map((r) => {
    const branchText = r.probability !== null ? `${r.branch_label}\np = ${r.probability.toFixed(2)}` : r.branch_label;
    return {
      source: r.parent_id,
      target: r.node_id,
      lineStyle: {
        color: r.pruned ? t.inkSoft : t.ink,
        width: r.pruned ? 2 : 2.5,
        type: r.pruned ? "dashed" : "solid",
        opacity: r.pruned ? 0.45 : 0.85,
        curveness: 0,
      },
      label: {
        show: true,
        formatter: branchText,
        fontSize: 12,
        color: r.pruned ? t.inkSoft : t.ink,
        opacity: r.pruned ? 0.6 : 1,
      },
    };
  });

// --- Init ---------------------------------------------------------------------
const chart = echarts.init(document.getElementById("container"));
chart.on("finished", () => {
  window.__anyplotReady = true;
});

// --- Option ---------------------------------------------------------------
chart.setOption({
  animation: false,
  color: t.palette,
  backgroundColor: "transparent",
  title: {
    text: "tree-decision · javascript · echarts · anyplot.ai",
    left: "center",
    top: 24,
    textStyle: { color: t.ink, fontSize: 22, fontWeight: 500 },
  },
  legend: {
    data: ["Decision node", "Chance node", "Terminal node"],
    top: 70,
    left: "center",
    textStyle: { color: t.inkSoft, fontSize: 13 },
    itemWidth: 16,
    itemHeight: 16,
  },
  graphic: [
    {
      type: "text",
      left: 40,
      bottom: 24,
      style: {
        text: "Dashed, faded branches = rejected alternative (not on the optimal path)",
        fill: t.inkSoft,
        fontSize: 13,
      },
    },
  ],
  series: [
    {
      type: "graph",
      layout: "none",
      coordinateSystem: undefined,
      roam: false,
      data: nodes,
      links: links,
      categories: [
        { name: "Decision node", itemStyle: { color: t.palette[0] } },
        { name: "Chance node", itemStyle: { color: t.palette[1] } },
        { name: "Terminal node", itemStyle: { color: t.palette[2] } },
      ],
      edgeSymbol: ["none", "arrow"],
      edgeSymbolSize: [0, 10],
      label: { show: true },
      emphasis: { disabled: true },
    },
  ],
});
Runnable source as JSON, for any HTTP client: https://api.anyplot.ai/specs/tree-decision/echarts/code. Any spec id and library id listed in llms-full.txt fit the same URL shape; every URL below is complete and callable.
{
  "spec_id": "tree-decision",
  "language": "javascript",
  "library": "echarts",
  "page": "https://anyplot.ai/tree-decision/javascript/echarts",
  "hub": "https://anyplot.ai/tree-decision",
  "code_json": "https://api.anyplot.ai/specs/tree-decision/echarts/code",
  "spec_json": "https://api.anyplot.ai/specs/tree-decision",
  "render_light_png": "https://storage.googleapis.com/anyplot-images/plots/tree-decision/javascript/echarts/plot-light.png",
  "render_dark_png": "https://storage.googleapis.com/anyplot-images/plots/tree-decision/javascript/echarts/plot-dark.png",
  "interactive_light_html": "https://storage.googleapis.com/anyplot-images/plots/tree-decision/javascript/echarts/plot-light.html",
  "interactive_dark_html": "https://storage.googleapis.com/anyplot-images/plots/tree-decision/javascript/echarts/plot-dark.html",
  "quality_score": 92.0,
  "license": "MIT",
  "guide": "https://anyplot.ai/llms.txt"
}
Part of Decision Tree Visualization with Probabilities on anyplot.ai.