The same plot in 14 other libraries — JavaScript: Chart.js, Apache ECharts, Highcharts, MUI X Charts; Python: Altair, Bokeh, lets-plot, Matplotlib, Plotly, plotnine, Pygal, Seaborn; R: ggplot2; Julia: Makie.jl. Compare all 15 side by side: Decision Tree Visualization with Probabilities in Python, R, Julia and JavaScript.
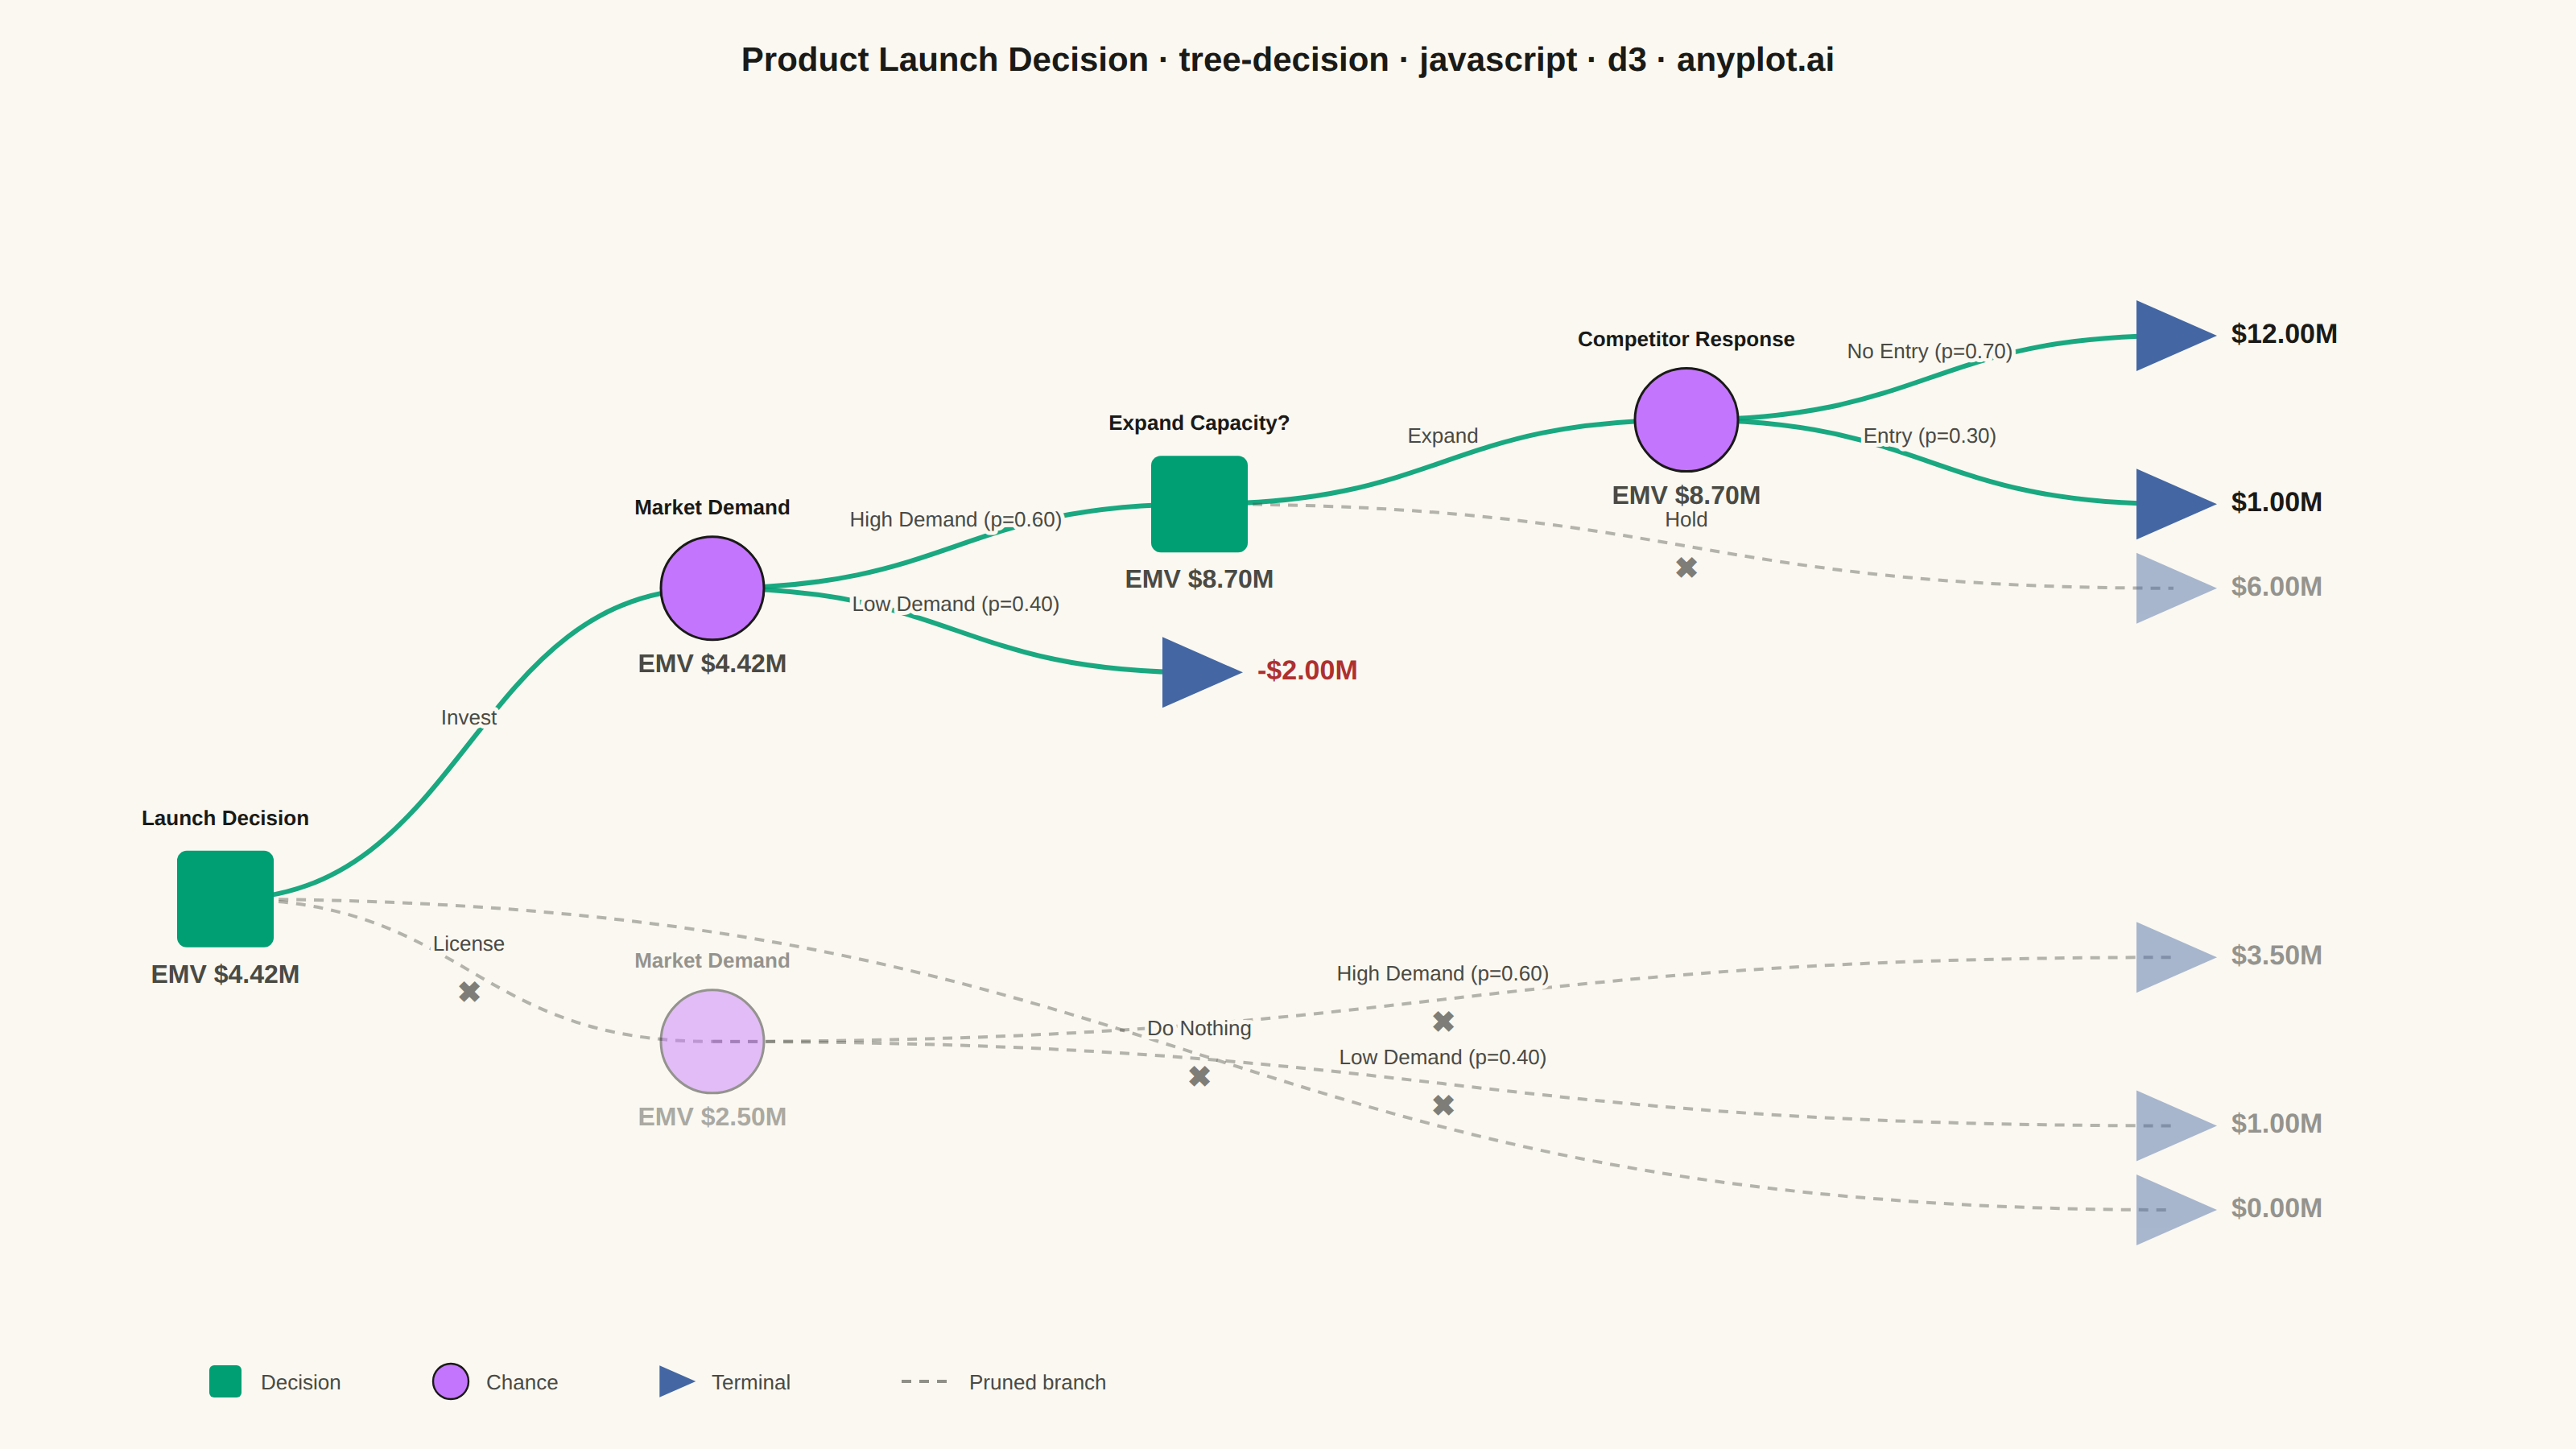
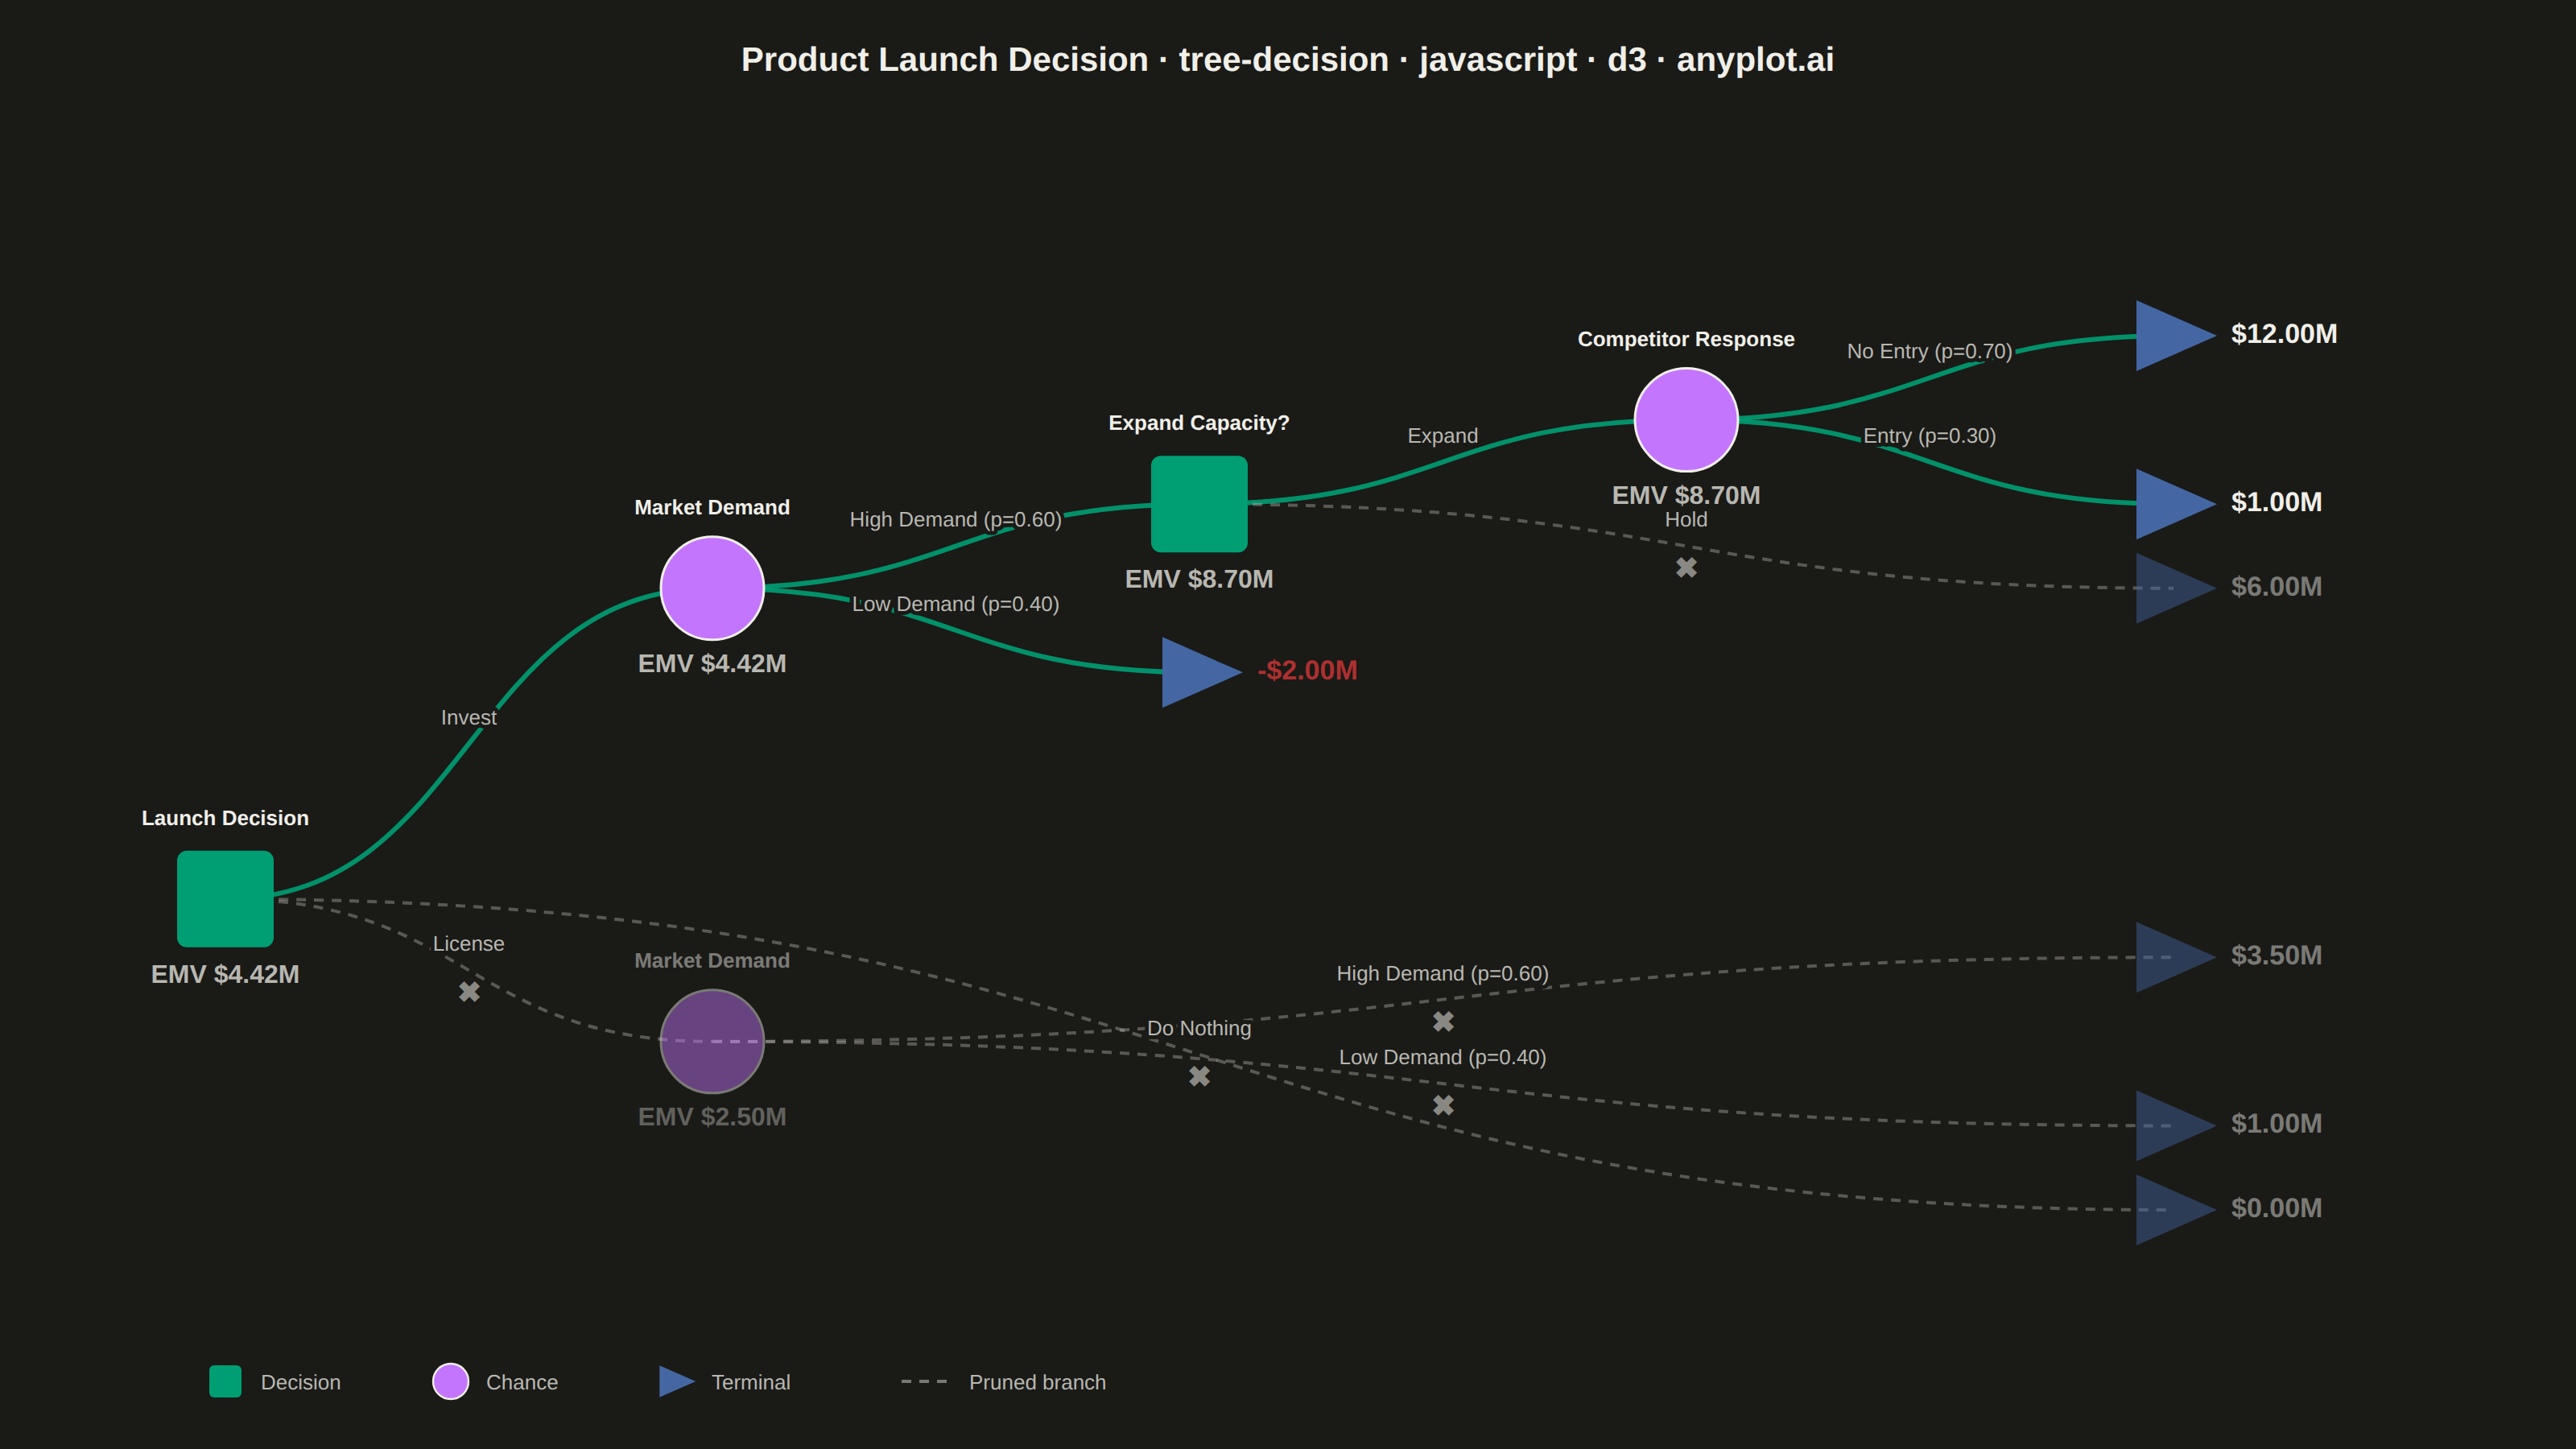
A tree-structured diagram for sequential decision analysis, displaying decision nodes (squares), chance nodes (circles), and terminal outcome nodes (triangles) connected by branching paths. Each chance branch is labeled with probabilities, terminal nodes show payoff values, and Expected Monetary Values (EMV) are calculated via rollback at each node. Rejected (pruned) branches are visually marked, making it easy to trace the optimal decision path through a multi-stage problem.
// anyplot.ai
// tree-decision: Decision Tree Visualization with Probabilities
// Library: d3 7.9.0 | JavaScript 22.23.2
// Quality: 89/100 | Created: 2026-08-26

const t = window.ANYPLOT_TOKENS;
const { width, height } = window.ANYPLOT_SIZE;
const margin = { top: 120, right: 250, bottom: 60, left: 140 };
const iw = width - margin.left - margin.right;
const ih = height - margin.top - margin.bottom;

// --- Data: two-stage product-launch decision (in $ millions) ---------------
// Rollback EMVs are pre-computed: C3 = 0.7*12.0 + 0.3*1.0 = 8.7,
// D1 = max(Expand=8.7, Hold=6.0) = 8.7, C1 = 0.6*8.7 + 0.4*(-2.0) = 4.42,
// C2 = 0.6*3.5 + 0.4*1.0 = 2.5, D0 = max(Invest=4.42, License=2.5, DoNothing=0) = 4.42.
const treeData = {
  id: "D0",
  type: "decision",
  label: "Launch Decision",
  emv: 4.42,
  children: [
    {
      id: "C1",
      type: "chance",
      label: "Market Demand",
      branchLabel: "Invest",
      emv: 4.42,
      pruned: false,
      children: [
        {
          id: "D1",
          type: "decision",
          label: "Expand Capacity?",
          branchLabel: "High Demand",
          probability: 0.6,
          emv: 8.7,
          pruned: false,
          children: [
            {
              id: "C3",
              type: "chance",
              label: "Competitor Response",
              branchLabel: "Expand",
              emv: 8.7,
              pruned: false,
              children: [
                { id: "T5", type: "terminal", branchLabel: "No Entry", probability: 0.7, payoff: 12.0, pruned: false },
                { id: "T6", type: "terminal", branchLabel: "Entry", probability: 0.3, payoff: 1.0, pruned: false },
              ],
            },
            { id: "T4", type: "terminal", branchLabel: "Hold", payoff: 6.0, pruned: true },
          ],
        },
        { id: "T3", type: "terminal", branchLabel: "Low Demand", probability: 0.4, payoff: -2.0, pruned: false },
      ],
    },
    {
      id: "C2",
      type: "chance",
      label: "Market Demand",
      branchLabel: "License",
      emv: 2.5,
      pruned: true,
      children: [
        { id: "T1", type: "terminal", branchLabel: "High Demand", probability: 0.6, payoff: 3.5, pruned: true },
        { id: "T2", type: "terminal", branchLabel: "Low Demand", probability: 0.4, payoff: 1.0, pruned: true },
      ],
    },
    { id: "T0", type: "terminal", branchLabel: "Do Nothing", payoff: 0.0, pruned: true },
  ],
};

// --- Layout -------------------------------------------------------------
const root = d3.hierarchy(treeData);
d3.tree()
  .size([ih, iw])
  .separation((a, b) => (a.parent === b.parent ? 1.3 : 2.2))(root);
for (const d of root.descendants()) {
  d.px = margin.left + d.y;
  d.py = margin.top + d.x;
}
// Pruned branches that terminate early (License -> High/Low Demand, Do Nothing) stop
// 1-3 levels short of the deepest live path (Invest -> Expand -> Competitor Response),
// leaving the lower-right quadrant of the canvas empty. Stretch those terminals to the
// same right edge as the deepest branch so pruned and live paths both use the full width.
for (const d of root.descendants()) {
  if (d.data.type === "terminal" && d.data.pruned) d.px = margin.left + iw;
}

// --- Shape geometry -------------------------------------------------------
const SQ = 30; // decision square half-side
const CR = 32; // chance circle radius
const trianglePath = (cx, cy) => `M ${cx - 23},${cy - 22} L ${cx - 23},${cy + 22} L ${cx + 27},${cy} Z`;

const fmt = (v) => `${v < 0 ? "-$" : "$"}${Math.abs(v).toFixed(2)}M`;

// --- SVG mount --------------------------------------------------------------
const svg = d3.select("#container").append("svg").attr("width", width).attr("height", height);

// --- Links (branches) --------------------------------------------------------
const linkGen = d3.linkHorizontal().x((d) => d.px).y((d) => d.py);
const linkLayer = svg.append("g");

linkLayer
  .selectAll("path.branch")
  .data(root.links())
  .join("path")
  .attr("class", "branch")
  .attr("fill", "none")
  .attr("d", linkGen)
  .attr("stroke", (l) => (l.target.data.pruned ? t.inkSoft : t.palette[0]))
  .attr("stroke-width", (l) => (l.target.data.pruned ? 2 : 3))
  .attr("stroke-dasharray", (l) => (l.target.data.pruned ? "6,5" : null))
  .attr("opacity", (l) => (l.target.data.pruned ? 0.4 : 0.9));

// Branch labels (option name for decision branches, probability for chance branches).
// A page-bg halo keeps the label legible where the link curve bows steeply near the
// midpoint — a fixed vertical offset alone isn't enough clearance on those branches.
linkLayer
  .selectAll("text.branch-label")
  .data(root.links())
  .join("text")
  .attr("class", "branch-label")
  .attr("x", (l) => (l.source.px + l.target.px) / 2)
  .attr("y", (l) => (l.source.py + l.target.py) / 2 - 12)
  .attr("text-anchor", "middle")
  .attr("paint-order", "stroke")
  .attr("stroke", t.pageBg)
  .attr("stroke-width", 5)
  .attr("stroke-linejoin", "round")
  .style("font-size", "13px")
  .style("font-weight", "500")
  .attr("fill", t.inkSoft)
  .text((l) => {
    const d = l.target.data;
    return d.probability != null ? `${d.branchLabel} (p=${d.probability.toFixed(2)})` : d.branchLabel;
  });

// Cross mark on pruned branches
linkLayer
  .selectAll("text.prune-mark")
  .data(root.links().filter((l) => l.target.data.pruned))
  .join("text")
  .attr("class", "prune-mark")
  .attr("x", (l) => (l.source.px + l.target.px) / 2)
  .attr("y", (l) => (l.source.py + l.target.py) / 2 + 20)
  .attr("text-anchor", "middle")
  .style("font-size", "18px")
  .style("font-weight", "700")
  .attr("fill", t.inkSoft)
  .attr("opacity", 0.7)
  .text("✖");

// --- Nodes -------------------------------------------------------------
const nodeLayer = svg.append("g");
const node = nodeLayer
  .selectAll("g.node")
  .data(root.descendants())
  .join("g")
  .attr("class", "node")
  .attr("opacity", (d) => (d.data.pruned ? 0.45 : 1));

// Decision nodes: squares (Imprint position 1 — always brand green)
node
  .filter((d) => d.data.type === "decision")
  .append("rect")
  .attr("x", (d) => d.px - SQ)
  .attr("y", (d) => d.py - SQ)
  .attr("width", SQ * 2)
  .attr("height", SQ * 2)
  .attr("rx", 6)
  .attr("fill", t.palette[0]);

// Chance nodes: circles (Imprint position 2), with an ink stroke for contrast
node
  .filter((d) => d.data.type === "chance")
  .append("circle")
  .attr("cx", (d) => d.px)
  .attr("cy", (d) => d.py)
  .attr("r", CR)
  .attr("fill", t.palette[1])
  .attr("stroke", t.ink)
  .attr("stroke-width", 1.5);

// Terminal nodes: right-pointing triangles (Imprint position 3)
node
  .filter((d) => d.data.type === "terminal")
  .append("path")
  .attr("d", (d) => trianglePath(d.px, d.py))
  .attr("fill", t.palette[2]);

// Titles above decision/chance nodes
node
  .filter((d) => d.data.type !== "terminal")
  .append("text")
  .attr("x", (d) => d.px)
  .attr("y", (d) => d.py - CR - 14)
  .attr("text-anchor", "middle")
  .style("font-size", "13px")
  .style("font-weight", "600")
  .attr("fill", t.ink)
  .text((d) => d.data.label);

// EMV adjacent below decision/chance nodes (spec: "inside or adjacent").
// Sized up from 13px so the rollback value — the single most information-dense
// label in the diagram — still reads at the 400px mobile thumbnail scale.
node
  .filter((d) => d.data.type !== "terminal")
  .append("text")
  .attr("x", (d) => d.px)
  .attr("y", (d) => d.py + CR + 20)
  .attr("text-anchor", "middle")
  .style("font-size", "16px")
  .style("font-weight", "700")
  .attr("fill", t.inkSoft)
  .text((d) => `EMV ${fmt(d.data.emv)}`);

// Terminal payoff label to the right of the triangle tip
node
  .filter((d) => d.data.type === "terminal")
  .append("text")
  .attr("x", (d) => d.px + 36)
  .attr("y", (d) => d.py)
  .attr("dominant-baseline", "middle")
  .style("font-size", "17px")
  .style("font-weight", "700")
  .attr("fill", (d) => (d.data.payoff < 0 ? t.palette[4] : t.ink))
  .text((d) => fmt(d.data.payoff));

// --- Legend ---------------------------------------------------------------
const legend = svg.append("g").attr("transform", `translate(${margin.left}, ${height - 42})`);
const legendItems = [
  { shape: "square", fill: t.palette[0], label: "Decision" },
  { shape: "circle", fill: t.palette[1], label: "Chance" },
  { shape: "triangle", fill: t.palette[2], label: "Terminal" },
];
let lx = 0;
for (const item of legendItems) {
  const g = legend.append("g").attr("transform", `translate(${lx}, 0)`);
  if (item.shape === "square") {
    g.append("rect").attr("x", -10).attr("y", -10).attr("width", 20).attr("height", 20).attr("rx", 3).attr("fill", item.fill);
  } else if (item.shape === "circle") {
    g.append("circle").attr("r", 11).attr("fill", item.fill).attr("stroke", t.ink).attr("stroke-width", 1.2);
  } else {
    g.append("path").attr("d", trianglePath(0, 0)).attr("transform", "scale(0.45)").attr("fill", item.fill);
  }
  g.append("text").attr("x", 22).attr("y", 5).style("font-size", "13px").attr("fill", t.inkSoft).text(item.label);
  lx += 140;
}
legend
  .append("line")
  .attr("x1", lx)
  .attr("x2", lx + 32)
  .attr("y1", 0)
  .attr("y2", 0)
  .attr("stroke", t.inkSoft)
  .attr("stroke-width", 2)
  .attr("stroke-dasharray", "6,5")
  .attr("opacity", 0.6);
legend.append("text").attr("x", lx + 42).attr("y", 5).style("font-size", "13px").attr("fill", t.inkSoft).text("Pruned branch");

// --- Title ------------------------------------------------------------------
const TITLE = "Product Launch Decision · tree-decision · javascript · d3 · anyplot.ai";
const titleFontSize = Math.max(15, Math.round(22 * Math.min(1, 67 / TITLE.length)));
svg
  .append("text")
  .attr("x", width / 2)
  .attr("y", 44)
  .attr("text-anchor", "middle")
  .attr("fill", t.ink)
  .style("font-size", `${titleFontSize}px`)
  .style("font-weight", "600")
  .text(TITLE);
Runnable source as JSON, for any HTTP client: https://api.anyplot.ai/specs/tree-decision/d3/code. Any spec id and library id listed in llms-full.txt fit the same URL shape; every URL below is complete and callable.
{
  "spec_id": "tree-decision",
  "language": "javascript",
  "library": "d3",
  "page": "https://anyplot.ai/tree-decision/javascript/d3",
  "hub": "https://anyplot.ai/tree-decision",
  "code_json": "https://api.anyplot.ai/specs/tree-decision/d3/code",
  "spec_json": "https://api.anyplot.ai/specs/tree-decision",
  "render_light_png": "https://storage.googleapis.com/anyplot-images/plots/tree-decision/javascript/d3/plot-light.png",
  "render_dark_png": "https://storage.googleapis.com/anyplot-images/plots/tree-decision/javascript/d3/plot-dark.png",
  "interactive_light_html": "https://storage.googleapis.com/anyplot-images/plots/tree-decision/javascript/d3/plot-light.html",
  "interactive_dark_html": "https://storage.googleapis.com/anyplot-images/plots/tree-decision/javascript/d3/plot-dark.html",
  "quality_score": 89.0,
  "license": "MIT",
  "guide": "https://anyplot.ai/llms.txt"
}
Part of Decision Tree Visualization with Probabilities on anyplot.ai.