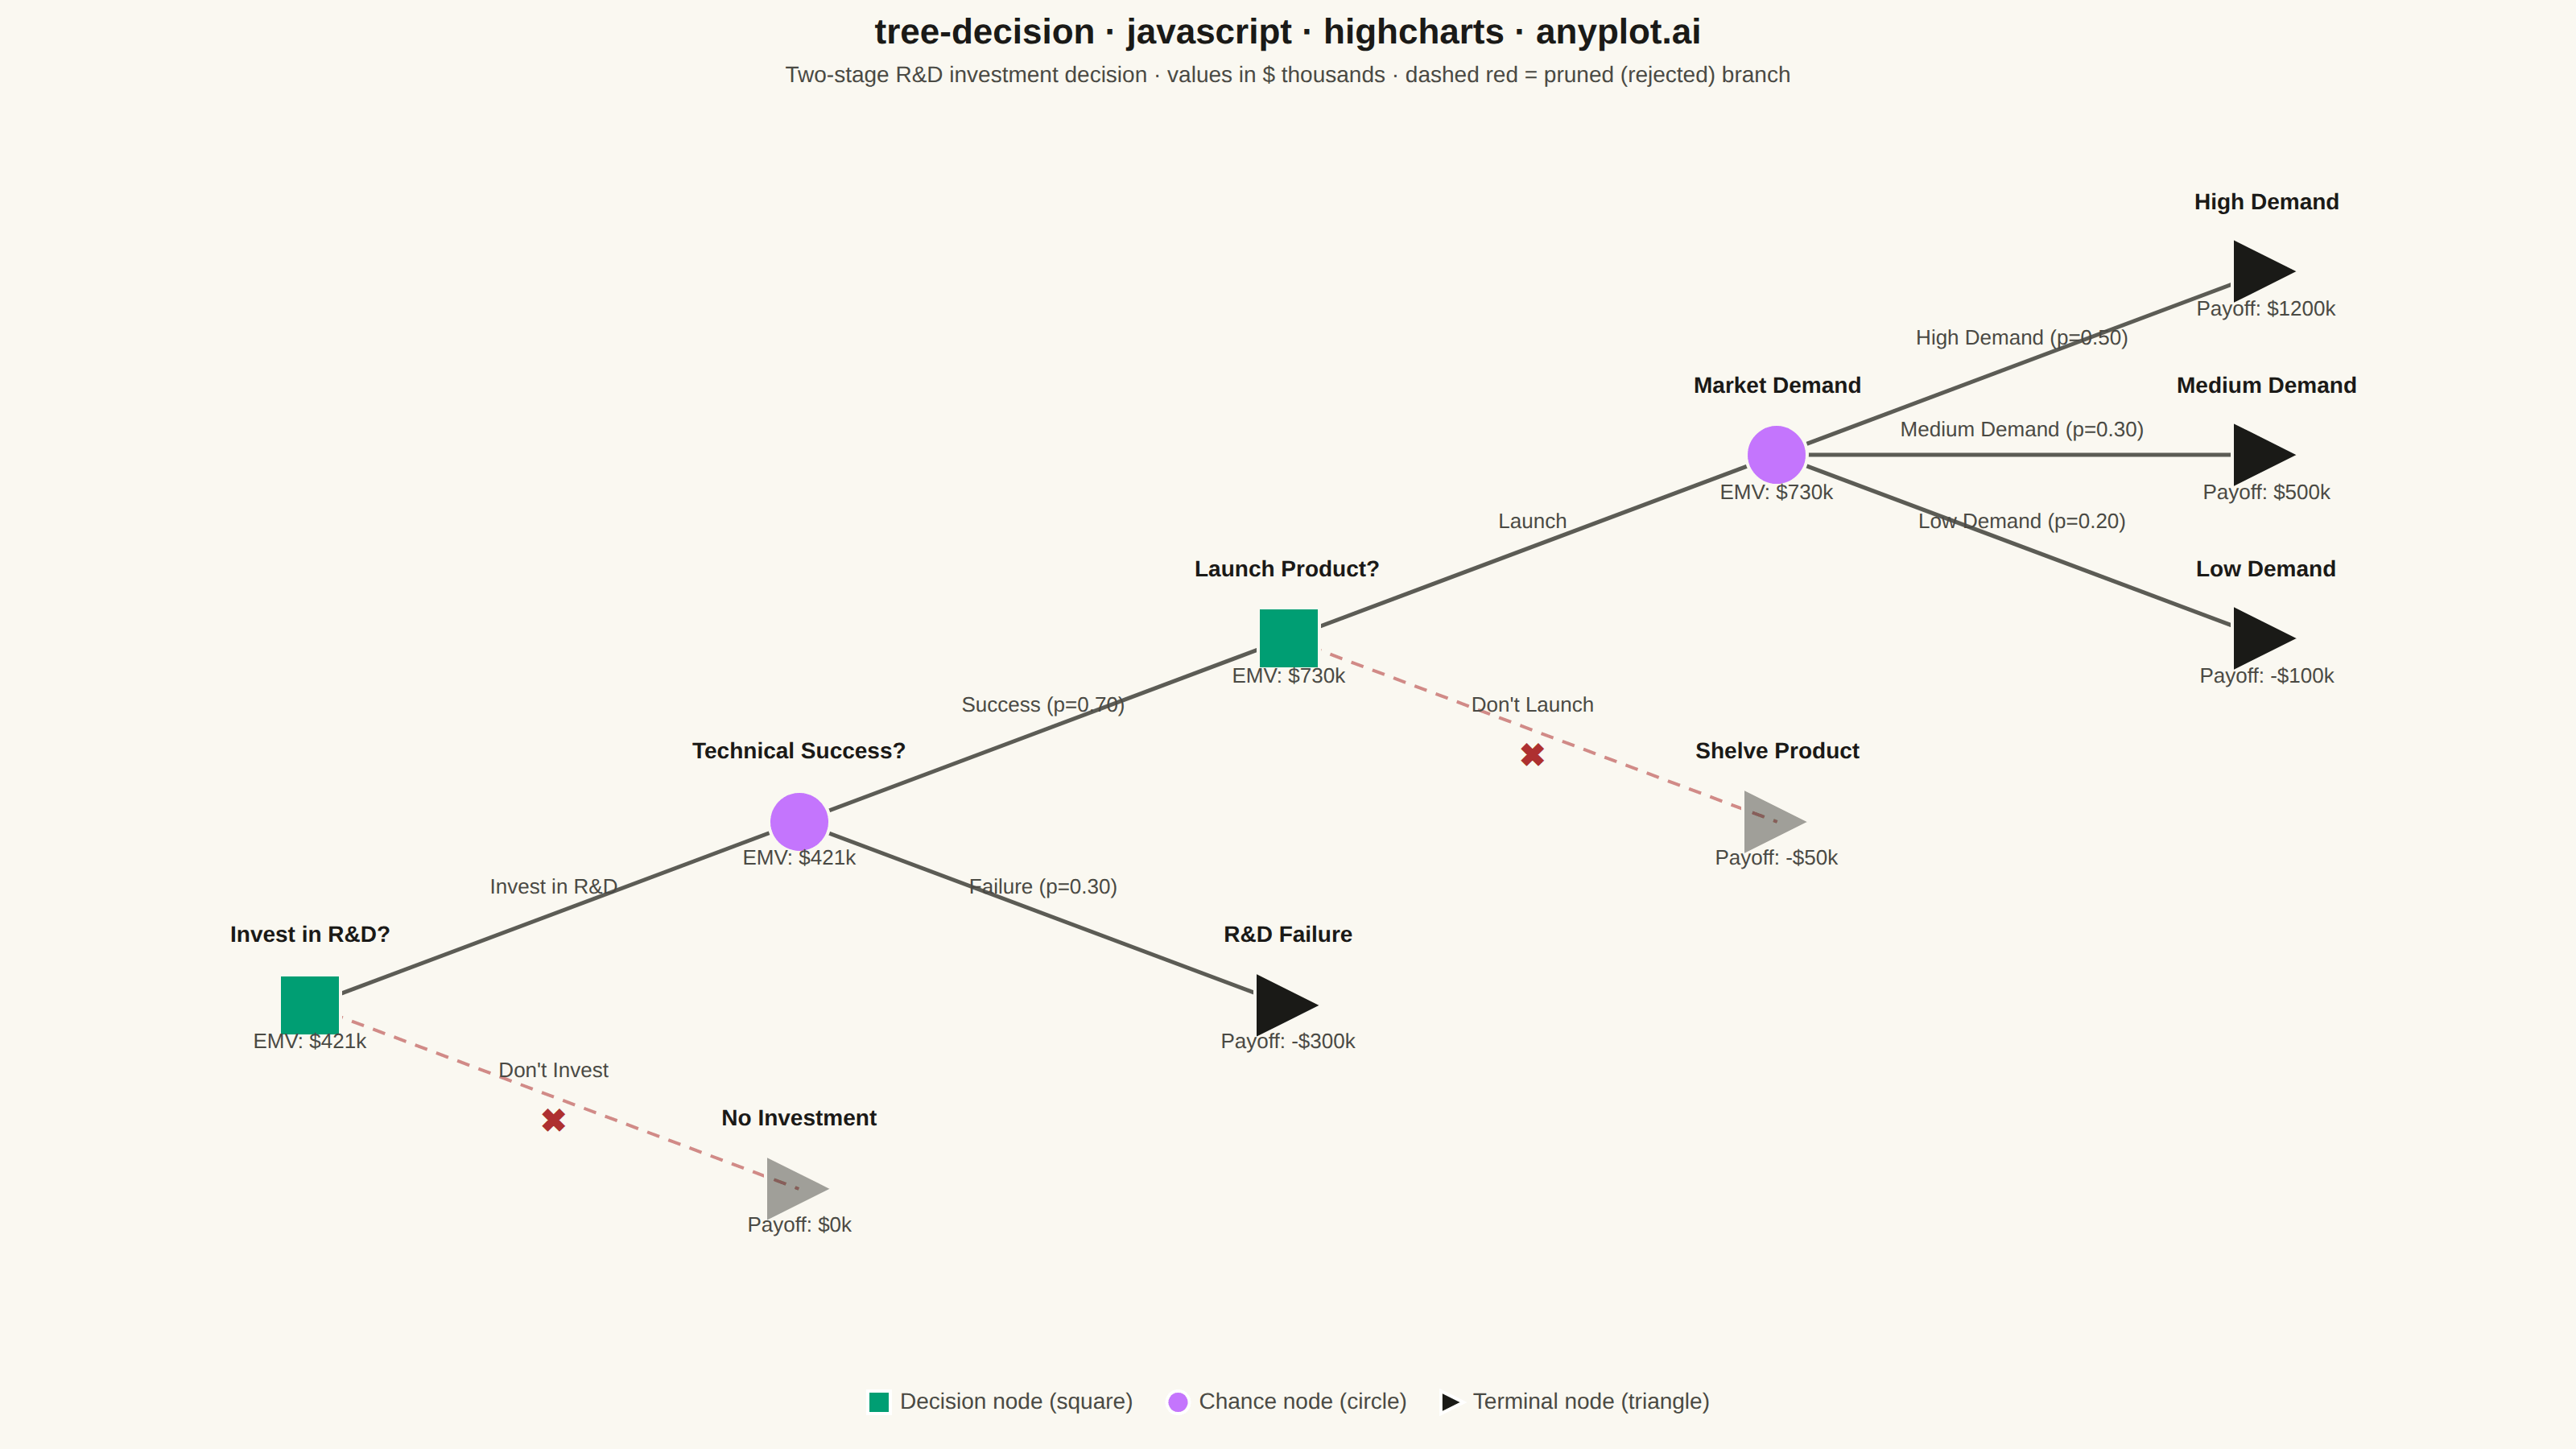
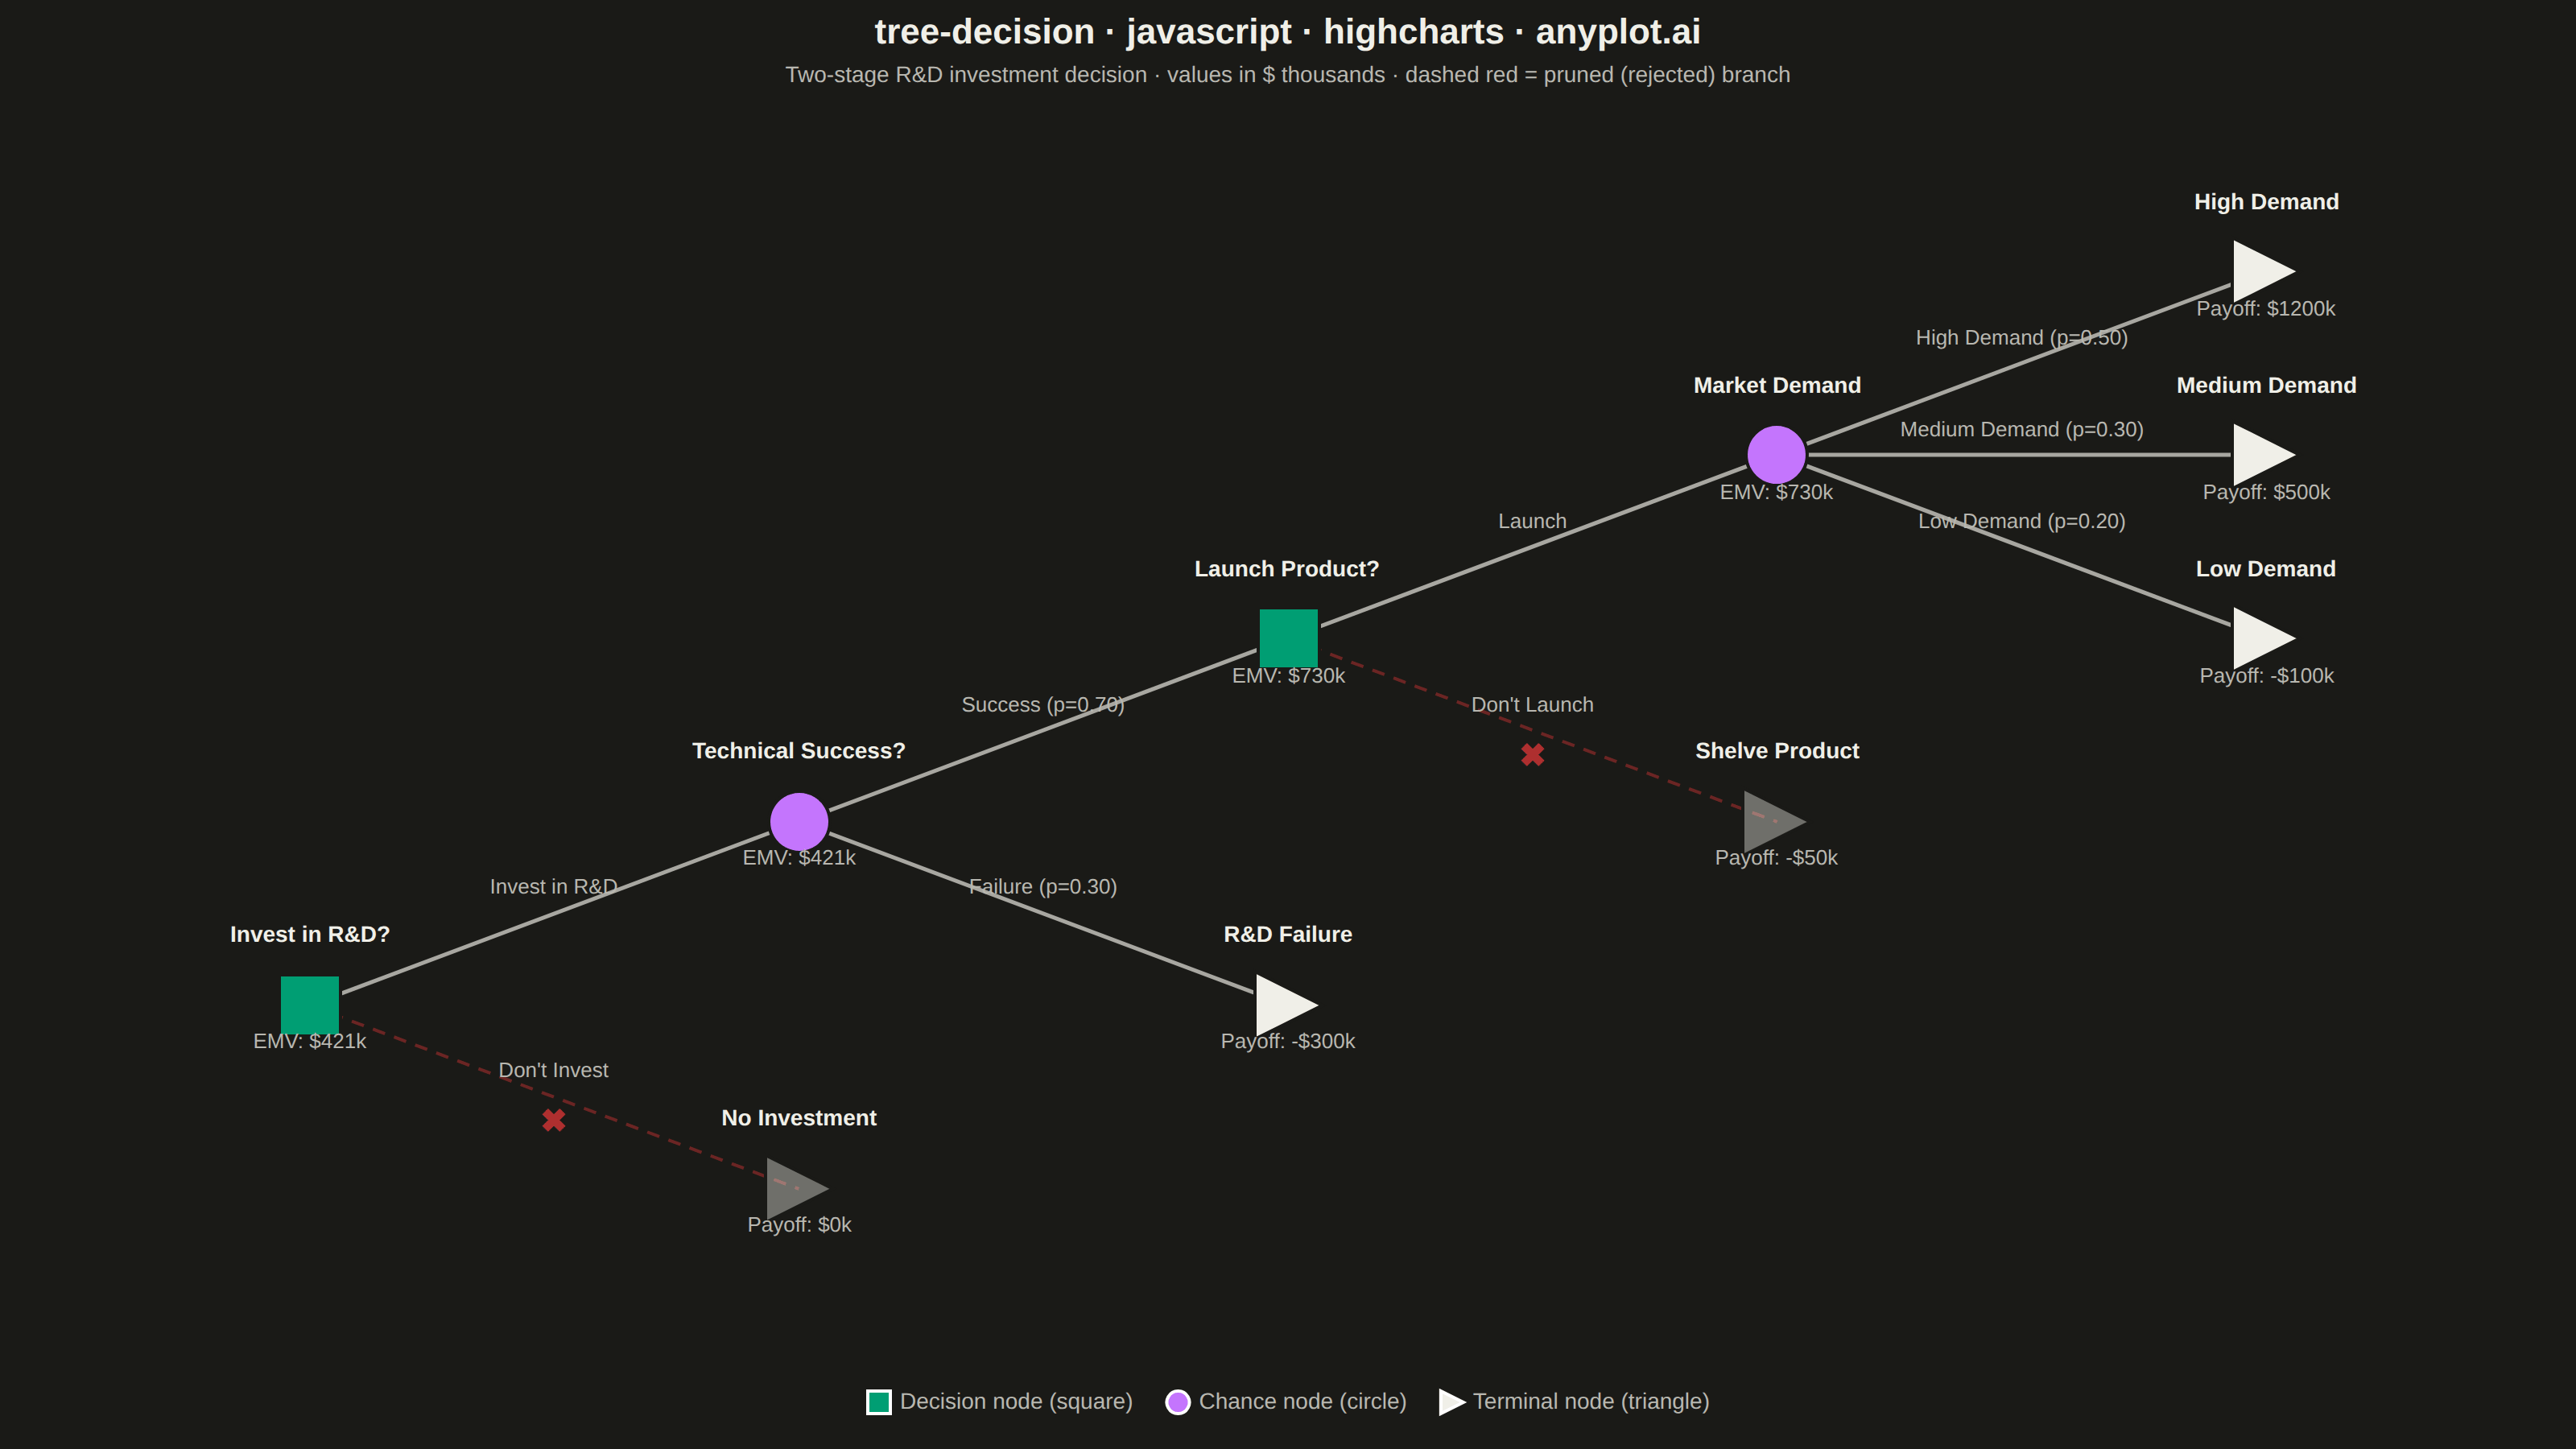
The same plot in 14 other libraries — JavaScript: Chart.js, D3.js, Apache ECharts, MUI X Charts; Python: Altair, Bokeh, lets-plot, Matplotlib, Plotly, plotnine, Pygal, Seaborn; R: ggplot2; Julia: Makie.jl. Compare all 15 side by side: Decision Tree Visualization with Probabilities in Python, R, Julia and JavaScript.
A tree-structured diagram for sequential decision analysis, displaying decision nodes (squares), chance nodes (circles), and terminal outcome nodes (triangles) connected by branching paths. Each chance branch is labeled with probabilities, terminal nodes show payoff values, and Expected Monetary Values (EMV) are calculated via rollback at each node. Rejected (pruned) branches are visually marked, making it easy to trace the optimal decision path through a multi-stage problem.
// anyplot.ai
// tree-decision: Decision Tree Visualization with Probabilities
// Library: highcharts 12.6.0 | JavaScript 22.23.2
// Quality: 92/100 | Created: 2026-08-26

const t = window.ANYPLOT_TOKENS;

// --- Custom marker symbol: terminal nodes are right-pointing triangles ------
// Highcharts core only ships an upward triangle; register a right-pointing
// variant so terminal (payoff) nodes read as "flow exits here".
Highcharts.SVGRenderer.prototype.symbols.triangleright = (x, y, w, h) => [
  "M",
  x,
  y,
  "L",
  x,
  y + h,
  "L",
  x + w,
  y + h / 2,
  "Z",
];

// --- Data: two-stage R&D investment decision (in-memory, deterministic) ----
// Coordinates are hand-laid-out tree positions: x = decision stage (0-4,
// left-to-right), y = vertical slot (rollback average of each node's
// children), matching how a decision-tree rollback is drawn by hand.
const NODES = [
  {
    id: "root",
    type: "decision",
    parentId: null,
    name: "Invest in R&D?",
    branchLabel: null,
    probability: null,
    payoff: null,
    emv: 421,
    pruned: false,
    x: 0,
    y: 1,
  },
  {
    id: "c1",
    type: "chance",
    parentId: "root",
    name: "Technical Success?",
    branchLabel: "Invest in R&D",
    probability: null,
    payoff: null,
    emv: 421,
    pruned: false,
    x: 1,
    y: 2,
  },
  {
    id: "t_noinvest",
    type: "terminal",
    parentId: "root",
    name: "No Investment",
    branchLabel: "Don't Invest",
    probability: null,
    payoff: 0,
    emv: 0,
    pruned: true,
    x: 1,
    y: 0,
  },
  {
    id: "d1",
    type: "decision",
    parentId: "c1",
    name: "Launch Product?",
    branchLabel: "Success",
    probability: 0.7,
    payoff: null,
    emv: 730,
    pruned: false,
    x: 2,
    y: 3,
  },
  {
    id: "t_fail",
    type: "terminal",
    parentId: "c1",
    name: "R&D Failure",
    branchLabel: "Failure",
    probability: 0.3,
    payoff: -300,
    emv: -300,
    pruned: false,
    x: 2,
    y: 1,
  },
  {
    id: "c2",
    type: "chance",
    parentId: "d1",
    name: "Market Demand",
    branchLabel: "Launch",
    probability: null,
    payoff: null,
    emv: 730,
    pruned: false,
    x: 3,
    y: 4,
  },
  {
    id: "t_nolaunch",
    type: "terminal",
    parentId: "d1",
    name: "Shelve Product",
    branchLabel: "Don't Launch",
    probability: null,
    payoff: -50,
    emv: -50,
    pruned: true,
    x: 3,
    y: 2,
  },
  {
    id: "t_high",
    type: "terminal",
    parentId: "c2",
    name: "High Demand",
    branchLabel: "High Demand",
    probability: 0.5,
    payoff: 1200,
    emv: 1200,
    pruned: false,
    x: 4,
    y: 5,
  },
  {
    id: "t_med",
    type: "terminal",
    parentId: "c2",
    name: "Medium Demand",
    branchLabel: "Medium Demand",
    probability: 0.3,
    payoff: 500,
    emv: 500,
    pruned: false,
    x: 4,
    y: 4,
  },
  {
    id: "t_low",
    type: "terminal",
    parentId: "c2",
    name: "Low Demand",
    branchLabel: "Low Demand",
    probability: 0.2,
    payoff: -100,
    emv: -100,
    pruned: false,
    x: 4,
    y: 3,
  },
];
const nodeById = Object.fromEntries(NODES.map((n) => [n.id, n]));
const edges = NODES.filter((n) => n.parentId !== null);

const fmtMoney = (v) => `${v < 0 ? "-" : ""}$${Math.abs(v)}k`;
const hexToRgba = (hex, alpha) => {
  const r = parseInt(hex.slice(1, 3), 16);
  const g = parseInt(hex.slice(3, 5), 16);
  const b = parseInt(hex.slice(5, 7), 16);
  return `rgba(${r},${g},${b},${alpha})`;
};

const DECISION_COLOR = t.palette[0]; // brand green — always first series
const CHANCE_COLOR = t.palette[1]; // lavender — second Imprint position
const TERMINAL_COLOR = t.ink; // neutral anchor: terminal nodes are reference endpoints
const PRUNE_COLOR = t.palette[4]; // matte red — semantic anchor for rejected/bad outcomes

const toPoint = (n, fillColor) => ({
  x: n.x,
  y: n.y,
  marker: { fillColor, lineColor: t.pageBg },
  custom: {
    label: n.name,
    valueLabel:
      n.type === "terminal"
        ? `Payoff: ${fmtMoney(n.payoff)}`
        : `EMV: ${fmtMoney(n.emv)}`,
  },
});

const decisionData = NODES.filter((n) => n.type === "decision").map((n) =>
  toPoint(n, DECISION_COLOR),
);
const chanceData = NODES.filter((n) => n.type === "chance").map((n) =>
  toPoint(n, CHANCE_COLOR),
);
const terminalData = NODES.filter((n) => n.type === "terminal").map((n) =>
  toPoint(n, n.pruned ? hexToRgba(TERMINAL_COLOR, 0.4) : TERMINAL_COLOR),
);

// --- Connector lines + branch labels ----------------------------------------
// Highcharts core has no tree/link series (networkgraph is an add-on module,
// not loaded) — branches are drawn as SVG paths in the render event, mapped
// through the axes so they stay aligned with the scatter node markers.
let customEls = [];

function drawBranches(chart) {
  customEls.forEach((el) => el.destroy());
  customEls = [];

  const xAxis = chart.xAxis[0];
  const yAxis = chart.yAxis[0];

  edges.forEach((child) => {
    const parent = nodeById[child.parentId];
    const x1 = xAxis.toPixels(parent.x);
    const y1 = yAxis.toPixels(parent.y);
    const x2 = xAxis.toPixels(child.x);
    const y2 = yAxis.toPixels(child.y);

    const line = chart.renderer
      .path(["M", x1, y1, "L", x2, y2])
      .attr({
        stroke: child.pruned ? PRUNE_COLOR : t.inkSoft,
        "stroke-width": child.pruned ? 2 : 2.5,
        dashstyle: child.pruned ? "Dash" : "Solid",
        opacity: child.pruned ? 0.55 : 0.9,
        zIndex: 1,
      })
      .add();
    customEls.push(line);

    const midX = (x1 + x2) / 2;
    const midY = (y1 + y2) / 2;
    const labelText =
      child.branchLabel +
      (child.probability != null ? ` (p=${child.probability.toFixed(2)})` : "");
    const label = chart.renderer
      .text(labelText, midX, midY - 12)
      .css({ color: t.inkSoft, fontSize: "13px" })
      .attr({ zIndex: 3 })
      .add();
    label.translate(-label.getBBox().width / 2, 0);
    customEls.push(label);

    if (child.pruned) {
      const cross = chart.renderer
        .text("✖", midX, midY + 22)
        .css({ color: PRUNE_COLOR, fontSize: "20px", fontWeight: "700" })
        .attr({ zIndex: 3 })
        .add();
      cross.translate(-cross.getBBox().width / 2, 0);
      customEls.push(cross);
    }
  });
}

// --- Chart -------------------------------------------------------------------
Highcharts.chart("container", {
  chart: {
    type: "scatter",
    backgroundColor: "transparent",
    animation: false,
    style: { fontFamily: "inherit" },
    events: {
      render() {
        drawBranches(this);
      },
    },
  },
  credits: { enabled: false },
  colors: t.palette,
  title: {
    text: "tree-decision · javascript · highcharts · anyplot.ai",
    style: { color: t.ink, fontSize: "22px", fontWeight: "600" },
  },
  subtitle: {
    text: "Two-stage R&D investment decision · values in $ thousands · dashed red = pruned (rejected) branch",
    style: { color: t.inkSoft, fontSize: "14px" },
  },
  xAxis: {
    min: -0.6,
    max: 4.6,
    startOnTick: false,
    endOnTick: false,
    visible: false,
  },
  yAxis: {
    min: -0.9,
    max: 5.9,
    startOnTick: false,
    endOnTick: false,
    visible: false,
    title: { text: null },
  },
  legend: {
    enabled: true,
    itemStyle: { color: t.inkSoft, fontSize: "14px" },
    itemHoverStyle: { color: t.ink },
  },
  tooltip: { enabled: false },
  plotOptions: {
    series: { animation: false },
    scatter: {
      marker: { radius: 19, lineWidth: 2, symbol: "circle" },
      dataLabels: [
        {
          enabled: true,
          y: -32,
          formatter() {
            return this.point.custom.label;
          },
          style: {
            color: t.ink,
            fontSize: "14px",
            fontWeight: "600",
            textOutline: "none",
          },
        },
        {
          enabled: true,
          y: 34,
          formatter() {
            return this.point.custom.valueLabel;
          },
          style: {
            color: t.inkSoft,
            fontSize: "13px",
            fontWeight: "400",
            textOutline: "none",
          },
        },
      ],
    },
  },
  series: [
    {
      name: "Decision node (square)",
      type: "scatter",
      color: DECISION_COLOR,
      marker: { symbol: "square" },
      data: decisionData,
    },
    {
      name: "Chance node (circle)",
      type: "scatter",
      color: CHANCE_COLOR,
      marker: { symbol: "circle" },
      data: chanceData,
    },
    {
      name: "Terminal node (triangle)",
      type: "scatter",
      color: TERMINAL_COLOR,
      marker: { symbol: "triangleright", radius: 21 },
      data: terminalData,
    },
  ],
});
Runnable source as JSON, for any HTTP client: https://api.anyplot.ai/specs/tree-decision/highcharts/code. Any spec id and library id listed in llms-full.txt fit the same URL shape; every URL below is complete and callable.
{
  "spec_id": "tree-decision",
  "language": "javascript",
  "library": "highcharts",
  "page": "https://anyplot.ai/tree-decision/javascript/highcharts",
  "hub": "https://anyplot.ai/tree-decision",
  "code_json": "https://api.anyplot.ai/specs/tree-decision/highcharts/code",
  "spec_json": "https://api.anyplot.ai/specs/tree-decision",
  "render_light_png": "https://storage.googleapis.com/anyplot-images/plots/tree-decision/javascript/highcharts/plot-light.png",
  "render_dark_png": "https://storage.googleapis.com/anyplot-images/plots/tree-decision/javascript/highcharts/plot-dark.png",
  "interactive_light_html": "https://storage.googleapis.com/anyplot-images/plots/tree-decision/javascript/highcharts/plot-light.html",
  "interactive_dark_html": "https://storage.googleapis.com/anyplot-images/plots/tree-decision/javascript/highcharts/plot-dark.html",
  "quality_score": 92.0,
  "license": "MIT",
  "guide": "https://anyplot.ai/llms.txt"
}
Part of Decision Tree Visualization with Probabilities on anyplot.ai.