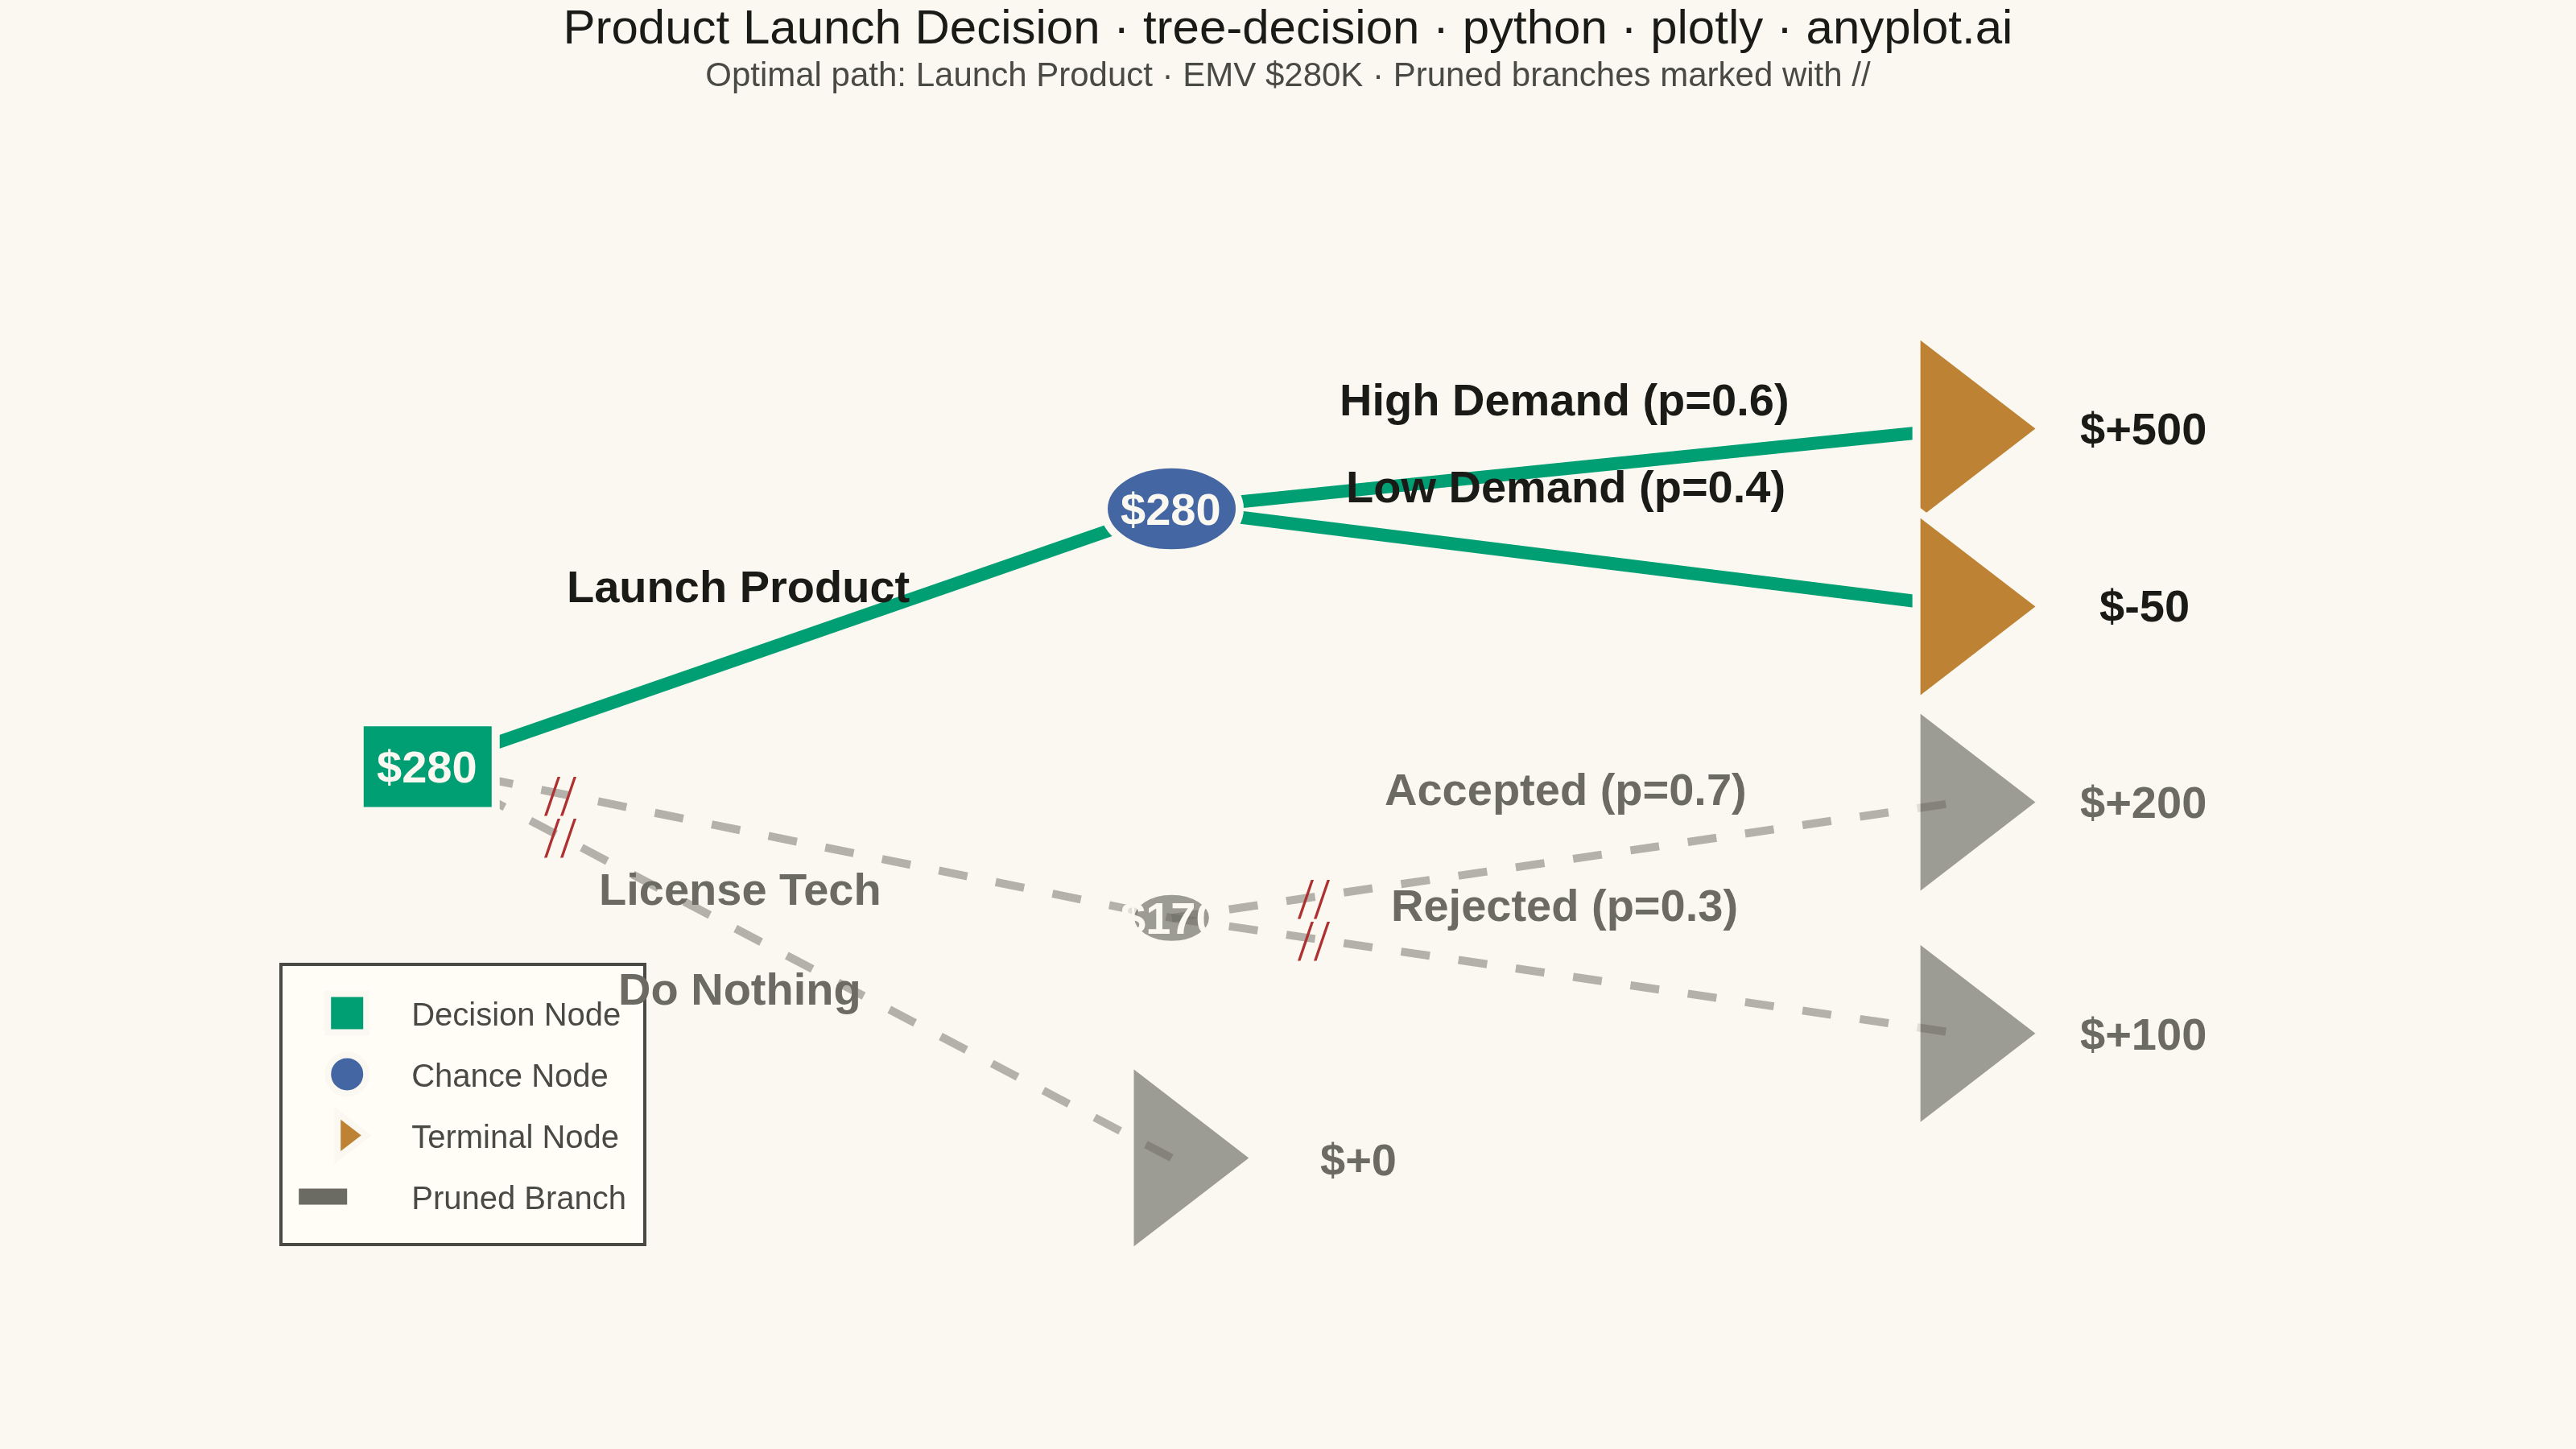
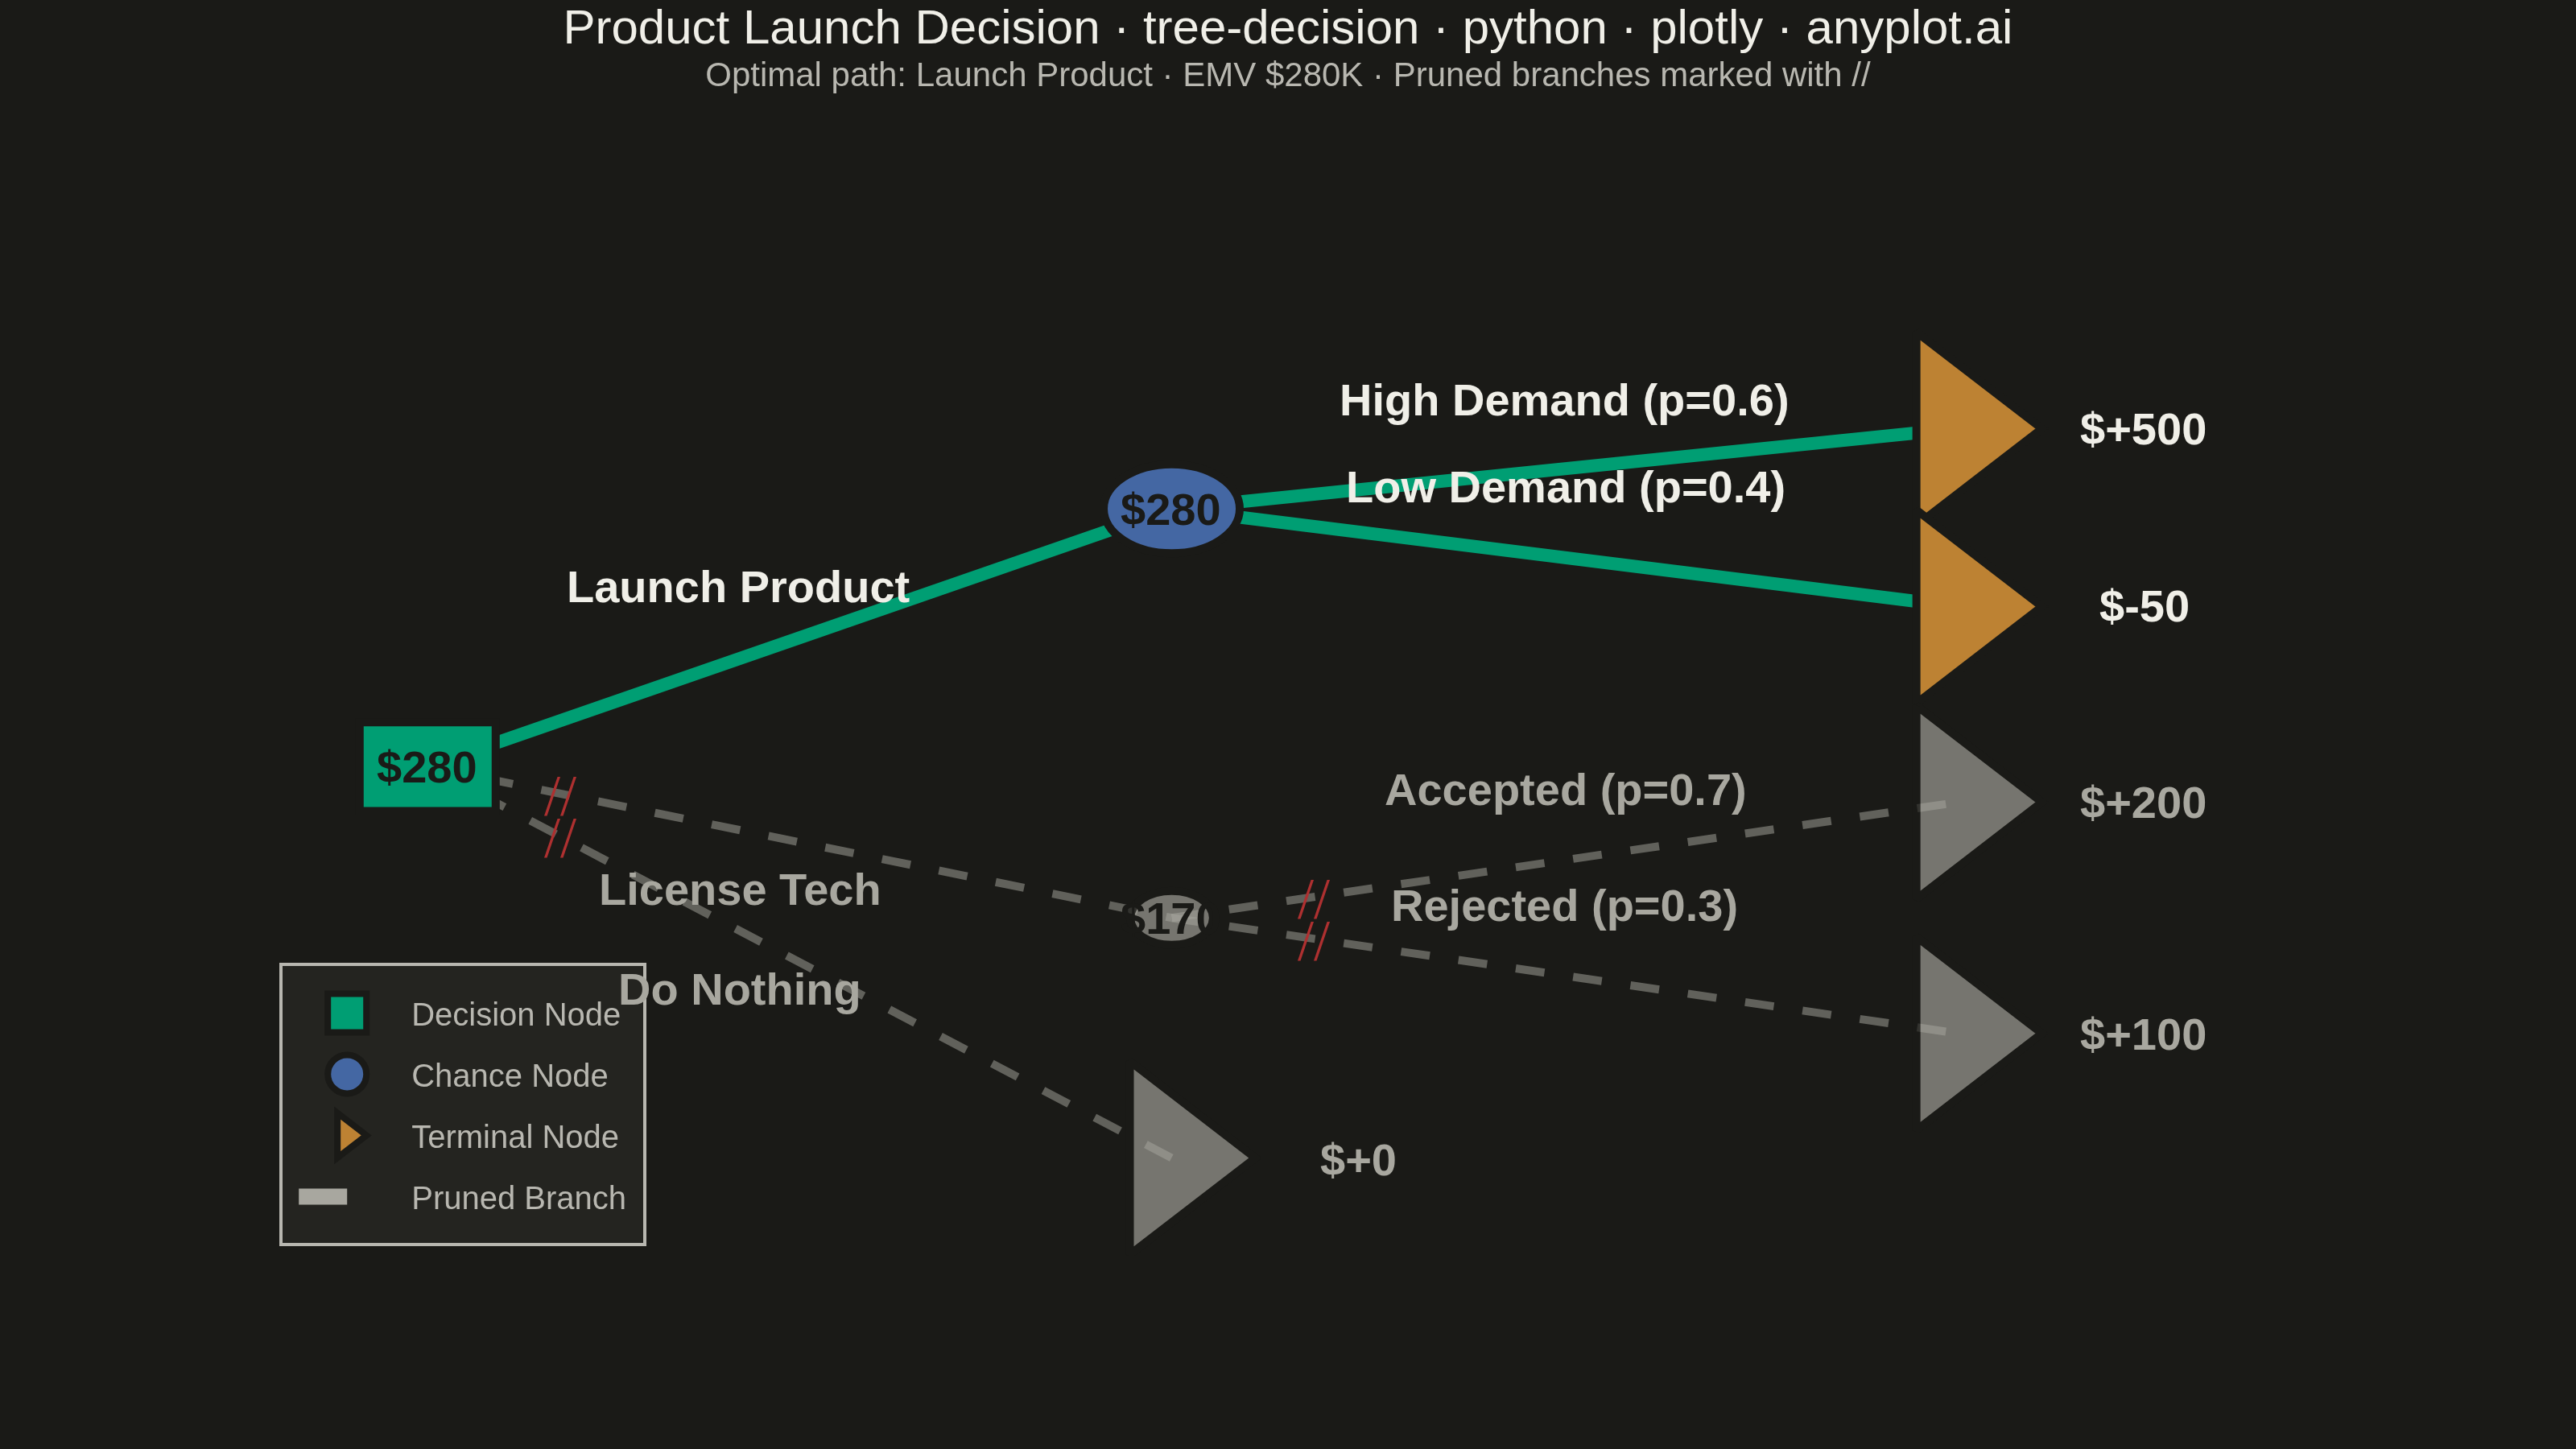
A tree-structured diagram for sequential decision analysis, displaying decision nodes (squares), chance nodes (circles), and terminal outcome nodes (triangles) connected by branching paths. Each chance branch is labeled with probabilities, terminal nodes show payoff values, and Expected Monetary Values (EMV) are calculated via rollback at each node. Rejected (pruned) branches are visually marked, making it easy to trace the optimal decision path through a multi-stage problem.
""" anyplot.ai
tree-decision: Decision Tree Visualization with Probabilities
Library: plotly 6.7.0 | Python 3.13.13
Quality: 88/100 | Updated: 2026-06-02
"""

import os

import plotly.graph_objects as go


# Theme tokens — Imprint palette / chrome (see prompts/default-style-guide.md)
THEME = os.getenv("ANYPLOT_THEME", "light")
PAGE_BG = "#FAF8F1" if THEME == "light" else "#1A1A17"
ELEVATED_BG = "#FFFDF6" if THEME == "light" else "#242420"
INK = "#1A1A17" if THEME == "light" else "#F0EFE8"
INK_SOFT = "#4A4A44" if THEME == "light" else "#B8B7B0"
INK_MUTED = "#6B6A63" if THEME == "light" else "#A8A79F"

# Imprint categorical palette — node type colors (positions 1→3)
C_DECISION = "#009E73"  # brand green — decision nodes (first series)
C_CHANCE = "#4467A3"  # blue — chance nodes
C_TERMINAL = "#BD8233"  # ochre — terminal/payoff nodes
C_PRUNED = INK_MUTED  # theme-adaptive muted — pruned elements

# Data — two-stage product launch investment decision
nodes = {
    "D1": {
        "type": "decision",
        "parent": None,
        "label": None,
        "prob": None,
        "payoff": None,
        "emv": 280,
        "pruned": False,
    },
    "C1": {
        "type": "chance",
        "parent": "D1",
        "label": "Launch Product",
        "prob": None,
        "payoff": None,
        "emv": 280,
        "pruned": False,
    },
    "T1": {
        "type": "terminal",
        "parent": "C1",
        "label": "High Demand",
        "prob": 0.6,
        "payoff": 500,
        "emv": None,
        "pruned": False,
    },
    "T2": {
        "type": "terminal",
        "parent": "C1",
        "label": "Low Demand",
        "prob": 0.4,
        "payoff": -50,
        "emv": None,
        "pruned": False,
    },
    "C2": {
        "type": "chance",
        "parent": "D1",
        "label": "License Tech",
        "prob": None,
        "payoff": None,
        "emv": 170,
        "pruned": True,
    },
    "T3": {
        "type": "terminal",
        "parent": "C2",
        "label": "Accepted",
        "prob": 0.7,
        "payoff": 200,
        "emv": None,
        "pruned": True,
    },
    "T4": {
        "type": "terminal",
        "parent": "C2",
        "label": "Rejected",
        "prob": 0.3,
        "payoff": 100,
        "emv": None,
        "pruned": True,
    },
    "T5": {
        "type": "terminal",
        "parent": "D1",
        "label": "Do Nothing",
        "prob": None,
        "payoff": 0,
        "emv": None,
        "pruned": True,
    },
}

# Layout positions (x, y) — left-to-right tree; distributed to reduce upper-right gap
positions = {
    "D1": (0.0, 0.50),
    "C1": (0.35, 0.79),
    "T1": (0.72, 0.88),
    "T2": (0.72, 0.68),
    "C2": (0.35, 0.33),
    "T3": (0.72, 0.46),
    "T4": (0.72, 0.20),
    "T5": (0.35, 0.06),
}

# Plot
fig = go.Figure()

# Draw edges (branches)
for nid, n in nodes.items():
    if n["parent"] is None:
        continue
    p_x, p_y = positions[n["parent"]]
    c_x, c_y = positions[nid]
    edge_color = C_PRUNED if n["pruned"] else C_DECISION
    dash = "dash" if n["pruned"] else "solid"
    line_width = 2.5 if n["pruned"] else 4
    opacity = 0.5 if n["pruned"] else 1.0

    hover_parts = [f"<b>{n['label'] or ''}</b>"]
    if n["prob"] is not None:
        hover_parts.append(f"Probability: {n['prob']:.0%}")
    if n["payoff"] is not None:
        hover_parts.append(f"Payoff: ${n['payoff']:+,}")
    if n["pruned"]:
        hover_parts.append("<i>Pruned (suboptimal)</i>")
    edge_hover = "<br>".join(hover_parts)

    fig.add_trace(
        go.Scatter(
            x=[p_x, c_x],
            y=[p_y, c_y],
            mode="lines",
            line={"color": edge_color, "width": line_width, "dash": dash},
            opacity=opacity,
            hoverinfo="text",
            hovertext=[edge_hover, edge_hover],
            showlegend=False,
        )
    )

    # Branch label at midpoint
    t = 0.42 if n["parent"] == "D1" else 0.5
    mid_x = p_x + (c_x - p_x) * t
    mid_y = p_y + (c_y - p_y) * t
    label_text = n["label"] or ""
    if n["prob"] is not None:
        label_text = f"{n['label']} (p={n['prob']})"
    text_color = C_PRUNED if n["pruned"] else INK

    yshift = 22
    if nid in ("T5", "C2"):
        yshift = -18

    fig.add_annotation(
        x=mid_x,
        y=mid_y,
        text=f"<b>{label_text}</b>",
        showarrow=False,
        font={"size": 14, "color": text_color, "family": "Arial, sans-serif"},
        yshift=yshift,
    )

# Pruned double-strike marks
for nid, n in nodes.items():
    if not n["pruned"] or n["parent"] is None:
        continue
    p_x, p_y = positions[n["parent"]]
    c_x, c_y = positions[nid]
    mark_x = p_x + (c_x - p_x) * 0.18
    mark_y = p_y + (c_y - p_y) * 0.18
    fig.add_annotation(
        x=mark_x, y=mark_y, text="//", showarrow=False, font={"size": 18, "color": "#AE3030", "family": "Arial Black"}
    )

# Draw nodes — decision (rect), chance (circle), terminal (triangle)
base_size_x = 0.032
base_size_y = 0.05
max_emv = 280  # D1=280, C1=280, C2=170

for nid, n in nodes.items():
    n_x, n_y = positions[nid]
    if n["pruned"]:
        node_color = C_PRUNED
    elif n["type"] == "decision":
        node_color = C_DECISION
    elif n["type"] == "chance":
        node_color = C_CHANCE
    else:
        node_color = C_TERMINAL
    node_opacity = 0.65 if n["pruned"] else 1.0

    # Scale node size by EMV magnitude (min 0.6×, max 1.4× base)
    emv_scale = max(0.6, min(1.4, n["emv"] / max_emv)) if n["emv"] is not None else 1.0
    shape_size_x = base_size_x * emv_scale
    shape_size_y = base_size_y * emv_scale

    hover_parts = [f"<b>{nid}</b> — {n['type'].title()} Node"]
    if n["emv"] is not None:
        hover_parts.append(f"EMV: <b>${n['emv']:,}</b>")
    if n["payoff"] is not None:
        hover_parts.append(f"Payoff: <b>${n['payoff']:+,}</b>")
    if n["prob"] is not None:
        hover_parts.append(f"Probability: {n['prob']:.0%}")
    if n["label"]:
        hover_parts.append(f"Branch: {n['label']}")
    if n["pruned"]:
        hover_parts.append("<i>Pruned (suboptimal path)</i>")
    elif n["type"] != "terminal":
        hover_parts.append("<i>Optimal path</i>")
    node_hover = "<br>".join(hover_parts)

    if n["type"] == "decision":
        fig.add_shape(
            type="rect",
            x0=n_x - shape_size_x,
            y0=n_y - shape_size_y,
            x1=n_x + shape_size_x,
            y1=n_y + shape_size_y,
            fillcolor=node_color,
            opacity=node_opacity,
            line={"color": PAGE_BG, "width": 2.5},
            xref="x",
            yref="y",
        )
    elif n["type"] == "chance":
        fig.add_shape(
            type="circle",
            x0=n_x - shape_size_x,
            y0=n_y - shape_size_y,
            x1=n_x + shape_size_x,
            y1=n_y + shape_size_y,
            fillcolor=node_color,
            opacity=node_opacity,
            line={"color": PAGE_BG, "width": 2.5},
            xref="x",
            yref="y",
        )
    else:
        # Terminal node: right-pointing triangle
        fig.add_trace(
            go.Scatter(
                x=[n_x],
                y=[n_y],
                mode="markers",
                marker={
                    "size": 52,
                    "color": node_color,
                    "symbol": "triangle-right",
                    "line": {"color": PAGE_BG, "width": 2.5},
                    "opacity": node_opacity,
                },
                hoverinfo="text",
                hovertext=[node_hover],
                hoverlabel={"bgcolor": node_color, "font_size": 13, "font_color": PAGE_BG},
                showlegend=False,
            )
        )

    # Invisible scatter for hover on decision/chance nodes (shapes don't support hover)
    if n["type"] in ("decision", "chance"):
        fig.add_trace(
            go.Scatter(
                x=[n_x],
                y=[n_y],
                mode="markers",
                marker={"size": 50, "color": "rgba(0,0,0,0)", "symbol": "square"},
                hoverinfo="text",
                hovertext=[node_hover],
                hoverlabel={"bgcolor": node_color, "font_size": 13, "font_color": PAGE_BG},
                showlegend=False,
            )
        )

    # EMV label inside decision/chance nodes
    if n["emv"] is not None:
        emv_text_color = PAGE_BG
        fig.add_annotation(
            x=n_x,
            y=n_y,
            text=f"<b>${n['emv']}</b>",
            showarrow=False,
            font={"size": 14, "color": emv_text_color, "family": "Arial, sans-serif"},
        )

    # Payoff label to the right of terminal nodes
    if n["payoff"] is not None:
        payoff_color = C_PRUNED if n["pruned"] else INK
        fig.add_annotation(
            x=n_x,
            y=n_y,
            text=f"<b>${n['payoff']:+,}</b>",
            showarrow=False,
            font={"size": 14, "color": payoff_color, "family": "Arial, sans-serif"},
            xshift=58,
        )

# Legend entries
for legend_name, legend_color, legend_symbol in [
    ("Decision Node", C_DECISION, "square"),
    ("Chance Node", C_CHANCE, "circle"),
    ("Terminal Node", C_TERMINAL, "triangle-right"),
]:
    fig.add_trace(
        go.Scatter(
            x=[None],
            y=[None],
            mode="markers",
            marker={"size": 14, "color": legend_color, "symbol": legend_symbol, "line": {"color": PAGE_BG, "width": 1}},
            name=legend_name,
            showlegend=True,
        )
    )

fig.add_trace(
    go.Scatter(
        x=[None],
        y=[None],
        mode="lines",
        line={"color": C_PRUNED, "width": 3, "dash": "dash"},
        name="Pruned Branch",
        showlegend=True,
    )
)

# Title — scaled font for length > 67 chars
title_main = "Product Launch Decision · tree-decision · python · plotly · anyplot.ai"
n_chars = len(title_main)
ratio = 67 / n_chars if n_chars > 67 else 1.0
title_fontsize = max(11, round(16 * ratio))

subtitle_color = INK_SOFT
title_full = (
    f"{title_main}"
    f"<br><sup style='color:{subtitle_color}; font-size:12px'>"
    f"Optimal path: Launch Product · EMV $280K · Pruned branches marked with //</sup>"
)

# Style
fig.update_layout(
    autosize=False,
    width=800,
    height=450,
    margin={"l": 80, "r": 40, "t": 100, "b": 60},
    title={
        "text": title_full,
        "font": {"size": title_fontsize, "color": INK, "family": "Arial, sans-serif"},
        "x": 0.5,
        "xanchor": "center",
        "y": 0.97,
    },
    paper_bgcolor=PAGE_BG,
    plot_bgcolor=PAGE_BG,
    font={"color": INK},
    xaxis={"showgrid": False, "zeroline": False, "showticklabels": False, "showline": False, "range": [-0.08, 0.95]},
    yaxis={"showgrid": False, "zeroline": False, "showticklabels": False, "showline": False, "range": [-0.05, 1.00]},
    legend={
        "font": {"size": 10, "family": "Arial, sans-serif", "color": INK_SOFT},
        "x": 0.01,
        "y": 0.01,
        "xanchor": "left",
        "yanchor": "bottom",
        "bgcolor": ELEVATED_BG,
        "bordercolor": INK_SOFT,
        "borderwidth": 1,
        "itemsizing": "constant",
    },
    hoverlabel={"font_size": 13},
    hovermode="closest",
)

# Save
fig.write_image(f"plot-{THEME}.png", width=800, height=450, scale=4)
fig.write_html(f"plot-{THEME}.html", include_plotlyjs="cdn")
Runnable source as JSON, for any HTTP client: https://api.anyplot.ai/specs/tree-decision/plotly/code. Any spec id and library id listed in llms-full.txt fit the same URL shape; every URL below is complete and callable.
{
  "spec_id": "tree-decision",
  "language": "python",
  "library": "plotly",
  "page": "https://anyplot.ai/tree-decision/python/plotly",
  "hub": "https://anyplot.ai/tree-decision",
  "code_json": "https://api.anyplot.ai/specs/tree-decision/plotly/code",
  "spec_json": "https://api.anyplot.ai/specs/tree-decision",
  "render_light_png": "https://storage.googleapis.com/anyplot-images/plots/tree-decision/python/plotly/plot-light.png",
  "render_dark_png": "https://storage.googleapis.com/anyplot-images/plots/tree-decision/python/plotly/plot-dark.png",
  "interactive_light_html": "https://storage.googleapis.com/anyplot-images/plots/tree-decision/python/plotly/plot-light.html",
  "interactive_dark_html": "https://storage.googleapis.com/anyplot-images/plots/tree-decision/python/plotly/plot-dark.html",
  "quality_score": 88.0,
  "license": "MIT",
  "guide": "https://anyplot.ai/llms.txt"
}
Part of Decision Tree Visualization with Probabilities on anyplot.ai.