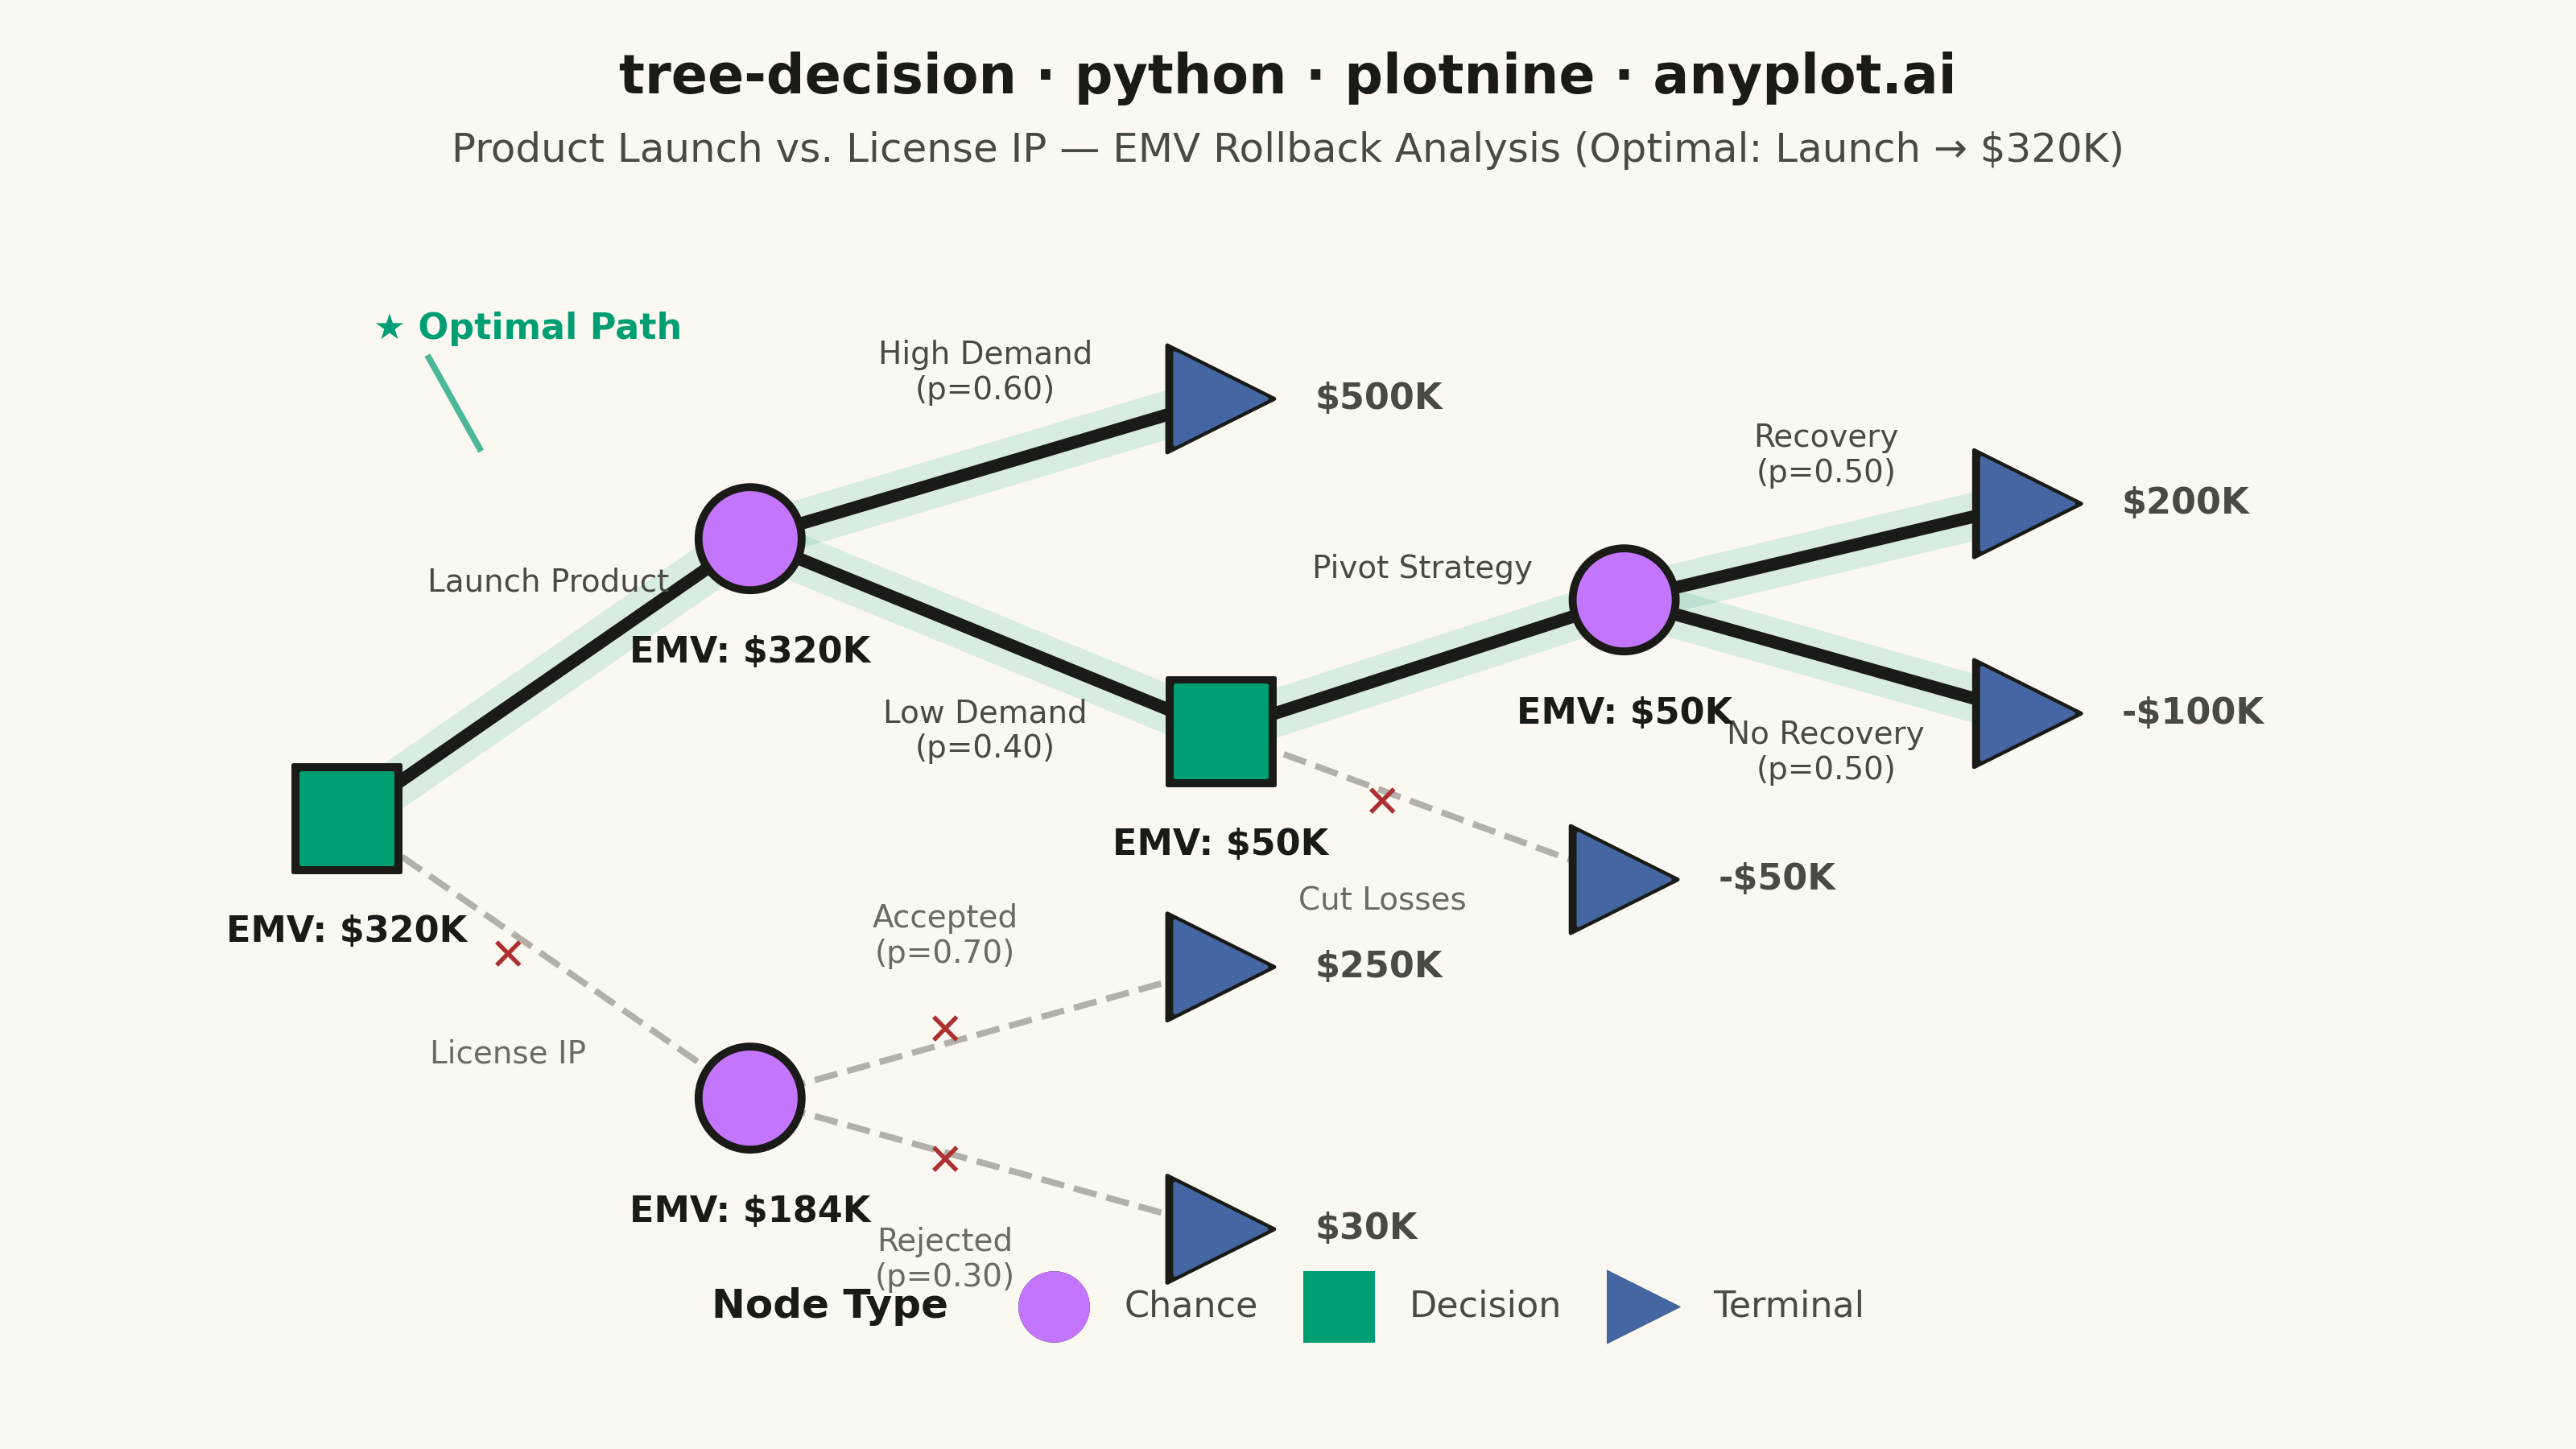
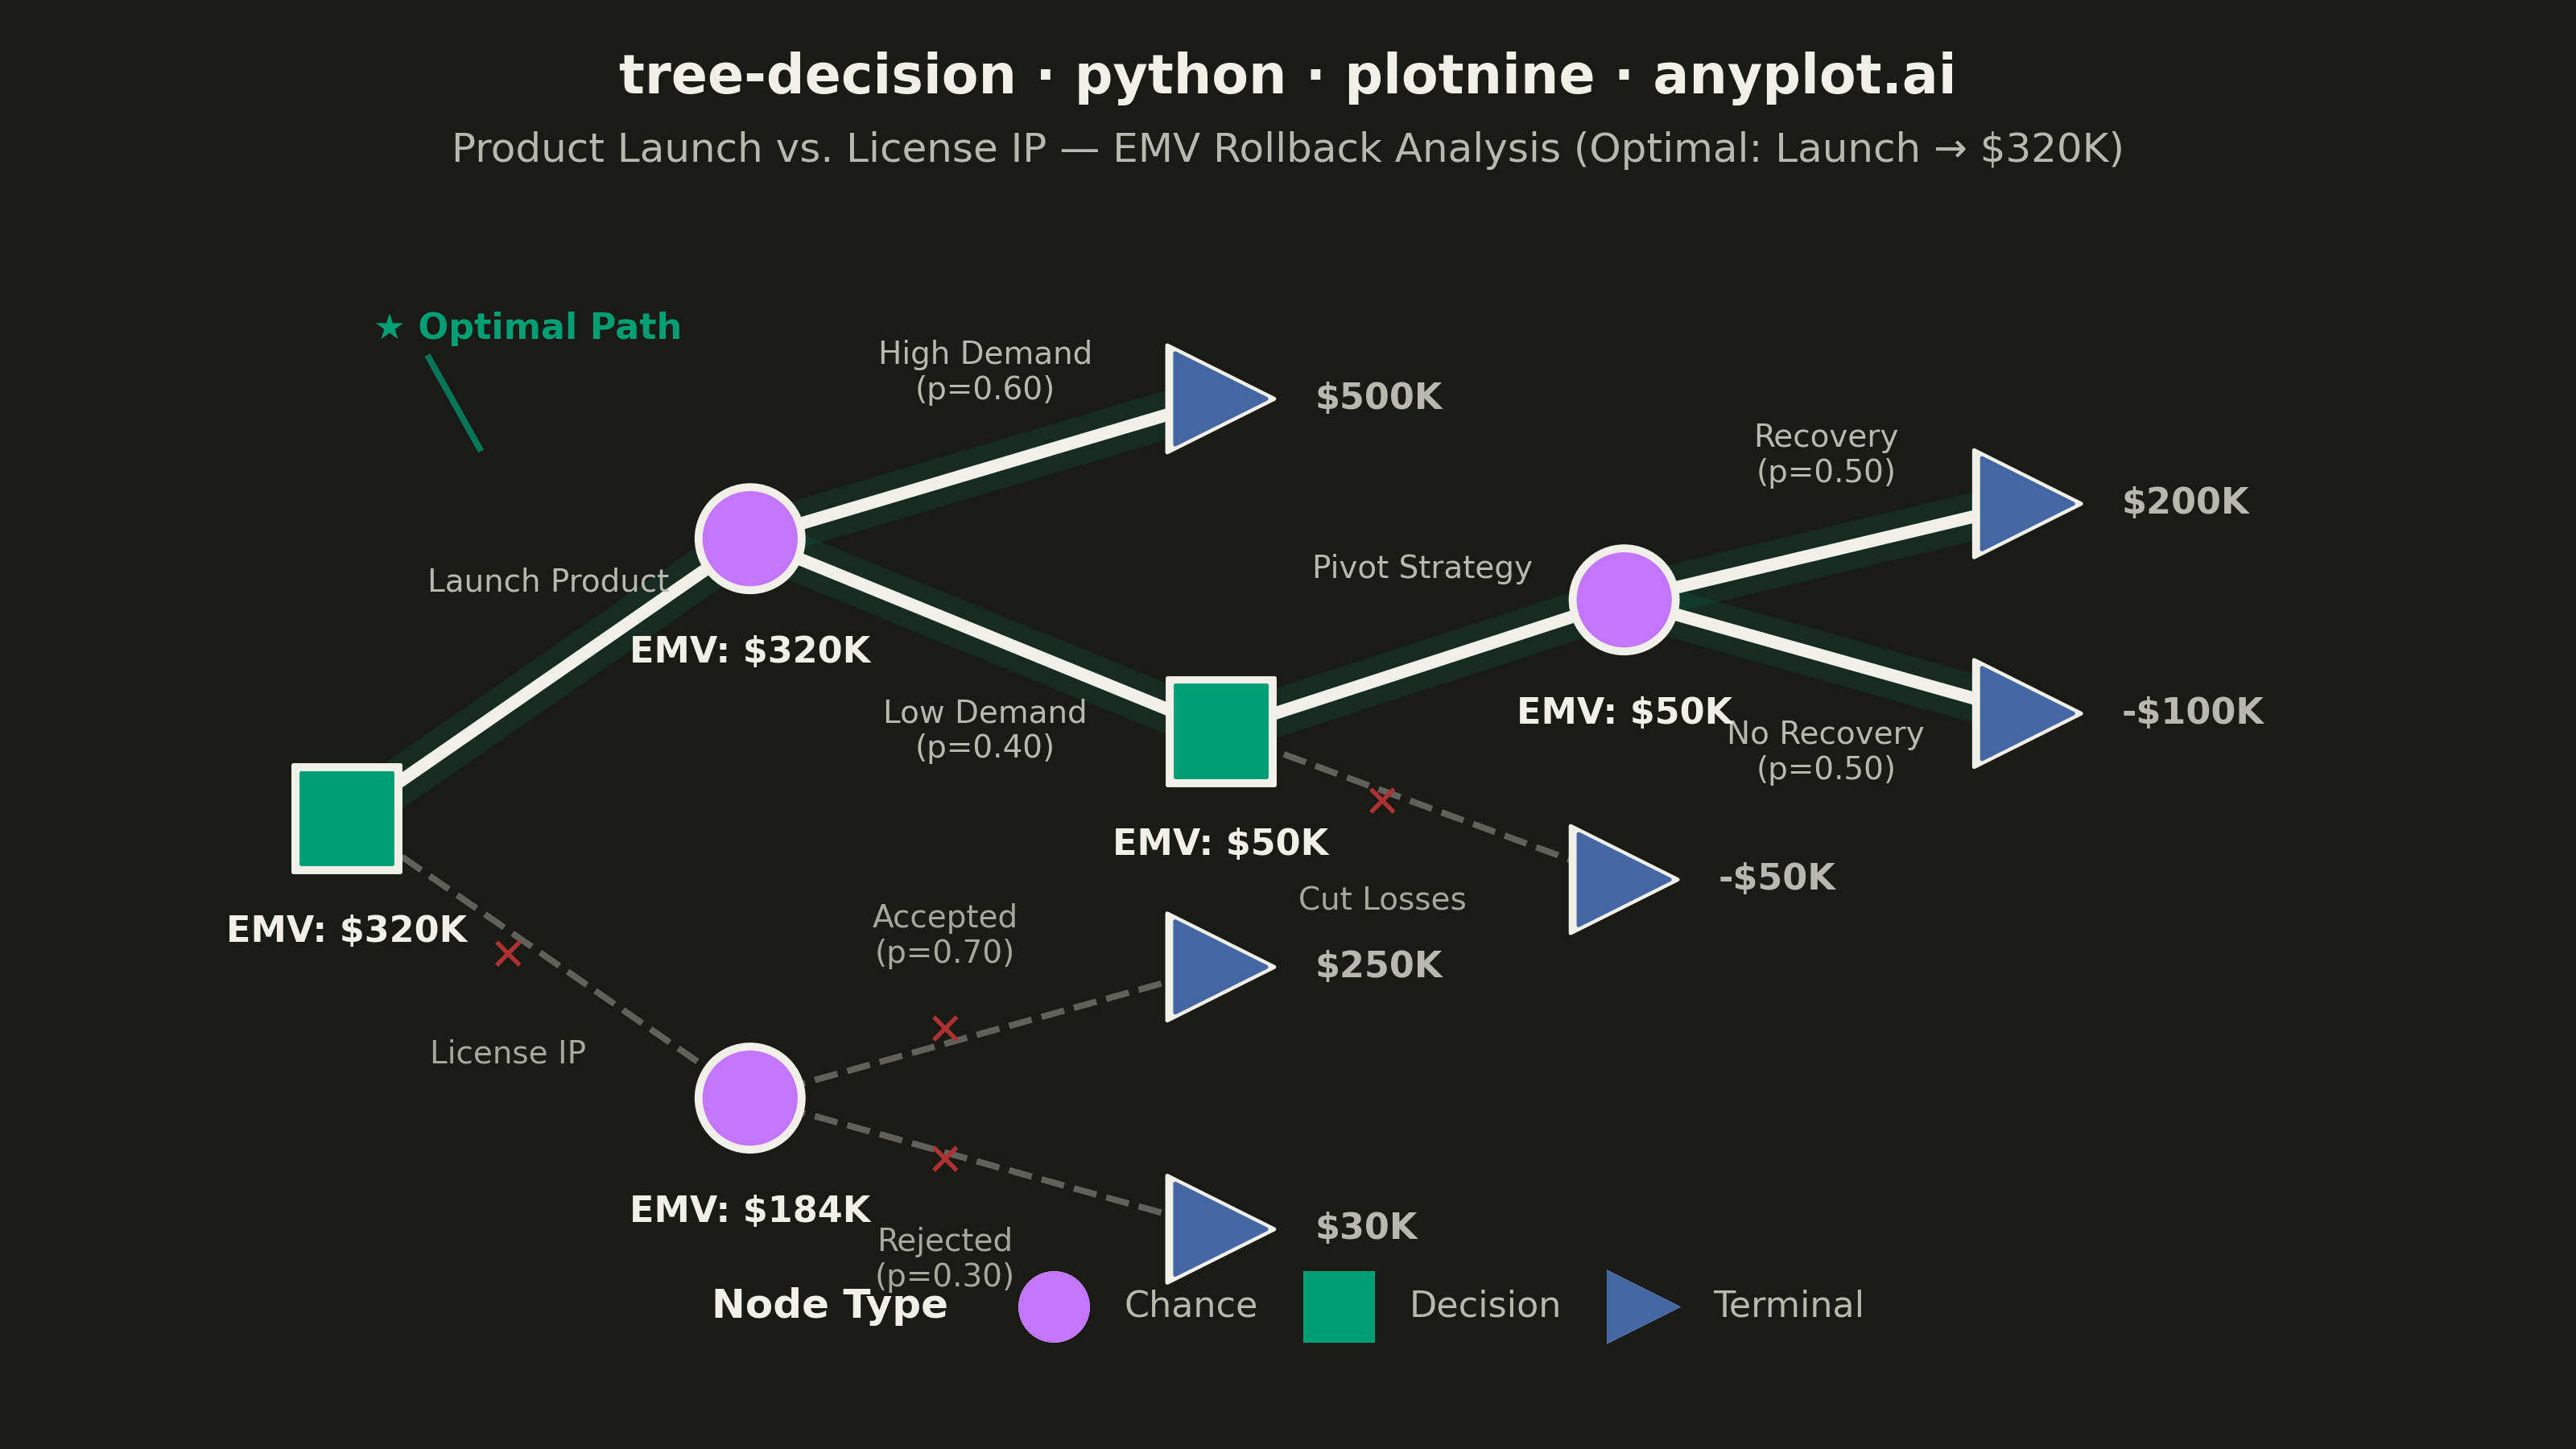
A tree-structured diagram for sequential decision analysis, displaying decision nodes (squares), chance nodes (circles), and terminal outcome nodes (triangles) connected by branching paths. Each chance branch is labeled with probabilities, terminal nodes show payoff values, and Expected Monetary Values (EMV) are calculated via rollback at each node. Rejected (pruned) branches are visually marked, making it easy to trace the optimal decision path through a multi-stage problem.
""" anyplot.ai
tree-decision: Decision Tree Visualization with Probabilities
Library: plotnine 0.15.4 | Python 3.13.13
Quality: 86/100 | Updated: 2026-06-02
"""

import os
import sys


# Remove the script's own directory from sys.path so 'plotnine' resolves to the
# installed library and not this file (which shares the library's name).
sys.path = [p for p in sys.path if not p.endswith("implementations/python")]

import pandas as pd
from plotnine import (
    aes,
    annotate,
    coord_fixed,
    element_rect,
    element_text,
    geom_point,
    geom_segment,
    geom_text,
    ggplot,
    guide_legend,
    guides,
    labs,
    scale_color_manual,
    scale_shape_manual,
    theme,
    theme_void,
    xlim,
    ylim,
)


# Theme tokens (Imprint palette — default-style-guide.md)
THEME = os.getenv("ANYPLOT_THEME", "light")
PAGE_BG = "#FAF8F1" if THEME == "light" else "#1A1A17"
ELEVATED_BG = "#FFFDF6" if THEME == "light" else "#242420"
INK = "#1A1A17" if THEME == "light" else "#F0EFE8"
INK_SOFT = "#4A4A44" if THEME == "light" else "#B8B7B0"
INK_MUTED = "#6B6A63" if THEME == "light" else "#A8A79F"

# Imprint palette — canonical order, first series always #009E73
IMPRINT_PALETTE = ["#009E73", "#C475FD", "#4467A3", "#BD8233", "#AE3030", "#2ABCCD", "#954477", "#99B314"]

# Node type colors: Decision→green(1), Chance→lavender(2), Terminal→blue(3)
NODE_COLORS = {
    "Decision": IMPRINT_PALETTE[0],  # #009E73 brand green
    "Chance": IMPRINT_PALETTE[1],  # #C475FD lavender
    "Terminal": IMPRINT_PALETTE[2],  # #4467A3 blue
}
# Matte red (position 5) — semantic anchor for rejected/pruned branches
PRUNE_COLOR = IMPRINT_PALETTE[4]

# Data — Two-stage product launch decision tree
# EMV rollback:
#   C2 = 0.5×200 + 0.5×(-100) = $50K
#   D2 = max(Pivot=$50K, Cut=-$50K) = $50K  → prune Cut Losses
#   C1 = 0.6×500 + 0.4×50 = $320K
#   C3 = 0.7×250 + 0.3×30 = $184K
#   D1 = max(Launch=$320K, License=$184K) = $320K  → prune License IP

nodes = pd.DataFrame(
    {
        "x": [0, 3, 3, 6.5, 6.5, 6.5, 6.5, 9.5, 9.5, 12.5, 12.5],
        "y": [5, 8.2, 1.8, 9.8, 6.0, 3.3, 0.3, 7.5, 4.3, 8.6, 6.2],
        "node_type": [
            "Decision",
            "Chance",
            "Chance",
            "Terminal",
            "Decision",
            "Terminal",
            "Terminal",
            "Chance",
            "Terminal",
            "Terminal",
            "Terminal",
        ],
        "value": [
            "EMV: $320K",
            "EMV: $320K",
            "EMV: $184K",
            "$500K",
            "EMV: $50K",
            "$250K",
            "$30K",
            "EMV: $50K",
            "-$50K",
            "$200K",
            "-$100K",
        ],
    }
)

emv_nodes = nodes[nodes["node_type"] != "Terminal"].copy()
emv_nodes["lx"] = emv_nodes["x"]
emv_nodes["ly"] = emv_nodes["y"] - 1.3

terminal_nodes = nodes[nodes["node_type"] == "Terminal"].copy()
terminal_nodes["lx"] = terminal_nodes["x"] + 0.7
terminal_nodes["ly"] = terminal_nodes["y"]

edges = pd.DataFrame(
    {
        "x": [0, 0, 3, 3, 3, 3, 6.5, 6.5, 9.5, 9.5],
        "xend": [3, 3, 6.5, 6.5, 6.5, 6.5, 9.5, 9.5, 12.5, 12.5],
        "y": [5, 5, 8.2, 8.2, 1.8, 1.8, 6.0, 6.0, 7.5, 7.5],
        "yend": [8.2, 1.8, 9.8, 6.0, 3.3, 0.3, 7.5, 4.3, 8.6, 6.2],
        "branch_label": [
            "Launch Product",
            "License IP",
            "High Demand\n(p=0.60)",
            "Low Demand\n(p=0.40)",
            "Accepted\n(p=0.70)",
            "Rejected\n(p=0.30)",
            "Pivot Strategy",
            "Cut Losses",
            "Recovery\n(p=0.50)",
            "No Recovery\n(p=0.50)",
        ],
        "pruned": [False, True, False, False, True, True, False, True, False, False],
    }
)

# Midpoint label positions with offsets above/below the branch
edges["lx"] = (edges["x"] + edges["xend"]) / 2
edges["ly"] = (edges["y"] + edges["yend"]) / 2
for i in edges.index:
    dy = edges.loc[i, "yend"] - edges.loc[i, "y"]
    edges.loc[i, "ly"] += 1.1 if dy > 0 else -1.1
    if edges.loc[i, "pruned"]:
        edges.loc[i, "lx"] -= 0.3

active = edges[~edges["pruned"]].copy()
pruned_edges = edges[edges["pruned"]].copy()

prune_marks = pruned_edges.copy()
prune_marks["mx"] = (prune_marks["x"] + prune_marks["xend"]) / 2 - 0.3
prune_marks["my"] = (prune_marks["y"] + prune_marks["yend"]) / 2
prune_marks["mark"] = "✕"

# Optimal decision path for glow highlighting
optimal_path = pd.DataFrame(
    {
        "x": [0, 3, 3, 6.5, 9.5, 9.5],
        "xend": [3, 6.5, 6.5, 9.5, 12.5, 12.5],
        "y": [5, 8.2, 8.2, 6.0, 7.5, 7.5],
        "yend": [8.2, 9.8, 6.0, 7.5, 8.6, 6.2],
    }
)

# Title — 46 chars, under 67-char baseline → 12pt default is fine
title = "tree-decision · python · plotnine · anyplot.ai"

plot = (
    ggplot()
    # Optimal path glow — brand green tint behind the winning branches
    + geom_segment(
        aes(x="x", y="y", xend="xend", yend="yend"),
        data=optimal_path,
        size=6,
        color=IMPRINT_PALETTE[0],
        alpha=0.13,
        lineend="round",
    )
    # Active branches — solid, full opacity
    + geom_segment(aes(x="x", y="y", xend="xend", yend="yend"), data=active, size=1.6, color=INK, lineend="round")
    # Pruned branches — dashed, muted
    + geom_segment(
        aes(x="x", y="y", xend="xend", yend="yend"),
        data=pruned_edges,
        size=0.8,
        color=INK_MUTED,
        linetype="dashed",
        alpha=0.5,
    )
    # Prune marks — matte red (Imprint semantic anchor for bad/rejected)
    + geom_text(aes(x="mx", y="my", label="mark"), data=prune_marks, size=10, color=PRUNE_COLOR, fontweight="bold")
    # Active branch labels
    + geom_text(aes(x="lx", y="ly", label="branch_label"), data=active, size=7, color=INK_SOFT, ha="center")
    # Pruned branch labels — muted to de-emphasise
    + geom_text(aes(x="lx", y="ly", label="branch_label"), data=pruned_edges, size=7, color=INK_MUTED, ha="center")
    # Node outer ring — thin border for definition against both themes
    + geom_point(aes(x="x", y="y", shape="node_type"), data=nodes, size=13, color=INK, fill=INK, stroke=0.5)
    # Node fill — Imprint palette by node type
    + geom_point(aes(x="x", y="y", color="node_type", shape="node_type"), data=nodes, size=11)
    # EMV labels at decision/chance nodes
    + geom_text(aes(x="lx", y="ly", label="value"), data=emv_nodes, size=8, color=INK, ha="center", fontweight="bold")
    # Payoff labels at terminal nodes
    + geom_text(
        aes(x="lx", y="ly", label="value"), data=terminal_nodes, size=8, color=INK_SOFT, ha="left", fontweight="bold"
    )
    # Optimal path annotation
    + annotate(
        "text", x=0.2, y=10.6, label="★ Optimal Path", size=8, color=IMPRINT_PALETTE[0], fontweight="bold", ha="left"
    )
    + annotate("segment", x=0.6, y=10.3, xend=1.0, yend=9.2, size=0.8, color=IMPRINT_PALETTE[0], alpha=0.7)
    + scale_color_manual(values=NODE_COLORS, name="Node Type")
    + scale_shape_manual(values={"Decision": "s", "Chance": "o", "Terminal": ">"}, name="Node Type")
    + guides(color=guide_legend(override_aes={"size": 8}))
    + theme_void()
    + theme(
        figure_size=(8, 4.5),
        plot_title=element_text(size=12, weight="bold", ha="center", color=INK),
        plot_subtitle=element_text(size=9, ha="center", color=INK_SOFT),
        legend_position=(0.5, 0.03),
        legend_direction="horizontal",
        legend_title=element_text(size=9, weight="bold", color=INK),
        legend_text=element_text(size=8, color=INK_SOFT),
        legend_key_size=16,
        plot_background=element_rect(fill=PAGE_BG, color=PAGE_BG),
        plot_margin=0.02,
    )
    + labs(title=title, subtitle="Product Launch vs. License IP — EMV Rollback Analysis (Optimal: Launch → $320K)")
    + coord_fixed(ratio=0.65)
    + xlim(-0.5, 14.5)
    + ylim(-1.0, 11.5)
)

# Save
plot.save(f"plot-{THEME}.png", dpi=400, width=8, height=4.5, units="in")
Runnable source as JSON, for any HTTP client: https://api.anyplot.ai/specs/tree-decision/plotnine/code. Any spec id and library id listed in llms-full.txt fit the same URL shape; every URL below is complete and callable.
{
  "spec_id": "tree-decision",
  "language": "python",
  "library": "plotnine",
  "page": "https://anyplot.ai/tree-decision/python/plotnine",
  "hub": "https://anyplot.ai/tree-decision",
  "code_json": "https://api.anyplot.ai/specs/tree-decision/plotnine/code",
  "spec_json": "https://api.anyplot.ai/specs/tree-decision",
  "render_light_png": "https://storage.googleapis.com/anyplot-images/plots/tree-decision/python/plotnine/plot-light.png",
  "render_dark_png": "https://storage.googleapis.com/anyplot-images/plots/tree-decision/python/plotnine/plot-dark.png",
  "quality_score": 86.0,
  "license": "MIT",
  "guide": "https://anyplot.ai/llms.txt"
}
Part of Decision Tree Visualization with Probabilities on anyplot.ai.