The same plot in 14 other libraries — JavaScript: Chart.js, D3.js, Apache ECharts, Highcharts; Python: Altair, Bokeh, lets-plot, Matplotlib, Plotly, plotnine, Pygal, Seaborn; R: ggplot2; Julia: Makie.jl. Compare all 15 side by side: Decision Tree Visualization with Probabilities in Python, R, Julia and JavaScript.
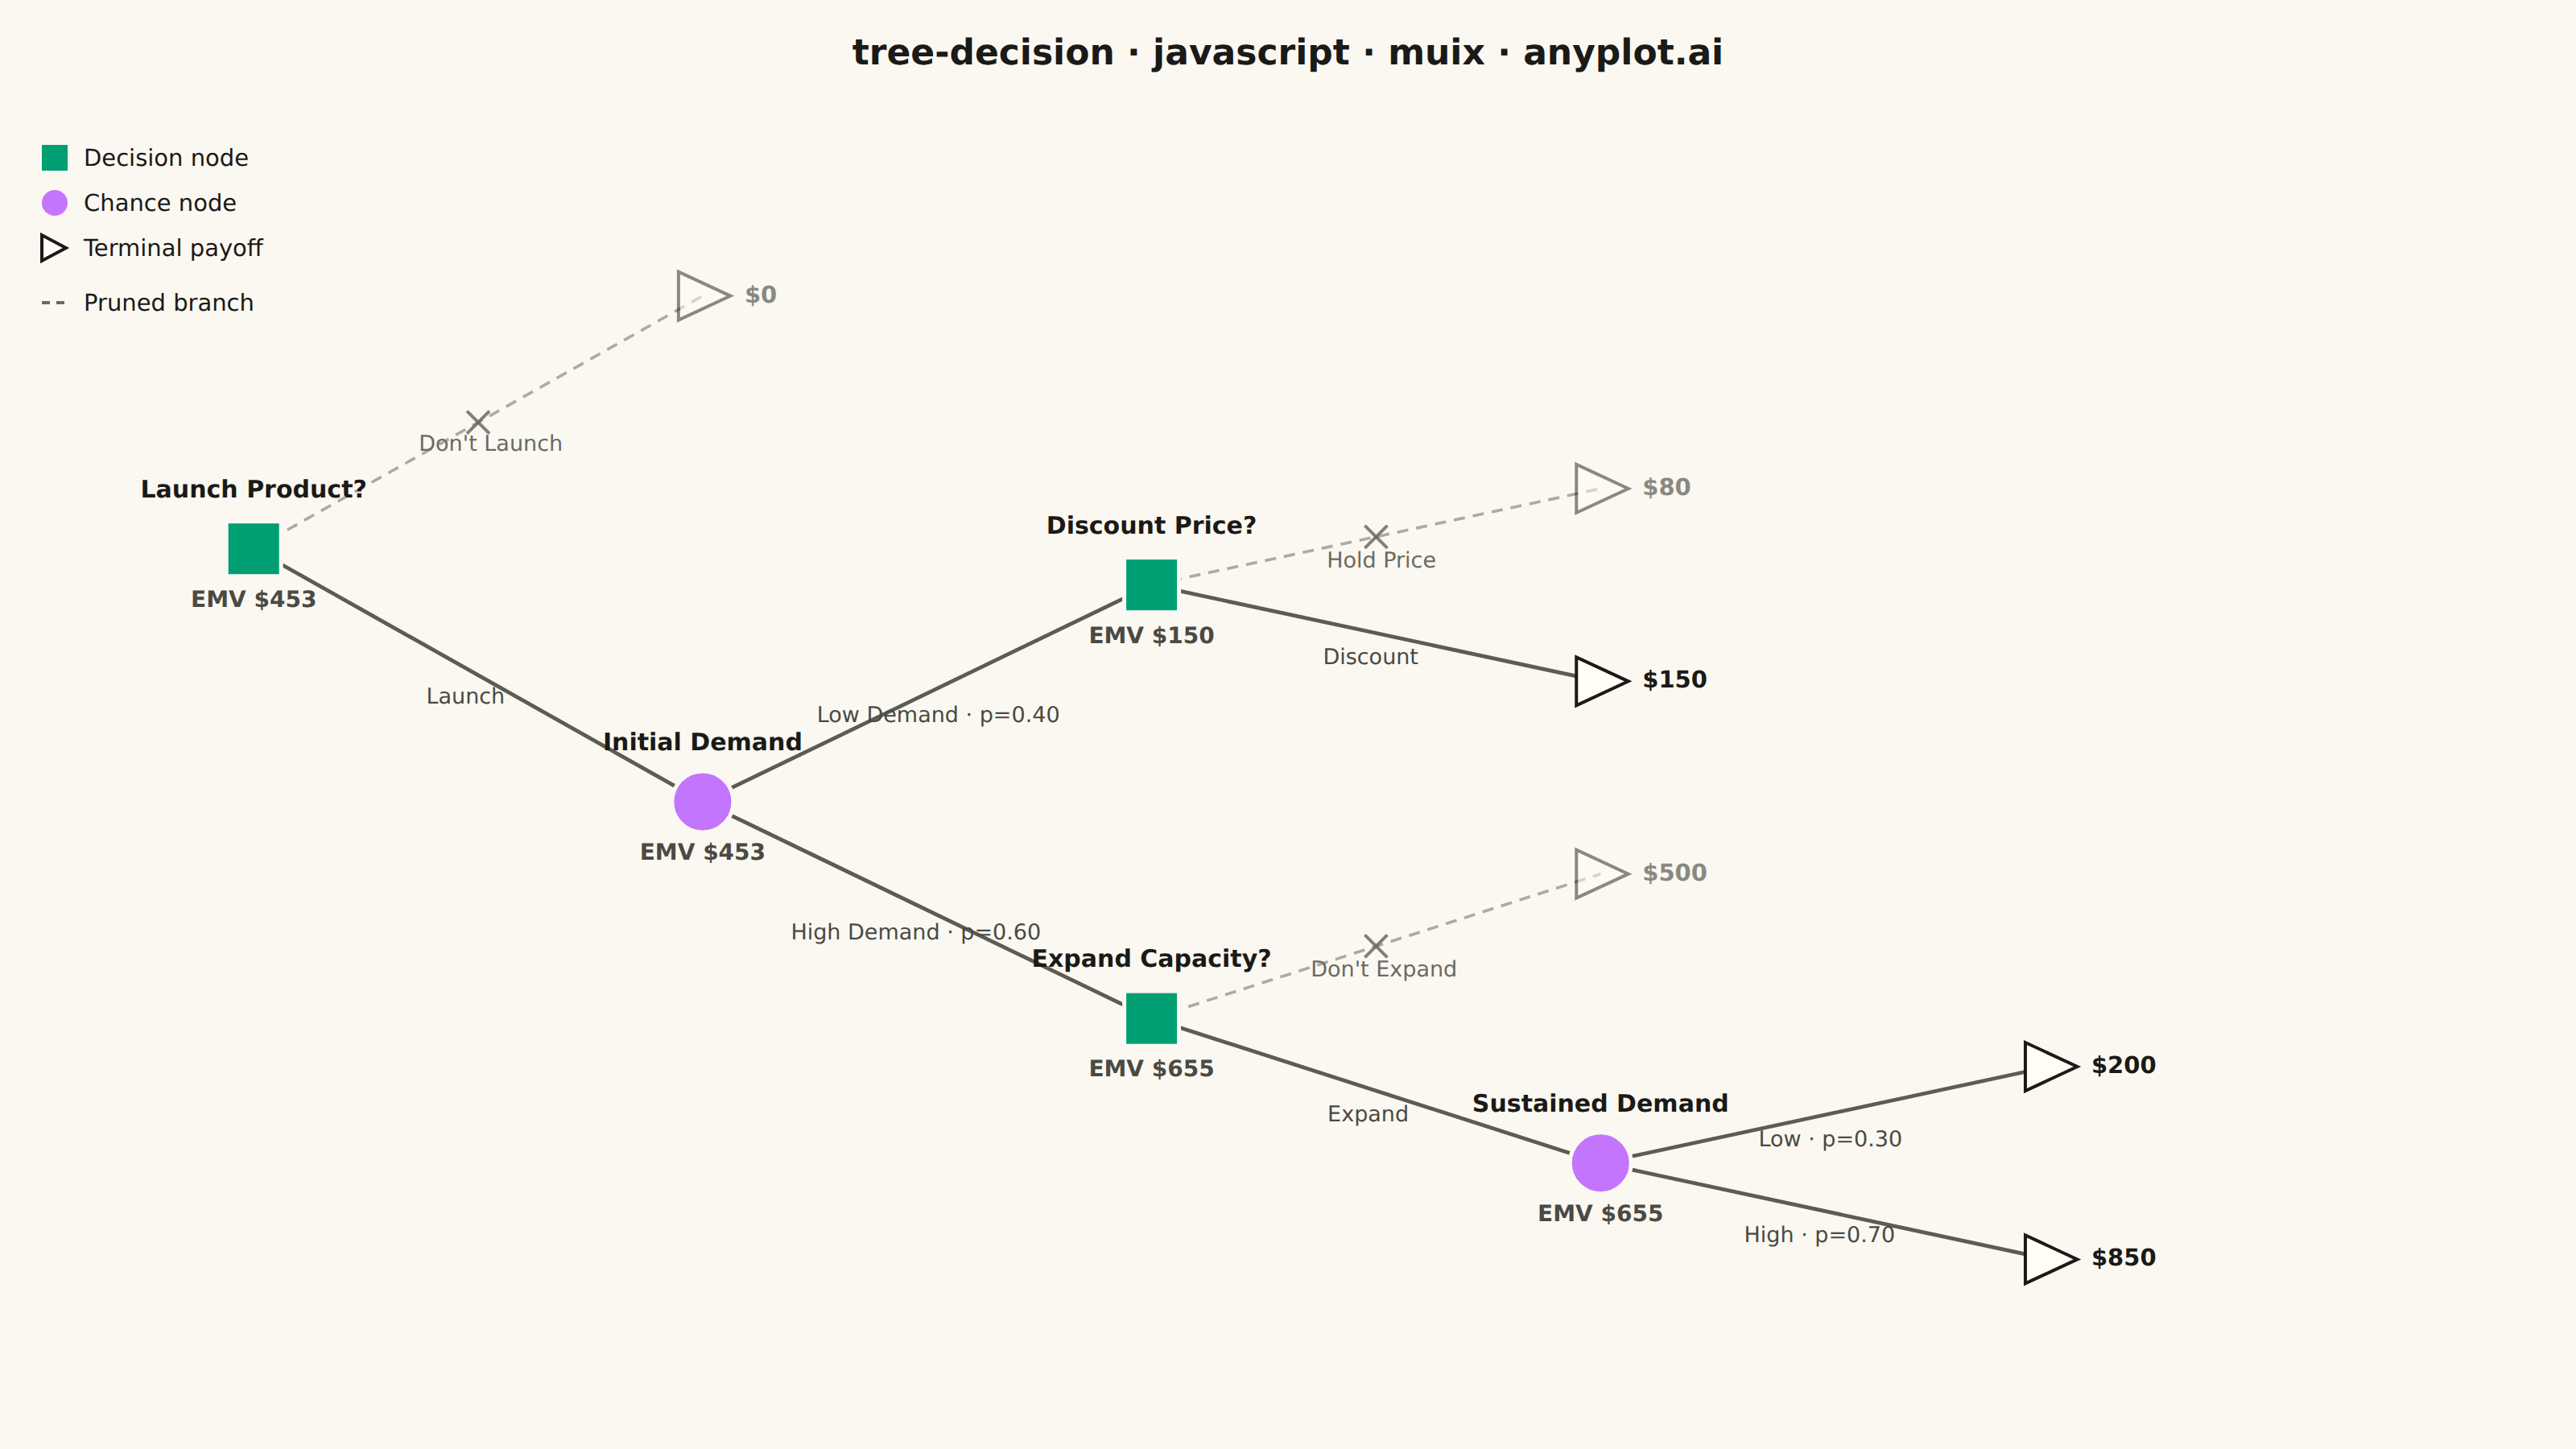
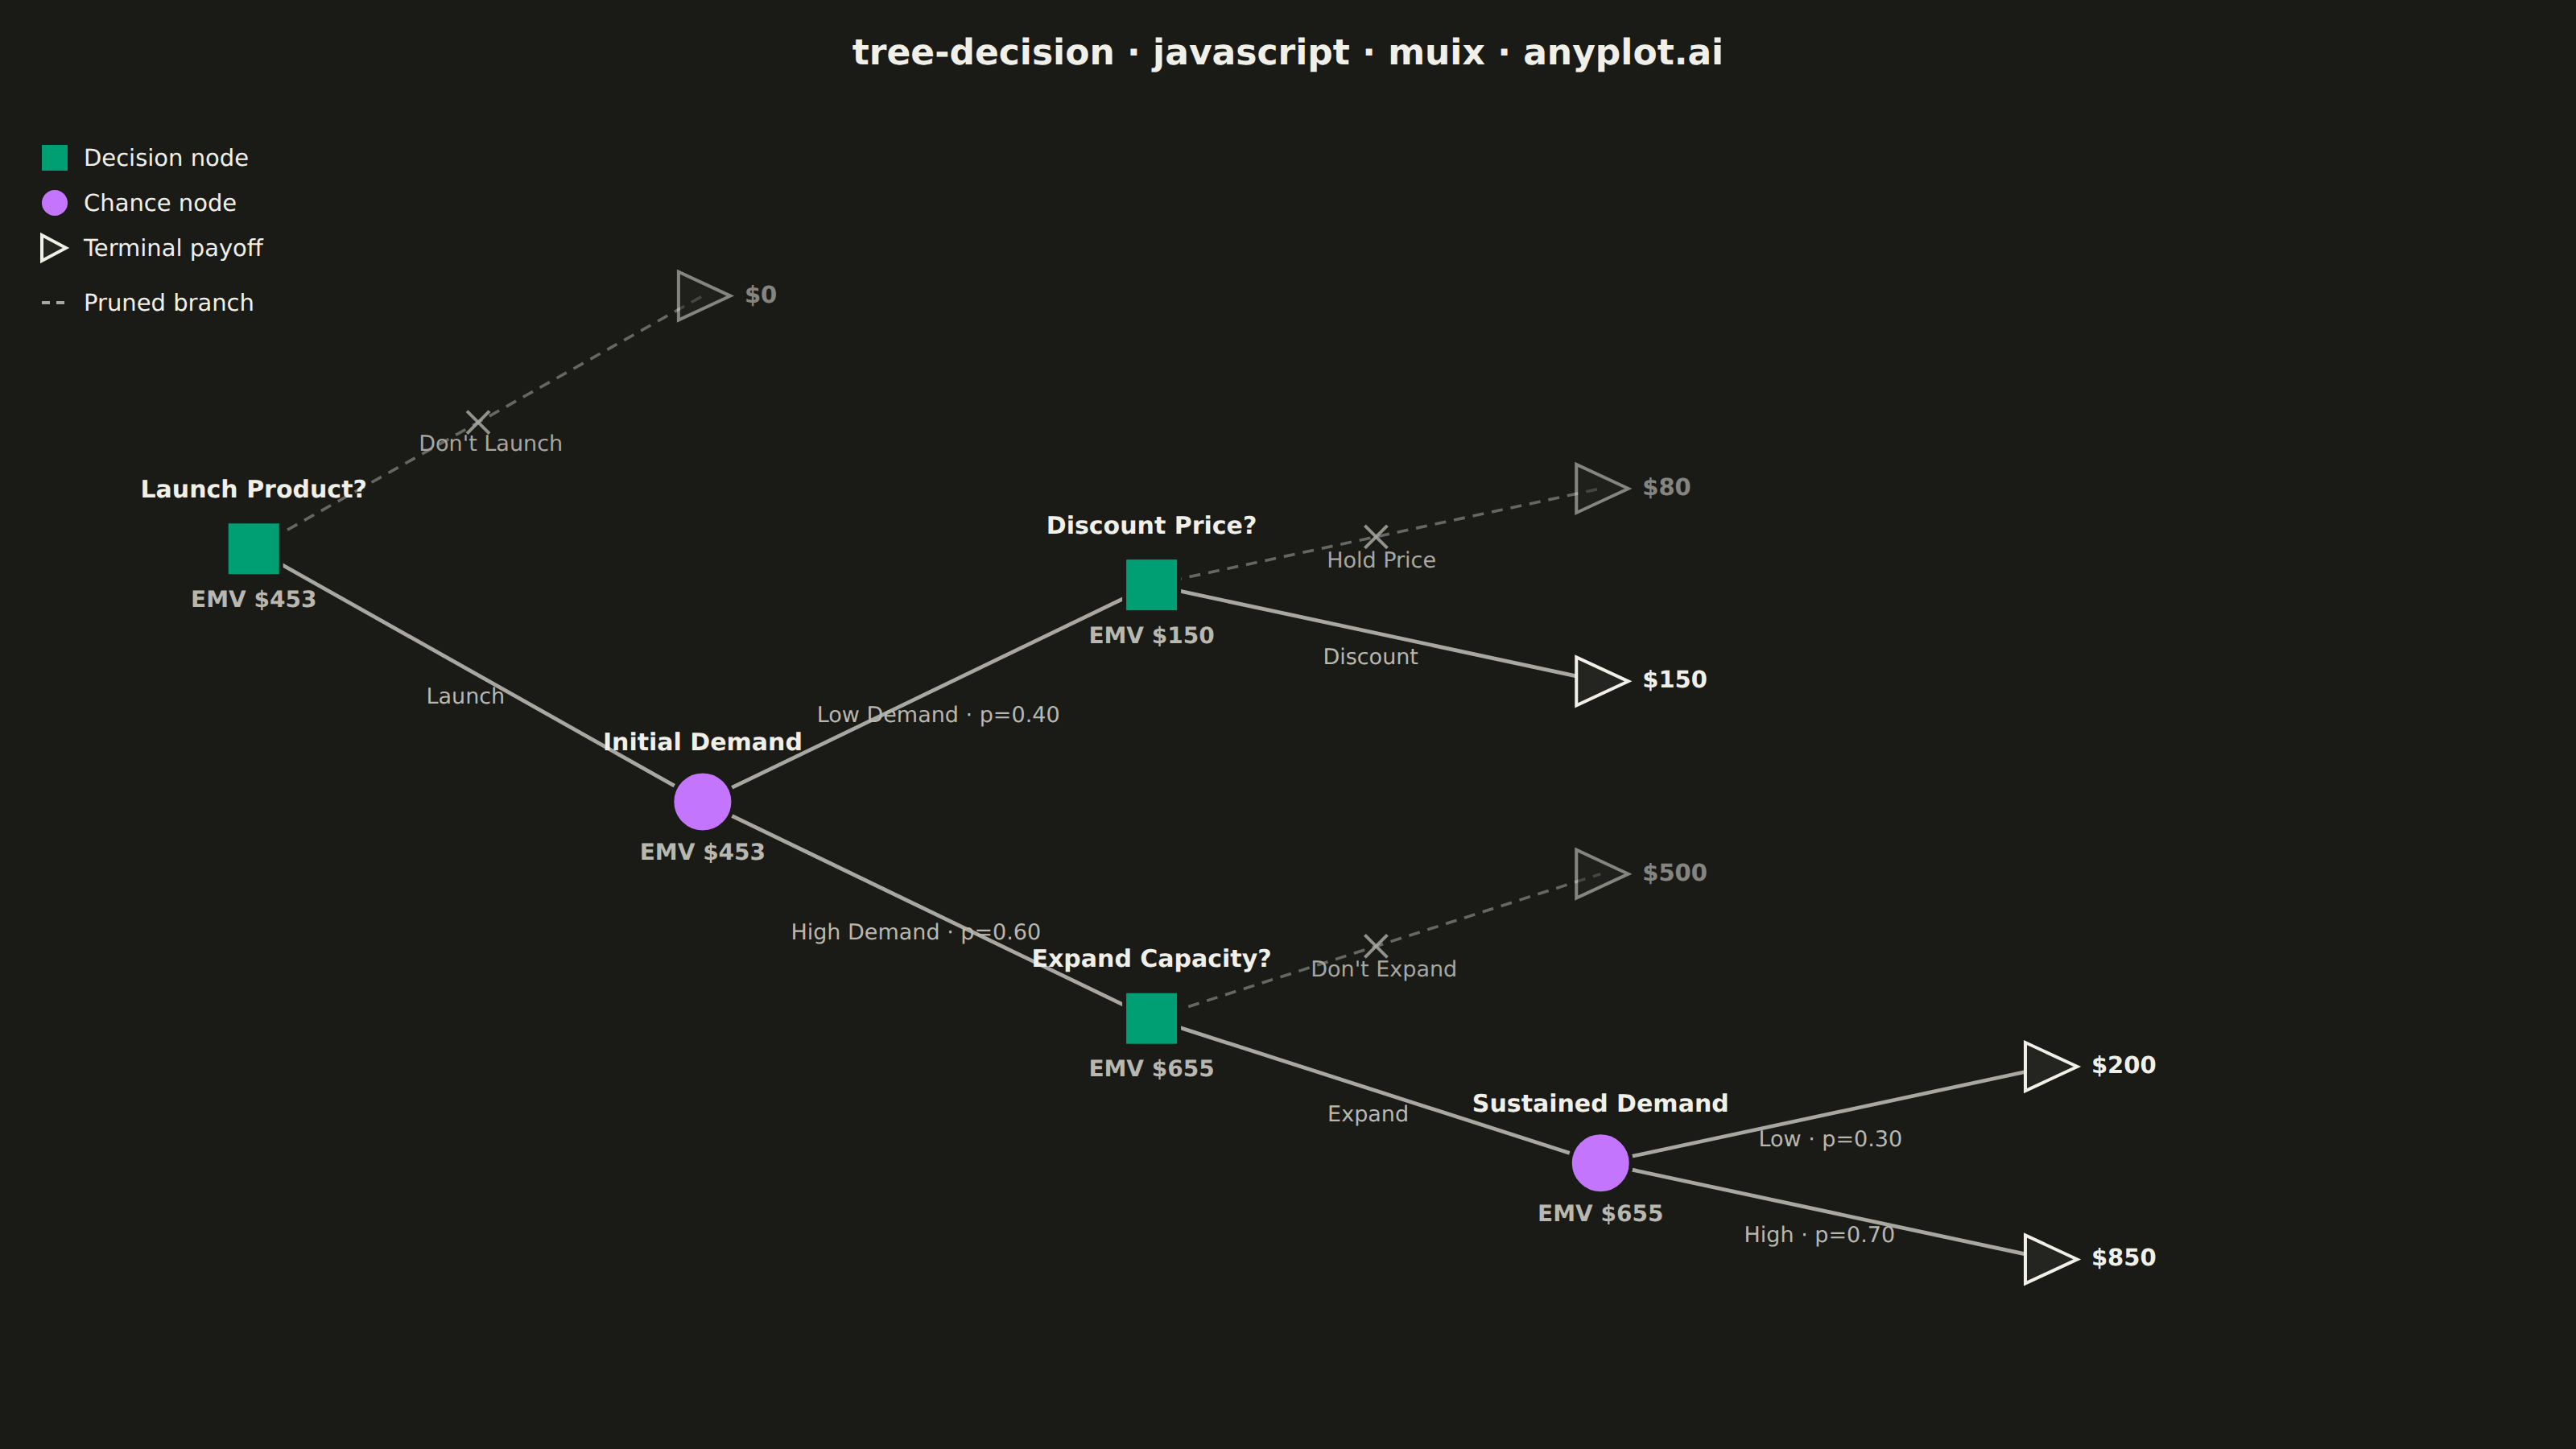
A tree-structured diagram for sequential decision analysis, displaying decision nodes (squares), chance nodes (circles), and terminal outcome nodes (triangles) connected by branching paths. Each chance branch is labeled with probabilities, terminal nodes show payoff values, and Expected Monetary Values (EMV) are calculated via rollback at each node. Rejected (pruned) branches are visually marked, making it easy to trace the optimal decision path through a multi-stage problem.
// anyplot.ai
// tree-decision: Decision Tree Visualization with Probabilities
// Library: muix 7.29.1 | JavaScript 22.23.2
// Quality: 95/100 | Created: 2026-08-26

import { ChartContainer } from "@mui/x-charts/ChartContainer";
import { useXScale, useYScale } from "@mui/x-charts/hooks";

const t = window.ANYPLOT_TOKENS;
// ANYPLOT_TOKENS has no "muted" entry — derive the theme-adaptive muted anchor
// (default-style-guide.md "Semantic anchors") straight from ANYPLOT_THEME.
const MUTED = window.ANYPLOT_THEME === "dark" ? "#A8A79F" : "#6B6A63";
const FONT = "Inter, system-ui, -apple-system, sans-serif";

// --- Data: a two-stage product-launch investment decision -------------------
// decision = square (choose an option), chance = circle (uncertain outcome),
// terminal = triangle (payoff realized). Each non-root node carries the label
// and (for chance branches) probability of the edge leading to it.
const TREE = [
  { id: "D0", type: "decision", parent: null, title: "Launch Product?" },
  { id: "C1", type: "chance", parent: "D0", title: "Initial Demand", branchLabel: "Launch" },
  { id: "T6", type: "terminal", parent: "D0", branchLabel: "Don't Launch", payoff: 0 },
  { id: "D1", type: "decision", parent: "C1", title: "Expand Capacity?", branchLabel: "High Demand", probability: 0.6 },
  { id: "D2", type: "decision", parent: "C1", title: "Discount Price?", branchLabel: "Low Demand", probability: 0.4 },
  { id: "C2", type: "chance", parent: "D1", title: "Sustained Demand", branchLabel: "Expand" },
  { id: "T3", type: "terminal", parent: "D1", branchLabel: "Don't Expand", payoff: 500 },
  { id: "T4", type: "terminal", parent: "D2", branchLabel: "Discount", payoff: 150 },
  { id: "T5", type: "terminal", parent: "D2", branchLabel: "Hold Price", payoff: 80 },
  { id: "T1", type: "terminal", parent: "C2", branchLabel: "High", probability: 0.7, payoff: 850 },
  { id: "T2", type: "terminal", parent: "C2", branchLabel: "Low", probability: 0.3, payoff: 200 },
];

const byId = Object.fromEntries(TREE.map((n) => [n.id, n]));
const childrenOf = (id) => TREE.filter((n) => n.parent === id);

function depthOf(id) {
  let depth = 0;
  let cur = byId[id];
  while (cur.parent) {
    depth += 1;
    cur = byId[cur.parent];
  }
  return depth;
}
TREE.forEach((n) => {
  n.depth = depthOf(n.id);
});

// Leaf nodes get sequential y slots top-to-bottom; every internal node sits at
// the average y of its children, so the tree self-arranges without overlap.
let nextLeafY = 0;
function assignY(id) {
  const kids = childrenOf(id);
  if (kids.length === 0) {
    byId[id].y = nextLeafY;
    nextLeafY += 1;
    return byId[id].y;
  }
  const ys = kids.map((k) => assignY(k.id));
  byId[id].y = (Math.min(...ys) + Math.max(...ys)) / 2;
  return byId[id].y;
}
assignY("D0");

// EMV rollback: terminals carry their payoff; chance nodes take the
// probability-weighted average of children (both branches stay "live" — a
// chance outcome is never rejected); decision nodes take the best child EMV
// and prune every other immediate branch. Pruning is local to the decision
// that rejected it — it must not cascade into the chosen branch's own
// subtree, which has its own (possibly different) optimal choices below it.
function rollback(id) {
  const node = byId[id];
  const kids = childrenOf(id);
  if (node.type === "terminal") {
    node.emv = node.payoff;
    return node.emv;
  }
  const kidEmvs = kids.map((k) => rollback(k.id));
  if (node.type === "chance") {
    node.emv = kids.reduce((sum, k, i) => sum + k.probability * kidEmvs[i], 0);
    kids.forEach((k) => {
      k.pruned = false;
    });
    return node.emv;
  }
  let bestIdx = 0;
  kidEmvs.forEach((v, i) => {
    if (v > kidEmvs[bestIdx]) bestIdx = i;
  });
  node.emv = kidEmvs[bestIdx];
  kids.forEach((k, i) => {
    k.pruned = i !== bestIdx;
  });
  return node.emv;
}
rollback("D0");

const money = (v) => `$${Math.round(v)}`;
const maxDepth = Math.max(...TREE.map((n) => n.depth));
const minY = Math.min(...TREE.map((n) => n.y));
const maxY = Math.max(...TREE.map((n) => n.y));
const X_DOMAIN = [-0.35, maxDepth + 0.85];
const Y_DOMAIN = [minY - 0.65, maxY + 0.65];

function edgeLabel(node) {
  if (node.probability != null) return `${node.branchLabel} · p=${node.probability.toFixed(2)}`;
  return node.branchLabel;
}

// --- Custom marks — drawn on the MUI X coordinate system --------------------
function TreeEdges() {
  const xs = useXScale();
  const ys = useYScale();
  return (
    <g fontFamily={FONT}>
      {TREE.filter((n) => n.parent).map((n) => {
        const parent = byId[n.parent];
        const x1 = xs(parent.depth);
        const y1 = ys(parent.y);
        const x2 = xs(n.depth);
        const y2 = ys(n.y);
        const mx = (x1 + x2) / 2;
        const my = (y1 + y2) / 2;
        const angle = Math.atan2(y2 - y1, x2 - x1);
        const nx = -Math.sin(angle);
        const ny = Math.cos(angle);
        const lx = mx + nx * 16;
        const ly = my + ny * 16;
        return (
          <g key={n.id}>
            <line
              x1={x1}
              y1={y1}
              x2={x2}
              y2={y2}
              stroke={n.pruned ? MUTED : t.inkSoft}
              strokeWidth={n.pruned ? 1.8 : 2.4}
              strokeDasharray={n.pruned ? "7 5" : undefined}
              strokeOpacity={n.pruned ? 0.55 : 0.9}
            />
            {n.pruned && (
              <g stroke={MUTED} strokeWidth={2} strokeOpacity={0.85}>
                <line x1={mx - 7} y1={my - 7} x2={mx + 7} y2={my + 7} />
                <line x1={mx - 7} y1={my + 7} x2={mx + 7} y2={my - 7} />
              </g>
            )}
            <text
              x={lx}
              y={ly}
              fontSize={13.5}
              fill={n.pruned ? MUTED : t.inkSoft}
              textAnchor="middle"
              dominantBaseline="middle"
            >
              {edgeLabel(n)}
            </text>
          </g>
        );
      })}
    </g>
  );
}

function DecisionMark({ cx, cy, fill }) {
  const s = 17;
  return <rect x={cx - s} y={cy - s} width={s * 2} height={s * 2} fill={fill} stroke={t.pageBg} strokeWidth={2.5} />;
}

function ChanceMark({ cx, cy, fill }) {
  return <circle cx={cx} cy={cy} r={19} fill={fill} stroke={t.pageBg} strokeWidth={2.5} />;
}

function TerminalMark({ cx, cy }) {
  const w = 15;
  const h = 15;
  const points = `${cx - w},${cy - h} ${cx - w},${cy + h} ${cx + w * 1.15},${cy}`;
  return <polygon points={points} fill={t.elevatedBg} stroke={t.ink} strokeWidth={2} />;
}

function TreeNodes() {
  const xs = useXScale();
  const ys = useYScale();
  return (
    <g fontFamily={FONT}>
      {TREE.map((n) => {
        const cx = xs(n.depth);
        const cy = ys(n.y);
        const dimmed = n.pruned;
        return (
          <g key={n.id} opacity={dimmed ? 0.5 : 1}>
            {n.type === "decision" && <DecisionMark cx={cx} cy={cy} fill={t.palette[0]} />}
            {n.type === "chance" && <ChanceMark cx={cx} cy={cy} fill={t.palette[1]} />}
            {n.type === "terminal" && <TerminalMark cx={cx} cy={cy} />}

            {n.type !== "terminal" && (
              <>
                <text x={cx} y={cy - 32} fontSize={15} fontWeight={600} fill={t.ink} textAnchor="middle">
                  {n.title}
                </text>
                <text x={cx} y={cy + 36} fontSize={14} fontWeight={600} fill={t.inkSoft} textAnchor="middle">
                  EMV {money(n.emv)}
                </text>
              </>
            )}
            {n.type === "terminal" && (
              <text x={cx + 26} y={cy} fontSize={14.5} fontWeight={600} fill={t.ink} dominantBaseline="middle">
                {money(n.payoff)}
              </text>
            )}
          </g>
        );
      })}
    </g>
  );
}

function Legend() {
  const items = [
    { label: "Decision node", shape: "square", color: t.palette[0] },
    { label: "Chance node", shape: "circle", color: t.palette[1] },
    { label: "Terminal payoff", shape: "triangle", color: t.ink },
  ];
  return (
    <g transform="translate(26, 24)" fontFamily={FONT}>
      {items.map((item, i) => (
        <g key={item.label} transform={`translate(0, ${i * 28})`}>
          {item.shape === "square" && <rect x={0} y={0} width={16} height={16} fill={item.color} />}
          {item.shape === "circle" && <circle cx={8} cy={8} r={8} fill={item.color} />}
          {item.shape === "triangle" && (
            <polygon points="0,0 0,16 15,8" fill={t.elevatedBg} stroke={item.color} strokeWidth={2} />
          )}
          <text x={26} y={13} fontSize={14.5} fill={t.ink}>
            {item.label}
          </text>
        </g>
      ))}
      <g transform={`translate(0, ${items.length * 28 + 6})`}>
        <line x1={0} y1={8} x2={16} y2={8} stroke={MUTED} strokeWidth={2} strokeDasharray="5 4" />
        <text x={26} y={13} fontSize={14.5} fill={t.ink}>
          Pruned branch
        </text>
      </g>
    </g>
  );
}

const TITLE_H = 66;

export default function Chart() {
  const W = window.ANYPLOT_SIZE.width;
  const H = window.ANYPLOT_SIZE.height;
  return (
    <div
      style={{
        width: W,
        height: H,
        background: t.pageBg,
        fontFamily: FONT,
        display: "flex",
        flexDirection: "column",
      }}
    >
      <div style={{ height: TITLE_H, display: "flex", alignItems: "center", justifyContent: "center" }}>
        <span style={{ fontSize: 22, fontWeight: 600, color: t.ink }}>
          tree-decision · javascript · muix · anyplot.ai
        </span>
      </div>
      <ChartContainer
        width={W}
        height={H - TITLE_H}
        skipAnimation
        series={[]}
        margin={{ top: 40, right: 90, bottom: 40, left: 60 }}
        xAxis={[{ min: X_DOMAIN[0], max: X_DOMAIN[1], scaleType: "linear" }]}
        yAxis={[{ min: Y_DOMAIN[0], max: Y_DOMAIN[1], scaleType: "linear" }]}
      >
        <TreeEdges />
        <TreeNodes />
        <Legend />
      </ChartContainer>
    </div>
  );
}
Runnable source as JSON, for any HTTP client: https://api.anyplot.ai/specs/tree-decision/muix/code. Any spec id and library id listed in llms-full.txt fit the same URL shape; every URL below is complete and callable.
{
  "spec_id": "tree-decision",
  "language": "javascript",
  "library": "muix",
  "page": "https://anyplot.ai/tree-decision/javascript/muix",
  "hub": "https://anyplot.ai/tree-decision",
  "code_json": "https://api.anyplot.ai/specs/tree-decision/muix/code",
  "spec_json": "https://api.anyplot.ai/specs/tree-decision",
  "render_light_png": "https://storage.googleapis.com/anyplot-images/plots/tree-decision/javascript/muix/plot-light.png",
  "render_dark_png": "https://storage.googleapis.com/anyplot-images/plots/tree-decision/javascript/muix/plot-dark.png",
  "interactive_light_html": "https://storage.googleapis.com/anyplot-images/plots/tree-decision/javascript/muix/plot-light.html",
  "interactive_dark_html": "https://storage.googleapis.com/anyplot-images/plots/tree-decision/javascript/muix/plot-dark.html",
  "quality_score": 95.0,
  "license": "MIT",
  "guide": "https://anyplot.ai/llms.txt"
}
Part of Decision Tree Visualization with Probabilities on anyplot.ai.