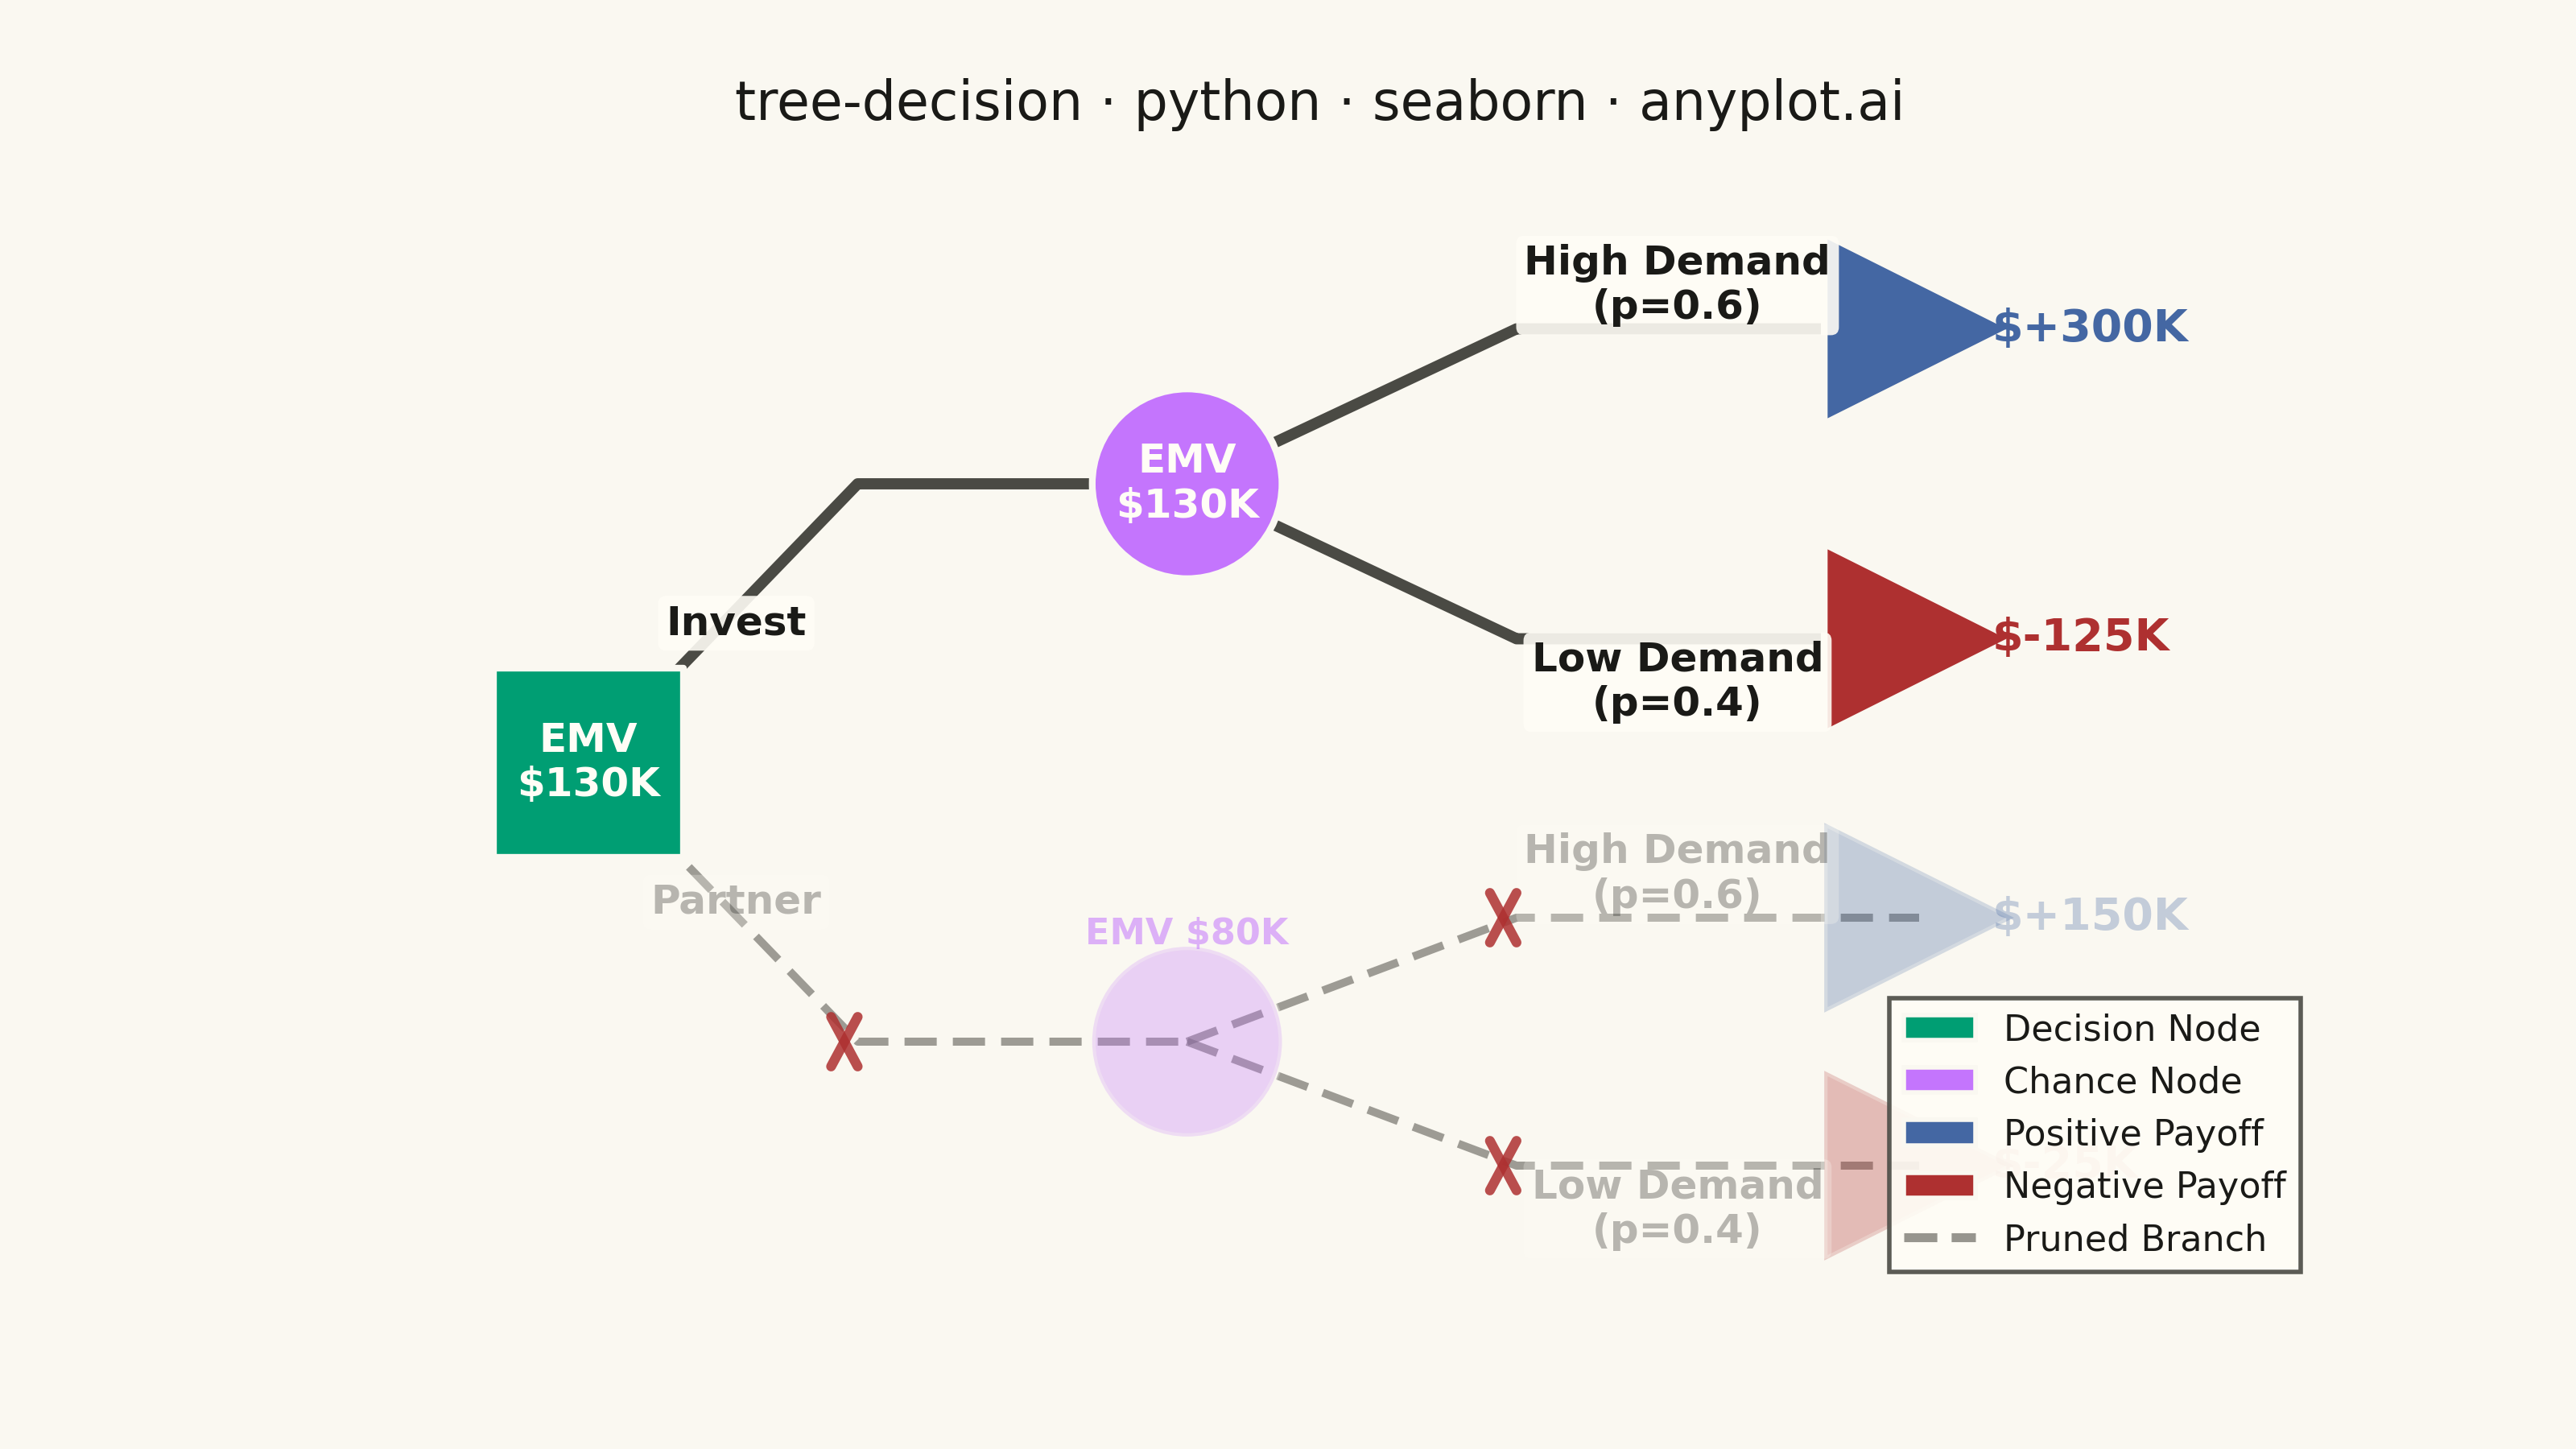
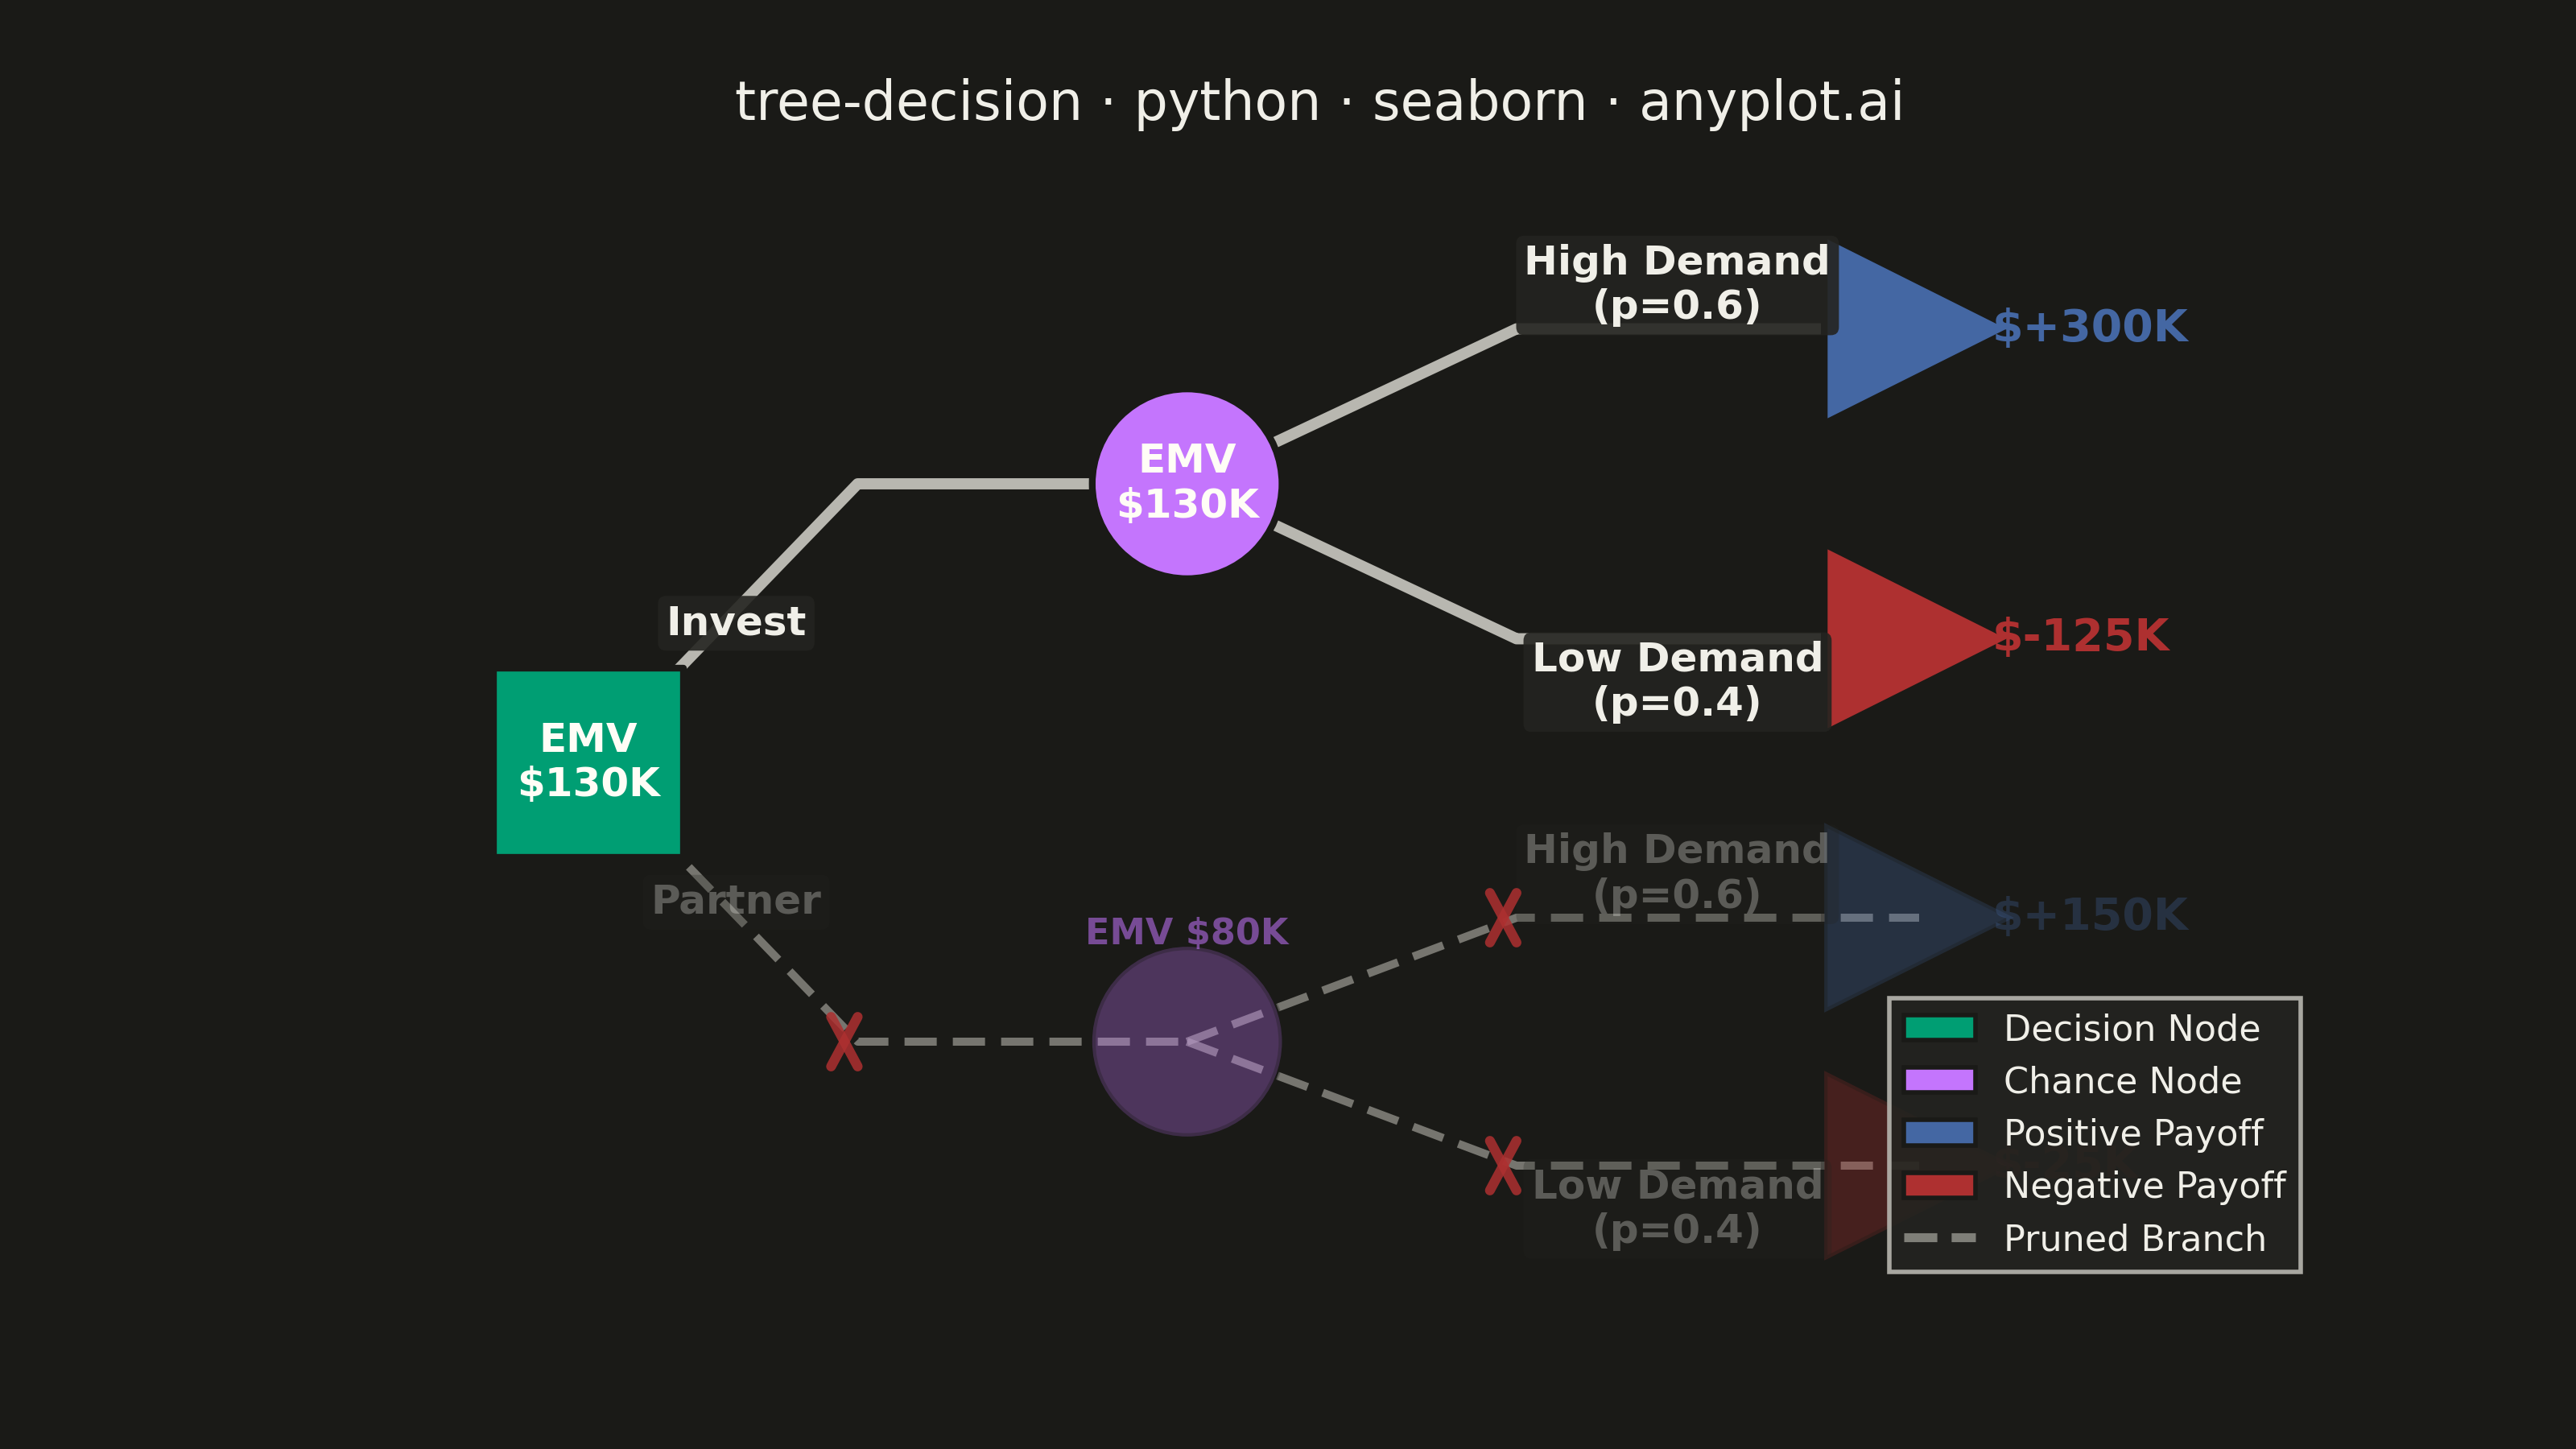
A tree-structured diagram for sequential decision analysis, displaying decision nodes (squares), chance nodes (circles), and terminal outcome nodes (triangles) connected by branching paths. Each chance branch is labeled with probabilities, terminal nodes show payoff values, and Expected Monetary Values (EMV) are calculated via rollback at each node. Rejected (pruned) branches are visually marked, making it easy to trace the optimal decision path through a multi-stage problem.
""" anyplot.ai
tree-decision: Decision Tree Visualization with Probabilities
Library: seaborn 0.13.2 | Python 3.13.13
Quality: 91/100 | Updated: 2026-06-02
"""

import os

import matplotlib.patches as mpatches
import matplotlib.pyplot as plt
import pandas as pd
import seaborn as sns


# Theme tokens — Imprint palette + theme-adaptive chrome
THEME = os.getenv("ANYPLOT_THEME", "light")
PAGE_BG = "#FAF8F1" if THEME == "light" else "#1A1A17"
ELEVATED_BG = "#FFFDF6" if THEME == "light" else "#242420"
INK = "#1A1A17" if THEME == "light" else "#F0EFE8"
INK_SOFT = "#4A4A44" if THEME == "light" else "#B8B7B0"
INK_MUTED = "#6B6A63" if THEME == "light" else "#A8A79F"

# Imprint categorical palette (canonical order — position 1 always first series)
IMPRINT_PALETTE = ["#009E73", "#C475FD", "#4467A3", "#BD8233", "#AE3030", "#2ABCCD", "#954477", "#99B314"]

DECISION_COLOR = IMPRINT_PALETTE[0]  # #009E73 brand green — first series / decision nodes
CHANCE_COLOR = IMPRINT_PALETTE[1]  # #C475FD lavender — chance nodes
TERMINAL_POS = IMPRINT_PALETTE[2]  # #4467A3 blue — positive payoff terminals
TERMINAL_NEG = IMPRINT_PALETTE[4]  # #AE3030 matte red — semantic anchor for loss/negative
PRUNE_COLOR = IMPRINT_PALETTE[4]  # #AE3030 for X marks on pruned branches

PRUNED_ALPHA = 0.30
NODE_TEXT = "#FFFDF6"  # warm white — legible inside colored node markers

sns.set_theme(
    style="white",
    rc={
        "figure.facecolor": PAGE_BG,
        "axes.facecolor": PAGE_BG,
        "axes.edgecolor": INK_SOFT,
        "axes.labelcolor": INK,
        "text.color": INK,
        "xtick.color": INK_SOFT,
        "ytick.color": INK_SOFT,
        "grid.color": INK,
        "grid.alpha": 0.15,
        "legend.facecolor": ELEVATED_BG,
        "legend.edgecolor": INK_SOFT,
    },
)

# Decision tree data — two-stage R&D investment decision (go / no-go)
tree = [
    {
        "id": "D1",
        "type": "decision",
        "parent": None,
        "label": "",
        "prob": None,
        "payoff": None,
        "emv": 130,
        "pruned": False,
        "x": 1.5,
        "y": 3.0,
    },
    {
        "id": "C1",
        "type": "chance",
        "parent": "D1",
        "label": "Invest",
        "prob": None,
        "payoff": None,
        "emv": 130,
        "pruned": False,
        "x": 6.0,
        "y": 4.8,
    },
    {
        "id": "C2",
        "type": "chance",
        "parent": "D1",
        "label": "Partner",
        "prob": None,
        "payoff": None,
        "emv": 80,
        "pruned": True,
        "x": 6.0,
        "y": 1.2,
    },
    {
        "id": "T1",
        "type": "terminal",
        "parent": "C1",
        "label": "High Demand",
        "prob": 0.6,
        "payoff": 300,
        "emv": None,
        "pruned": False,
        "x": 11.5,
        "y": 5.8,
    },
    {
        "id": "T2",
        "type": "terminal",
        "parent": "C1",
        "label": "Low Demand",
        "prob": 0.4,
        "payoff": -125,
        "emv": None,
        "pruned": False,
        "x": 11.5,
        "y": 3.8,
    },
    {
        "id": "T3",
        "type": "terminal",
        "parent": "C2",
        "label": "High Demand",
        "prob": 0.6,
        "payoff": 150,
        "emv": None,
        "pruned": True,
        "x": 11.5,
        "y": 2.0,
    },
    {
        "id": "T4",
        "type": "terminal",
        "parent": "C2",
        "label": "Low Demand",
        "prob": 0.4,
        "payoff": -25,
        "emv": None,
        "pruned": True,
        "x": 11.5,
        "y": 0.4,
    },
]

node_map = {n["id"]: n for n in tree}

# Branch DataFrame — sns.lineplot with units draws one polyline per segment (idiomatic seaborn)
branch_rows = []
for node in tree:
    if node["parent"] is None:
        continue
    parent = node_map[node["parent"]]
    px, py = parent["x"], parent["y"]
    nx, ny = node["x"], node["y"]
    mid_x = px + (nx - px) * 0.45
    seg_id = f"{parent['id']}-{node['id']}"
    style = "pruned" if node["pruned"] else "optimal"
    branch_rows.append({"seg": seg_id, "x": px, "y": py, "style": style})
    branch_rows.append({"seg": seg_id, "x": mid_x, "y": ny, "style": style})
    branch_rows.append({"seg": seg_id, "x": nx, "y": ny, "style": style})

branch_df = pd.DataFrame(branch_rows)
# seaborn size aesthetic maps to linewidth — encodes branch importance in single call
branch_df["lw"] = branch_df["style"].map({"optimal": 2.5, "pruned": 1.8})

# Node DataFrame — sns.scatterplot with hue/style gives categorical shape + color encoding
node_rows = []
for node in tree:
    if node["type"] == "decision":
        category = "Decision"
    elif node["type"] == "chance":
        category = "Chance"
    else:
        category = "Positive Payoff" if node["payoff"] >= 0 else "Negative Payoff"
    node_rows.append({"x": node["x"], "y": node["y"], "category": category, "pruned": node["pruned"]})

node_df = pd.DataFrame(node_rows)

marker_map = {
    "Decision": "s",  # square — decision nodes
    "Chance": "o",  # circle — chance nodes
    "Positive Payoff": ">",  # right-pointing triangle — positive terminal
    "Negative Payoff": ">",  # right-pointing triangle — negative terminal
}
color_map = {
    "Decision": DECISION_COLOR,
    "Chance": CHANCE_COLOR,
    "Positive Payoff": TERMINAL_POS,
    "Negative Payoff": TERMINAL_NEG,
}

# Plot
fig, ax = plt.subplots(figsize=(8, 4.5), dpi=400, facecolor=PAGE_BG)
ax.set_facecolor(PAGE_BG)

# Branches — single seaborn call with hue+style+size+units (all four seaborn aesthetics)
# Combines branch type, line style, and line weight encoding in one idiomatic call
n_lines_before = len(ax.lines)
sns.lineplot(
    data=branch_df,
    x="x",
    y="y",
    hue="style",
    style="style",
    size="lw",
    dashes={"optimal": (1, 0), "pruned": (4, 2)},
    palette={"optimal": INK_SOFT, "pruned": INK_MUTED},
    sizes=(1.8, 2.5),
    units="seg",
    estimator=None,
    sort=False,
    ax=ax,
    legend=False,
)
# Dim pruned lines — hue draws "optimal" before "pruned" (alphabetical), so pruned lines are last
n_optimal_segs = branch_df[branch_df["style"] == "optimal"]["seg"].nunique()
for line in ax.lines[n_lines_before + n_optimal_segs :]:
    line.set_alpha(0.65)

# Nodes — active at full opacity, pruned faded
active_nodes = node_df[~node_df["pruned"]]
pruned_nodes = node_df[node_df["pruned"]]

sns.scatterplot(
    data=active_nodes,
    x="x",
    y="y",
    hue="category",
    style="category",
    markers=marker_map,
    palette=color_map,
    s=1800,
    edgecolor=PAGE_BG,
    linewidth=1.5,
    ax=ax,
    legend=False,
    zorder=3,
)
sns.scatterplot(
    data=pruned_nodes,
    x="x",
    y="y",
    hue="category",
    style="category",
    markers=marker_map,
    palette=color_map,
    s=1800,
    edgecolor=PAGE_BG,
    linewidth=1.5,
    alpha=PRUNED_ALPHA,
    ax=ax,
    legend=False,
    zorder=3,
)

# EMV labels inside active nodes; above pruned nodes
for node in tree:
    nx, ny = node["x"], node["y"]
    al = PRUNED_ALPHA if node["pruned"] else 1.0

    if node["type"] in ("decision", "chance"):
        node_color = DECISION_COLOR if node["type"] == "decision" else CHANCE_COLOR
        if node["pruned"]:
            ax.text(
                nx,
                ny + 0.58,
                f"EMV ${node['emv']}K",
                fontsize=8,
                fontweight="bold",
                ha="center",
                va="bottom",
                color=node_color,
                alpha=max(al, 0.55),
                zorder=4,
            )
        else:
            ax.text(
                nx,
                ny,
                f"EMV\n${node['emv']}K",
                fontsize=9,
                fontweight="bold",
                ha="center",
                va="center",
                color=NODE_TEXT,
                zorder=4,
            )
    elif node["type"] == "terminal":
        tc = TERMINAL_POS if node["payoff"] >= 0 else TERMINAL_NEG
        sign = "+" if node["payoff"] >= 0 else ""
        ax.text(
            nx + 0.55,
            ny,
            f"${sign}{node['payoff']}K",
            fontsize=10,
            fontweight="bold",
            ha="left",
            va="center",
            color=tc,
            alpha=al,
            zorder=4,
        )

# Branch labels + pruned X marks
for node in tree:
    if node["parent"] is None:
        continue
    parent = node_map[node["parent"]]
    px, py = parent["x"], parent["y"]
    nx, ny = node["x"], node["y"]
    al = PRUNED_ALPHA if node["pruned"] else 1.0
    mid_x = px + (nx - px) * 0.45

    label_text = node["label"]
    if node["prob"] is not None:
        label_text = f"{node['label']}\n(p={node['prob']:.1f})"
        # Place on horizontal segment past the elbow — avoids overlapping parent chance node
        label_x = mid_x + (nx - mid_x) * 0.4
        label_y = ny + (0.28 if ny >= py else -0.28)
    else:
        label_x = (px + mid_x) / 2 + 0.1
        label_y = (py + ny) / 2
    ax.text(
        label_x,
        label_y,
        label_text,
        fontsize=9,
        fontweight="bold",
        ha="center",
        va="center",
        color=INK,
        alpha=al,
        bbox={"boxstyle": "round,pad=0.2", "facecolor": ELEVATED_BG, "edgecolor": "none", "alpha": 0.90 * al},
    )

    # Double-strike X mark for pruned branches
    if node["pruned"]:
        mark_x = mid_x - 0.1
        mark_y = ny
        ax.plot(
            [mark_x - 0.10, mark_x + 0.10],
            [mark_y - 0.16, mark_y + 0.16],
            color=PRUNE_COLOR,
            linewidth=2.2,
            alpha=0.85,
            zorder=5,
        )
        ax.plot(
            [mark_x - 0.10, mark_x + 0.10],
            [mark_y + 0.16, mark_y - 0.16],
            color=PRUNE_COLOR,
            linewidth=2.2,
            alpha=0.85,
            zorder=5,
        )

# Style
legend_elements = [
    mpatches.Patch(facecolor=DECISION_COLOR, edgecolor=PAGE_BG, label="Decision Node"),
    mpatches.Patch(facecolor=CHANCE_COLOR, edgecolor=PAGE_BG, label="Chance Node"),
    mpatches.Patch(facecolor=TERMINAL_POS, edgecolor=PAGE_BG, label="Positive Payoff"),
    mpatches.Patch(facecolor=TERMINAL_NEG, edgecolor=PAGE_BG, label="Negative Payoff"),
    plt.Line2D([0], [0], color=INK_MUTED, linestyle="--", linewidth=2, alpha=0.7, label="Pruned Branch"),
]
ax.legend(
    handles=legend_elements,
    loc="lower right",
    fontsize=8,
    framealpha=0.9,
    facecolor=ELEVATED_BG,
    edgecolor=INK_SOFT,
    fancybox=False,
)

title = "tree-decision · python · seaborn · anyplot.ai"
n = len(title)
ratio = 67 / n if n > 67 else 1.0
title_fontsize = max(8, round(12 * ratio))
ax.set_title(title, fontsize=title_fontsize, fontweight="medium", pad=12, color=INK)
ax.set_xlim(-0.5, 14.5)
ax.set_ylim(-0.4, 6.8)
ax.axis("off")

# Save — no bbox_inches="tight" (seaborn canvas rule: figsize × dpi must land exactly)
plt.savefig(f"plot-{THEME}.png", dpi=400, facecolor=PAGE_BG)
Runnable source as JSON, for any HTTP client: https://api.anyplot.ai/specs/tree-decision/seaborn/code. Any spec id and library id listed in llms-full.txt fit the same URL shape; every URL below is complete and callable.
{
  "spec_id": "tree-decision",
  "language": "python",
  "library": "seaborn",
  "page": "https://anyplot.ai/tree-decision/python/seaborn",
  "hub": "https://anyplot.ai/tree-decision",
  "code_json": "https://api.anyplot.ai/specs/tree-decision/seaborn/code",
  "spec_json": "https://api.anyplot.ai/specs/tree-decision",
  "render_light_png": "https://storage.googleapis.com/anyplot-images/plots/tree-decision/python/seaborn/plot-light.png",
  "render_dark_png": "https://storage.googleapis.com/anyplot-images/plots/tree-decision/python/seaborn/plot-dark.png",
  "quality_score": 91.0,
  "license": "MIT",
  "guide": "https://anyplot.ai/llms.txt"
}
Part of Decision Tree Visualization with Probabilities on anyplot.ai.