The same plot in 14 other libraries — JavaScript: D3.js, Apache ECharts, Highcharts, MUI X Charts; Python: Altair, Bokeh, lets-plot, Matplotlib, Plotly, plotnine, Pygal, Seaborn; R: ggplot2; Julia: Makie.jl. Compare all 15 side by side: Decision Tree Visualization with Probabilities in Python, R, Julia and JavaScript.
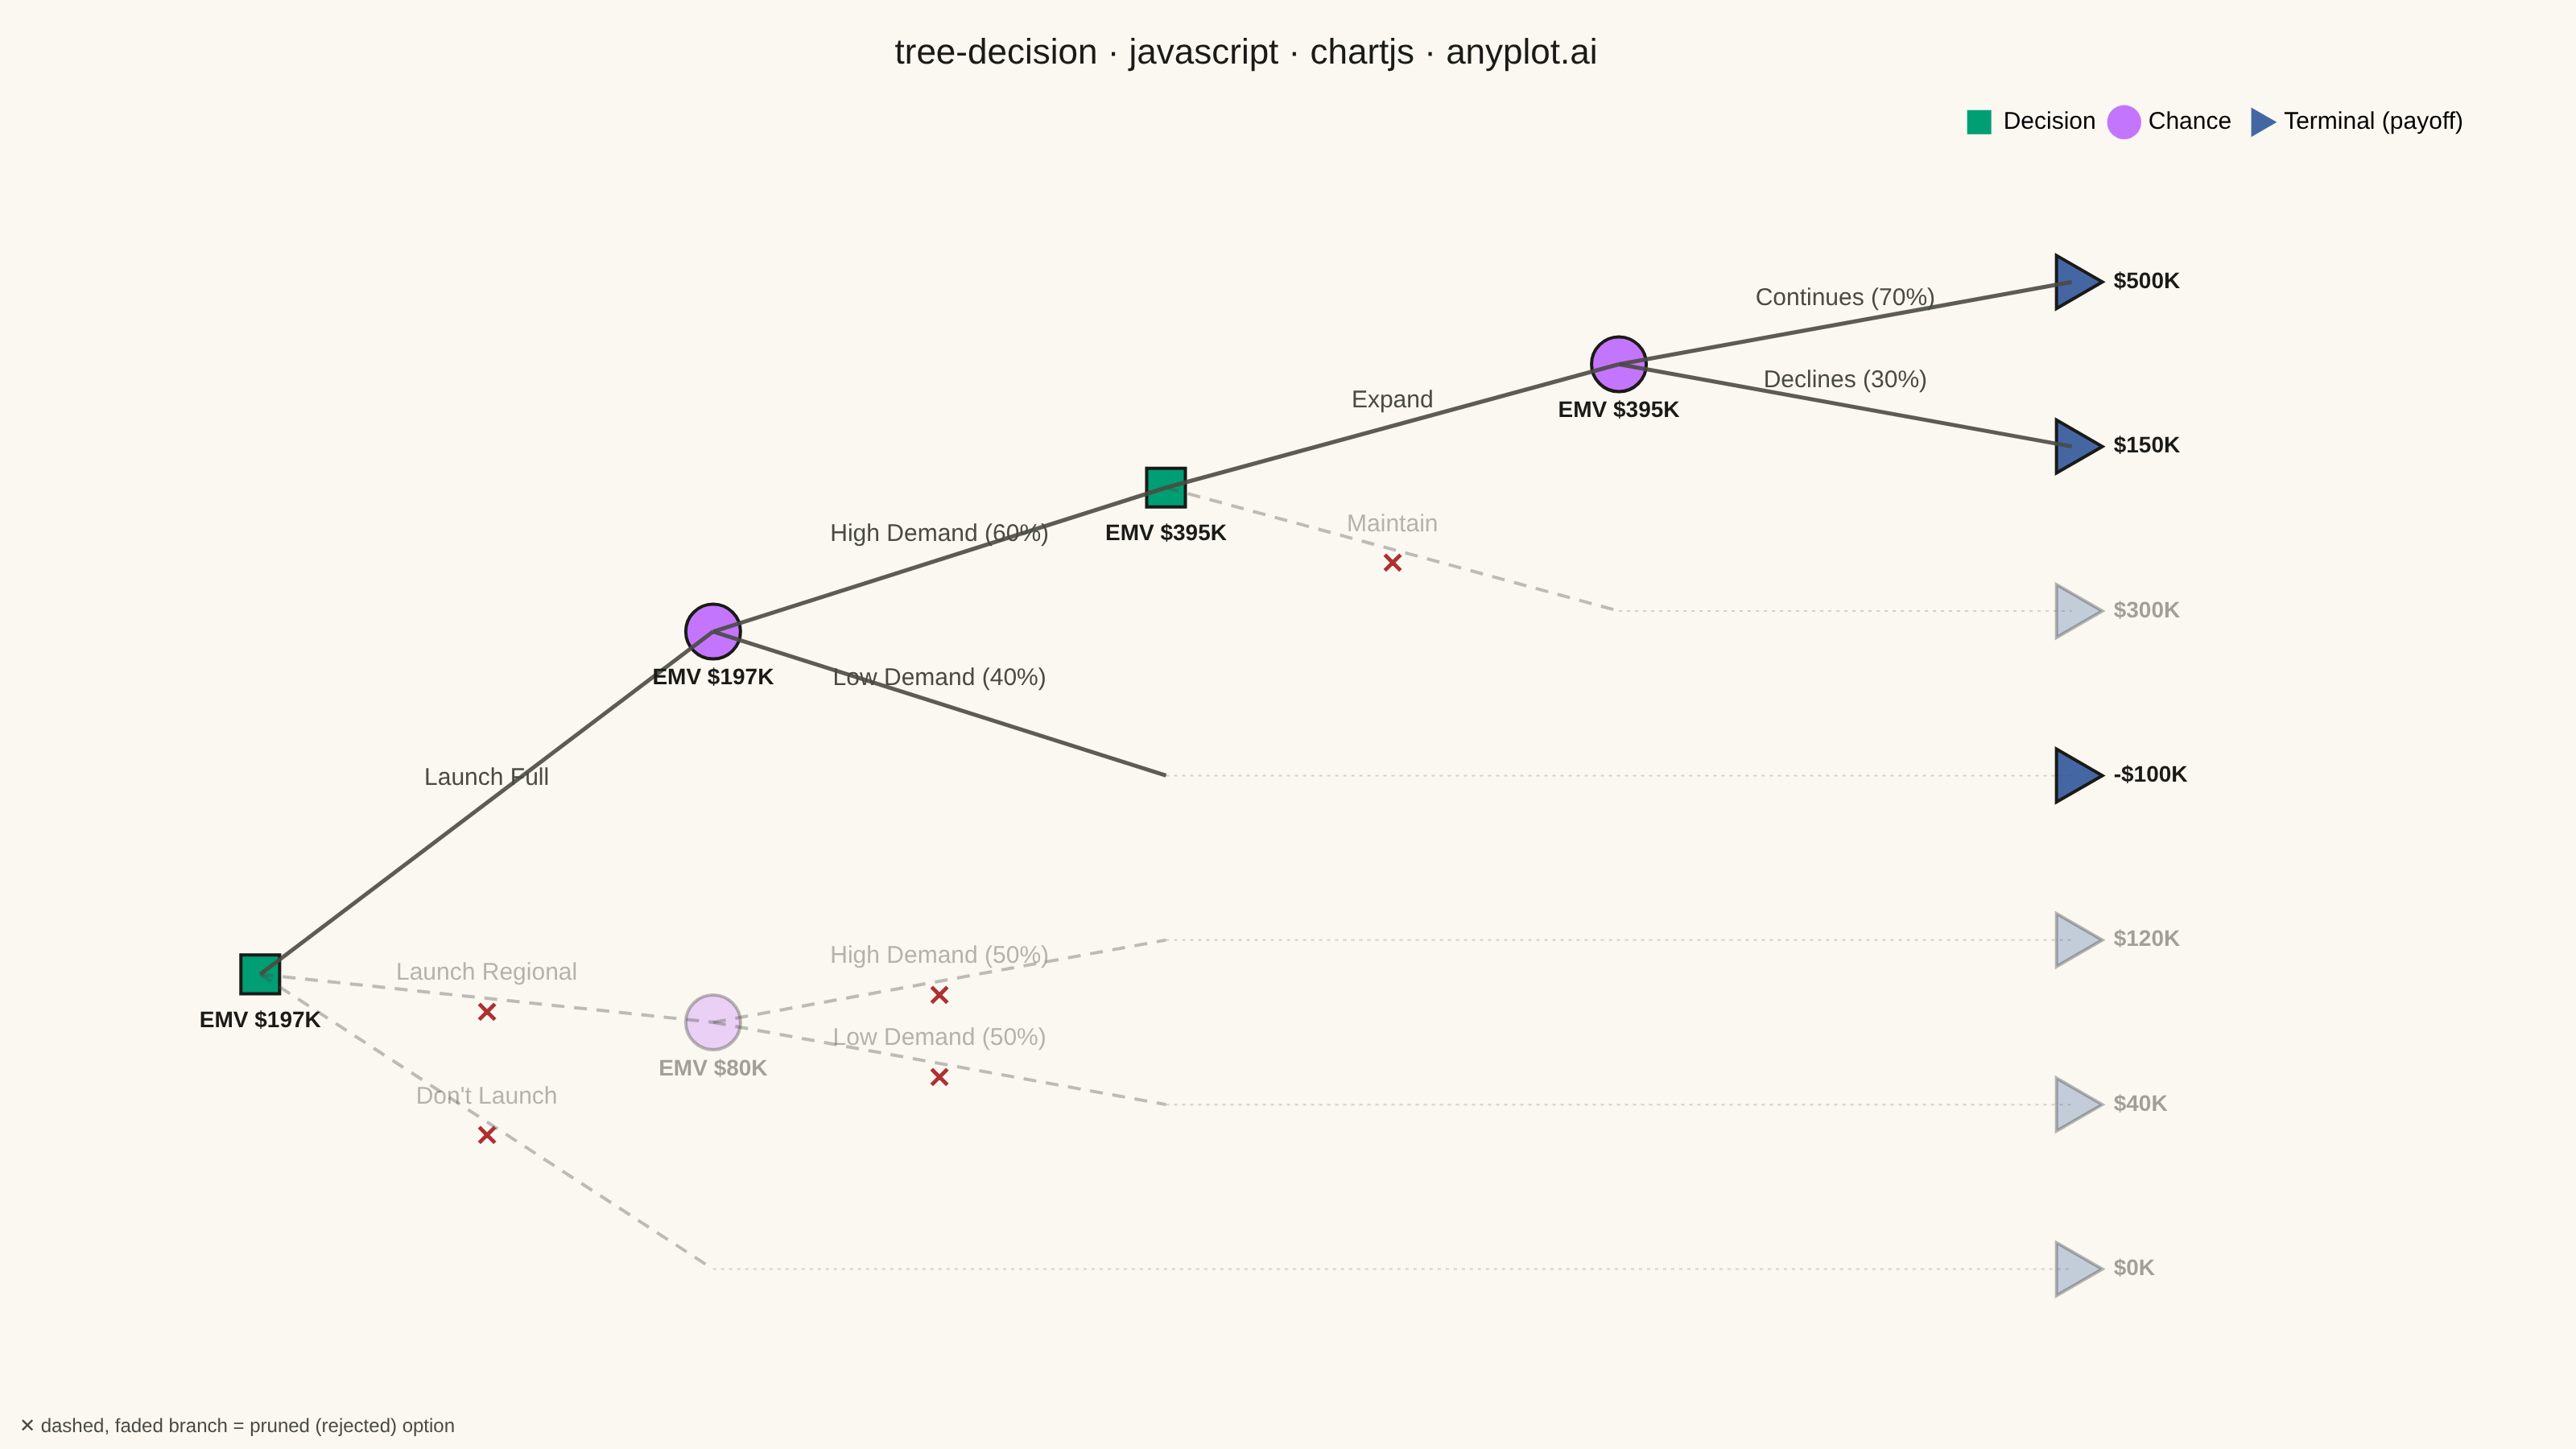
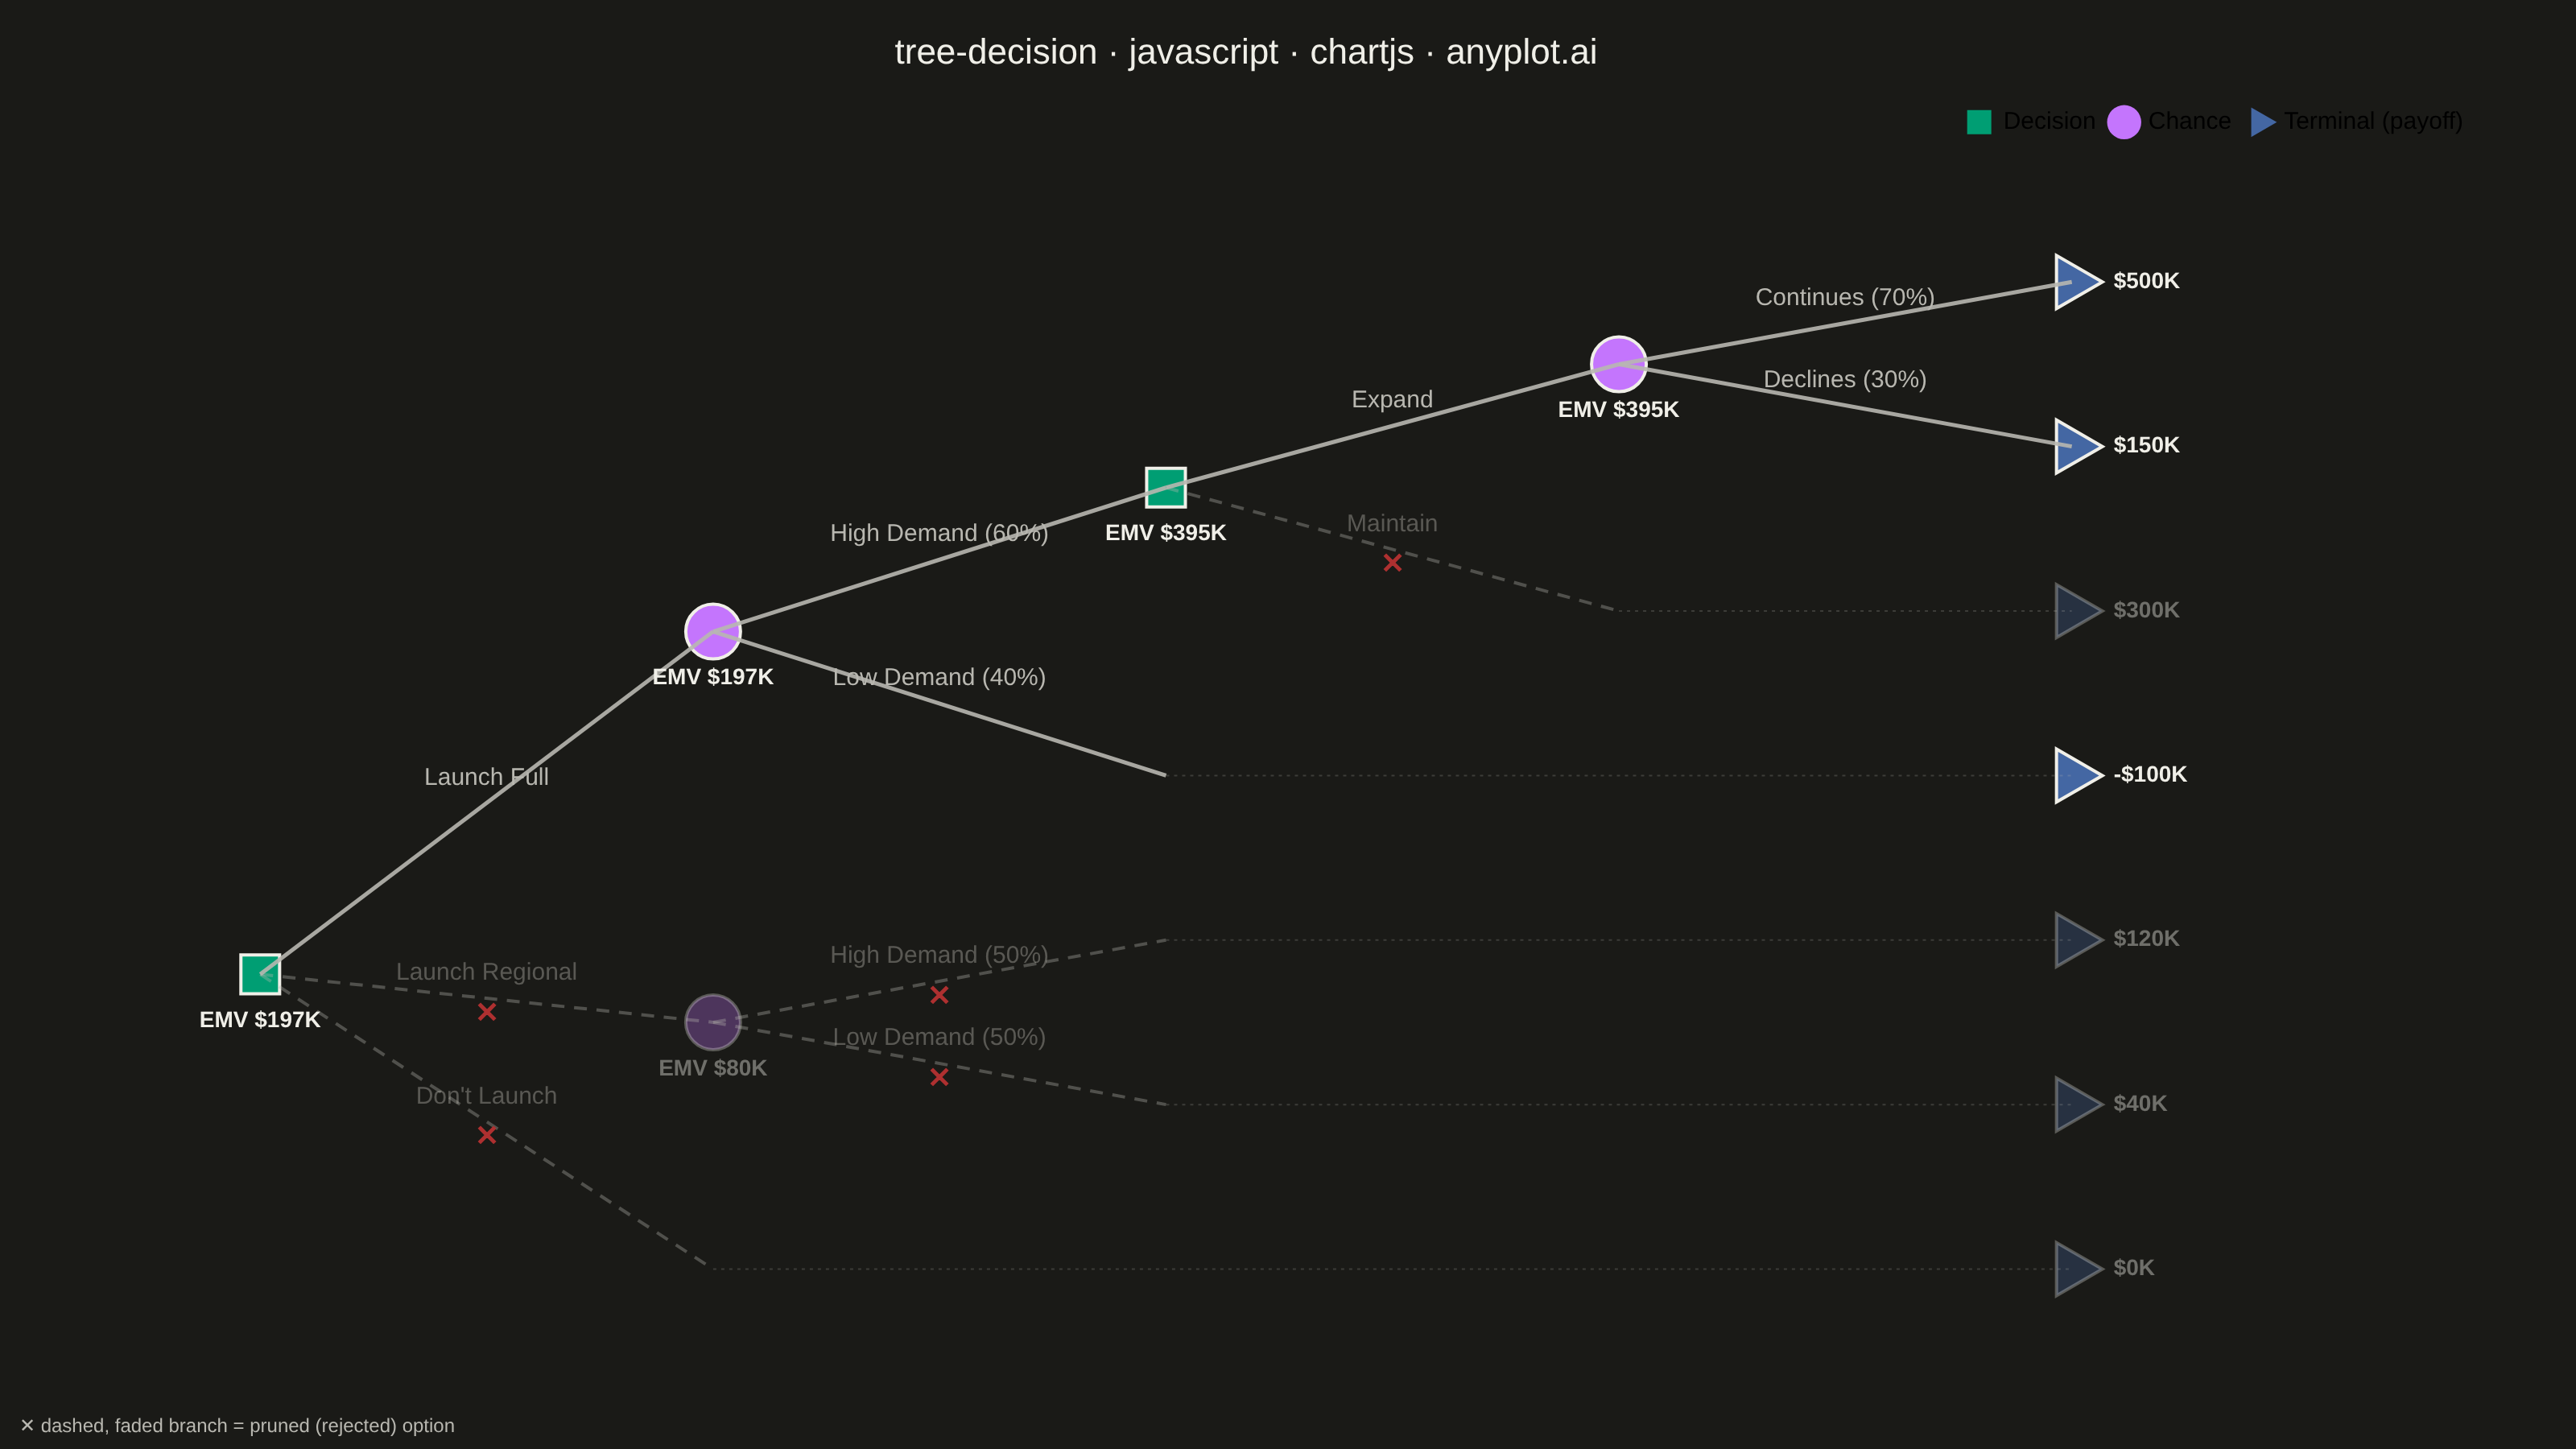
A tree-structured diagram for sequential decision analysis, displaying decision nodes (squares), chance nodes (circles), and terminal outcome nodes (triangles) connected by branching paths. Each chance branch is labeled with probabilities, terminal nodes show payoff values, and Expected Monetary Values (EMV) are calculated via rollback at each node. Rejected (pruned) branches are visually marked, making it easy to trace the optimal decision path through a multi-stage problem.
// anyplot.ai
// tree-decision: Decision Tree Visualization with Probabilities
// Library: chartjs 4.4.7 | JavaScript 22.23.2
// Quality: 94/100 | Created: 2026-08-26

//# anyplot-orientation: landscape

const t = window.ANYPLOT_TOKENS;

// --- Data: two-stage product-launch decision (values in $K) ----------------
// node_type: decision (square) | chance (circle) | terminal (triangle)
// pruned: true for branches rejected by EMV rollback at each decision node
const NODES = [
  { node_id: "d0", node_type: "decision", parent_id: null, branch_label: null, probability: null, payoff: null, emv: 197, pruned: false },
  { node_id: "c1", node_type: "chance", parent_id: "d0", branch_label: "Launch Full", probability: null, payoff: null, emv: 197, pruned: false },
  { node_id: "c3", node_type: "chance", parent_id: "d0", branch_label: "Launch Regional", probability: null, payoff: null, emv: 80, pruned: true },
  { node_id: "t7", node_type: "terminal", parent_id: "d0", branch_label: "Don't Launch", probability: null, payoff: 0, emv: null, pruned: true },
  { node_id: "d2", node_type: "decision", parent_id: "c1", branch_label: "High Demand", probability: 0.6, payoff: null, emv: 395, pruned: false },
  { node_id: "t4", node_type: "terminal", parent_id: "c1", branch_label: "Low Demand", probability: 0.4, payoff: -100, emv: null, pruned: false },
  { node_id: "c2", node_type: "chance", parent_id: "d2", branch_label: "Expand", probability: null, payoff: null, emv: 395, pruned: false },
  { node_id: "t3", node_type: "terminal", parent_id: "d2", branch_label: "Maintain", probability: null, payoff: 300, emv: null, pruned: true },
  { node_id: "t1", node_type: "terminal", parent_id: "c2", branch_label: "Continues", probability: 0.7, payoff: 500, emv: null, pruned: false },
  { node_id: "t2", node_type: "terminal", parent_id: "c2", branch_label: "Declines", probability: 0.3, payoff: 150, emv: null, pruned: false },
  { node_id: "t5", node_type: "terminal", parent_id: "c3", branch_label: "High Demand", probability: 0.5, payoff: 120, emv: null, pruned: true },
  { node_id: "t6", node_type: "terminal", parent_id: "c3", branch_label: "Low Demand", probability: 0.5, payoff: 40, emv: null, pruned: true },
];
const nodesById = new Map(NODES.map((n) => [n.node_id, n]));

// --- Left-to-right tree layout: x = depth, y = post-order leaf position ----
const childrenOf = new Map();
NODES.forEach((n) => {
  if (n.parent_id) {
    if (!childrenOf.has(n.parent_id)) childrenOf.set(n.parent_id, []);
    childrenOf.get(n.parent_id).push(n.node_id);
  }
});

const coords = {};
let leafCount = 0;
function layout(id, depth) {
  const kids = childrenOf.get(id) || [];
  if (kids.length === 0) {
    coords[id] = { x: depth, y: leafCount };
    leafCount += 1;
    return coords[id].y;
  }
  const y = kids.reduce((sum, k) => sum + layout(k, depth + 1), 0) / kids.length;
  coords[id] = { x: depth, y };
  return y;
}
layout("d0", 0);
const maxDepth = Math.max(...Object.values(coords).map((c) => c.x));

// Right-align terminal payoffs into one column (dashed leader line bridges
// each shallower terminal's structural depth to the aligned column) so the
// tree's outcomes fill the canvas evenly instead of leaving empty pockets
// wherever a branch resolves before reaching the deepest stage.
const displayCoords = {};
const leaders = [];
NODES.forEach((n) => {
  const c = coords[n.node_id];
  if (n.node_type === "terminal" && c.x < maxDepth) {
    displayCoords[n.node_id] = { x: maxDepth, y: c.y };
    leaders.push({ data: [c, displayCoords[n.node_id]] });
  } else {
    displayCoords[n.node_id] = c;
  }
});

// --- Helpers -----------------------------------------------------------
function withAlpha(hex, alpha) {
  const h = hex.replace("#", "");
  const r = parseInt(h.slice(0, 2), 16);
  const g = parseInt(h.slice(2, 4), 16);
  const b = parseInt(h.slice(4, 6), 16);
  return `rgba(${r}, ${g}, ${b}, ${alpha})`;
}
const fmtMoney = (v) => `${v < 0 ? "-$" : "$"}${Math.abs(v)}K`;
const edgeLabel = (child) =>
  child.probability != null
    ? `${child.branch_label} (${Math.round(child.probability * 100)}%)`
    : child.branch_label;

// --- Node styling by type (Imprint palette, canonical order) ---------------
const NODE_STYLE = {
  decision: { pointStyle: "rect", color: t.palette[0], radius: 17, rotation: 0, legend: "Decision" },
  chance: { pointStyle: "circle", color: t.palette[1], radius: 17, rotation: 0, legend: "Chance" },
  terminal: { pointStyle: "triangle", color: t.palette[2], radius: 19, rotation: 90, legend: "Terminal (payoff)" },
};

const nodesByType = { decision: [], chance: [], terminal: [] };
NODES.forEach((node) => nodesByType[node.node_type].push({ x: displayCoords[node.node_id].x, y: displayCoords[node.node_id].y, node }));

const nodeDatasets = Object.entries(nodesByType).map(([type, points]) => {
  const style = NODE_STYLE[type];
  return {
    data: points,
    showLine: false,
    pointStyle: style.pointStyle,
    pointRadius: style.radius,
    pointRotation: style.rotation,
    pointBackgroundColor: (ctx) => withAlpha(style.color, ctx.raw.node.pruned ? 0.3 : 1),
    pointBorderColor: (ctx) => withAlpha(t.ink, ctx.raw.node.pruned ? 0.3 : 1),
    pointBorderWidth: 2,
  };
});

// --- Branch (edge) datasets — drawn first so nodes sit on top --------------
const edgeDatasets = NODES.filter((n) => n.parent_id).map((child) => ({
  data: [coords[child.parent_id], coords[child.node_id]],
  showLine: true,
  borderColor: withAlpha(t.inkSoft, child.pruned ? 0.35 : 0.9),
  borderWidth: child.pruned ? 2 : 2.5,
  borderDash: child.pruned ? [8, 6] : [],
  pointRadius: 0,
  fill: false,
  tension: 0,
}));

// --- Leader lines: faint dotted guides from a terminal's true depth out to
// the aligned outcome column (purely a visual bridge, not a tree edge) -----
const leaderDatasets = leaders.map(({ data }) => ({
  data,
  showLine: true,
  borderColor: withAlpha(t.inkSoft, 0.22),
  borderWidth: 1,
  borderDash: [2, 3],
  pointRadius: 0,
  fill: false,
  tension: 0,
}));

// --- Custom draw: branch labels, pruned cross marks, EMV/payoff text -------
const annotationsPlugin = {
  id: "decisionTreeAnnotations",
  afterDatasetsDraw(chart) {
    const { ctx, scales } = chart;
    ctx.save();

    NODES.filter((n) => n.parent_id).forEach((child) => {
      const parent = coords[child.parent_id];
      const point = coords[child.node_id];
      const midX = scales.x.getPixelForValue((parent.x + point.x) / 2);
      const midY = scales.y.getPixelForValue((parent.y + point.y) / 2);
      const alpha = child.pruned ? 0.4 : 1;

      ctx.font = "15px sans-serif";
      ctx.fillStyle = withAlpha(t.inkSoft, alpha);
      ctx.textAlign = "center";
      ctx.textBaseline = "bottom";
      ctx.fillText(edgeLabel(child), midX, midY - 8);

      if (child.pruned) {
        ctx.font = "bold 18px sans-serif";
        ctx.fillStyle = "#AE3030";
        ctx.textBaseline = "middle";
        ctx.fillText("✕", midX, midY + 10);
      }
    });

    NODES.forEach((node) => {
      const p = displayCoords[node.node_id];
      const px = scales.x.getPixelForValue(p.x);
      const py = scales.y.getPixelForValue(p.y);
      const alpha = node.pruned ? 0.4 : 1;
      ctx.fillStyle = withAlpha(t.ink, alpha);
      ctx.font = "600 14px sans-serif";

      if (node.node_type === "terminal") {
        ctx.textAlign = "left";
        ctx.textBaseline = "middle";
        ctx.fillText(fmtMoney(node.payoff), px + 26, py);
      } else {
        ctx.textAlign = "center";
        ctx.textBaseline = "top";
        ctx.fillText(`EMV ${fmtMoney(node.emv)}`, px, py + 22);
      }
    });

    ctx.font = "12px sans-serif";
    ctx.fillStyle = t.inkSoft;
    ctx.textAlign = "left";
    ctx.textBaseline = "bottom";
    ctx.fillText("✕ dashed, faded branch = pruned (rejected) option", 12, chart.height - 8);

    ctx.restore();
  },
};

// --- Mount -----------------------------------------------------------------
const canvas = document.createElement("canvas");
document.getElementById("container").appendChild(canvas);

// --- Chart -------------------------------------------------------------
const TITLE = "tree-decision · javascript · chartjs · anyplot.ai";

new Chart(canvas, {
  type: "scatter",
  data: { datasets: [...edgeDatasets, ...leaderDatasets, ...nodeDatasets] },
  plugins: [annotationsPlugin],
  options: {
    responsive: true,
    maintainAspectRatio: false,
    animation: false,
    layout: { padding: { top: 8, right: 60, bottom: 30, left: 8 } },
    plugins: {
      title: {
        display: true,
        text: TITLE,
        color: t.ink,
        font: { size: 22, weight: "500" },
        padding: { top: 12, bottom: 12 },
      },
      legend: {
        position: "top",
        align: "end",
        labels: {
          color: t.ink,
          font: { size: 15 },
          usePointStyle: true,
          generateLabels: () =>
            Object.values(NODE_STYLE).map((style) => ({
              text: style.legend,
              fillStyle: style.color,
              strokeStyle: style.color,
              pointStyle: style.pointStyle,
              rotation: style.rotation,
              lineWidth: 0,
            })),
        },
      },
    },
    scales: {
      x: { type: "linear", min: -0.5, max: maxDepth + 0.9, display: false },
      y: { min: -0.8, max: leafCount - 1 + 0.8, reverse: true, display: false },
    },
  },
});
Runnable source as JSON, for any HTTP client: https://api.anyplot.ai/specs/tree-decision/chartjs/code. Any spec id and library id listed in llms-full.txt fit the same URL shape; every URL below is complete and callable.
{
  "spec_id": "tree-decision",
  "language": "javascript",
  "library": "chartjs",
  "page": "https://anyplot.ai/tree-decision/javascript/chartjs",
  "hub": "https://anyplot.ai/tree-decision",
  "code_json": "https://api.anyplot.ai/specs/tree-decision/chartjs/code",
  "spec_json": "https://api.anyplot.ai/specs/tree-decision",
  "render_light_png": "https://storage.googleapis.com/anyplot-images/plots/tree-decision/javascript/chartjs/plot-light.png",
  "render_dark_png": "https://storage.googleapis.com/anyplot-images/plots/tree-decision/javascript/chartjs/plot-dark.png",
  "interactive_light_html": "https://storage.googleapis.com/anyplot-images/plots/tree-decision/javascript/chartjs/plot-light.html",
  "interactive_dark_html": "https://storage.googleapis.com/anyplot-images/plots/tree-decision/javascript/chartjs/plot-dark.html",
  "quality_score": 94.0,
  "license": "MIT",
  "guide": "https://anyplot.ai/llms.txt"
}
Part of Decision Tree Visualization with Probabilities on anyplot.ai.