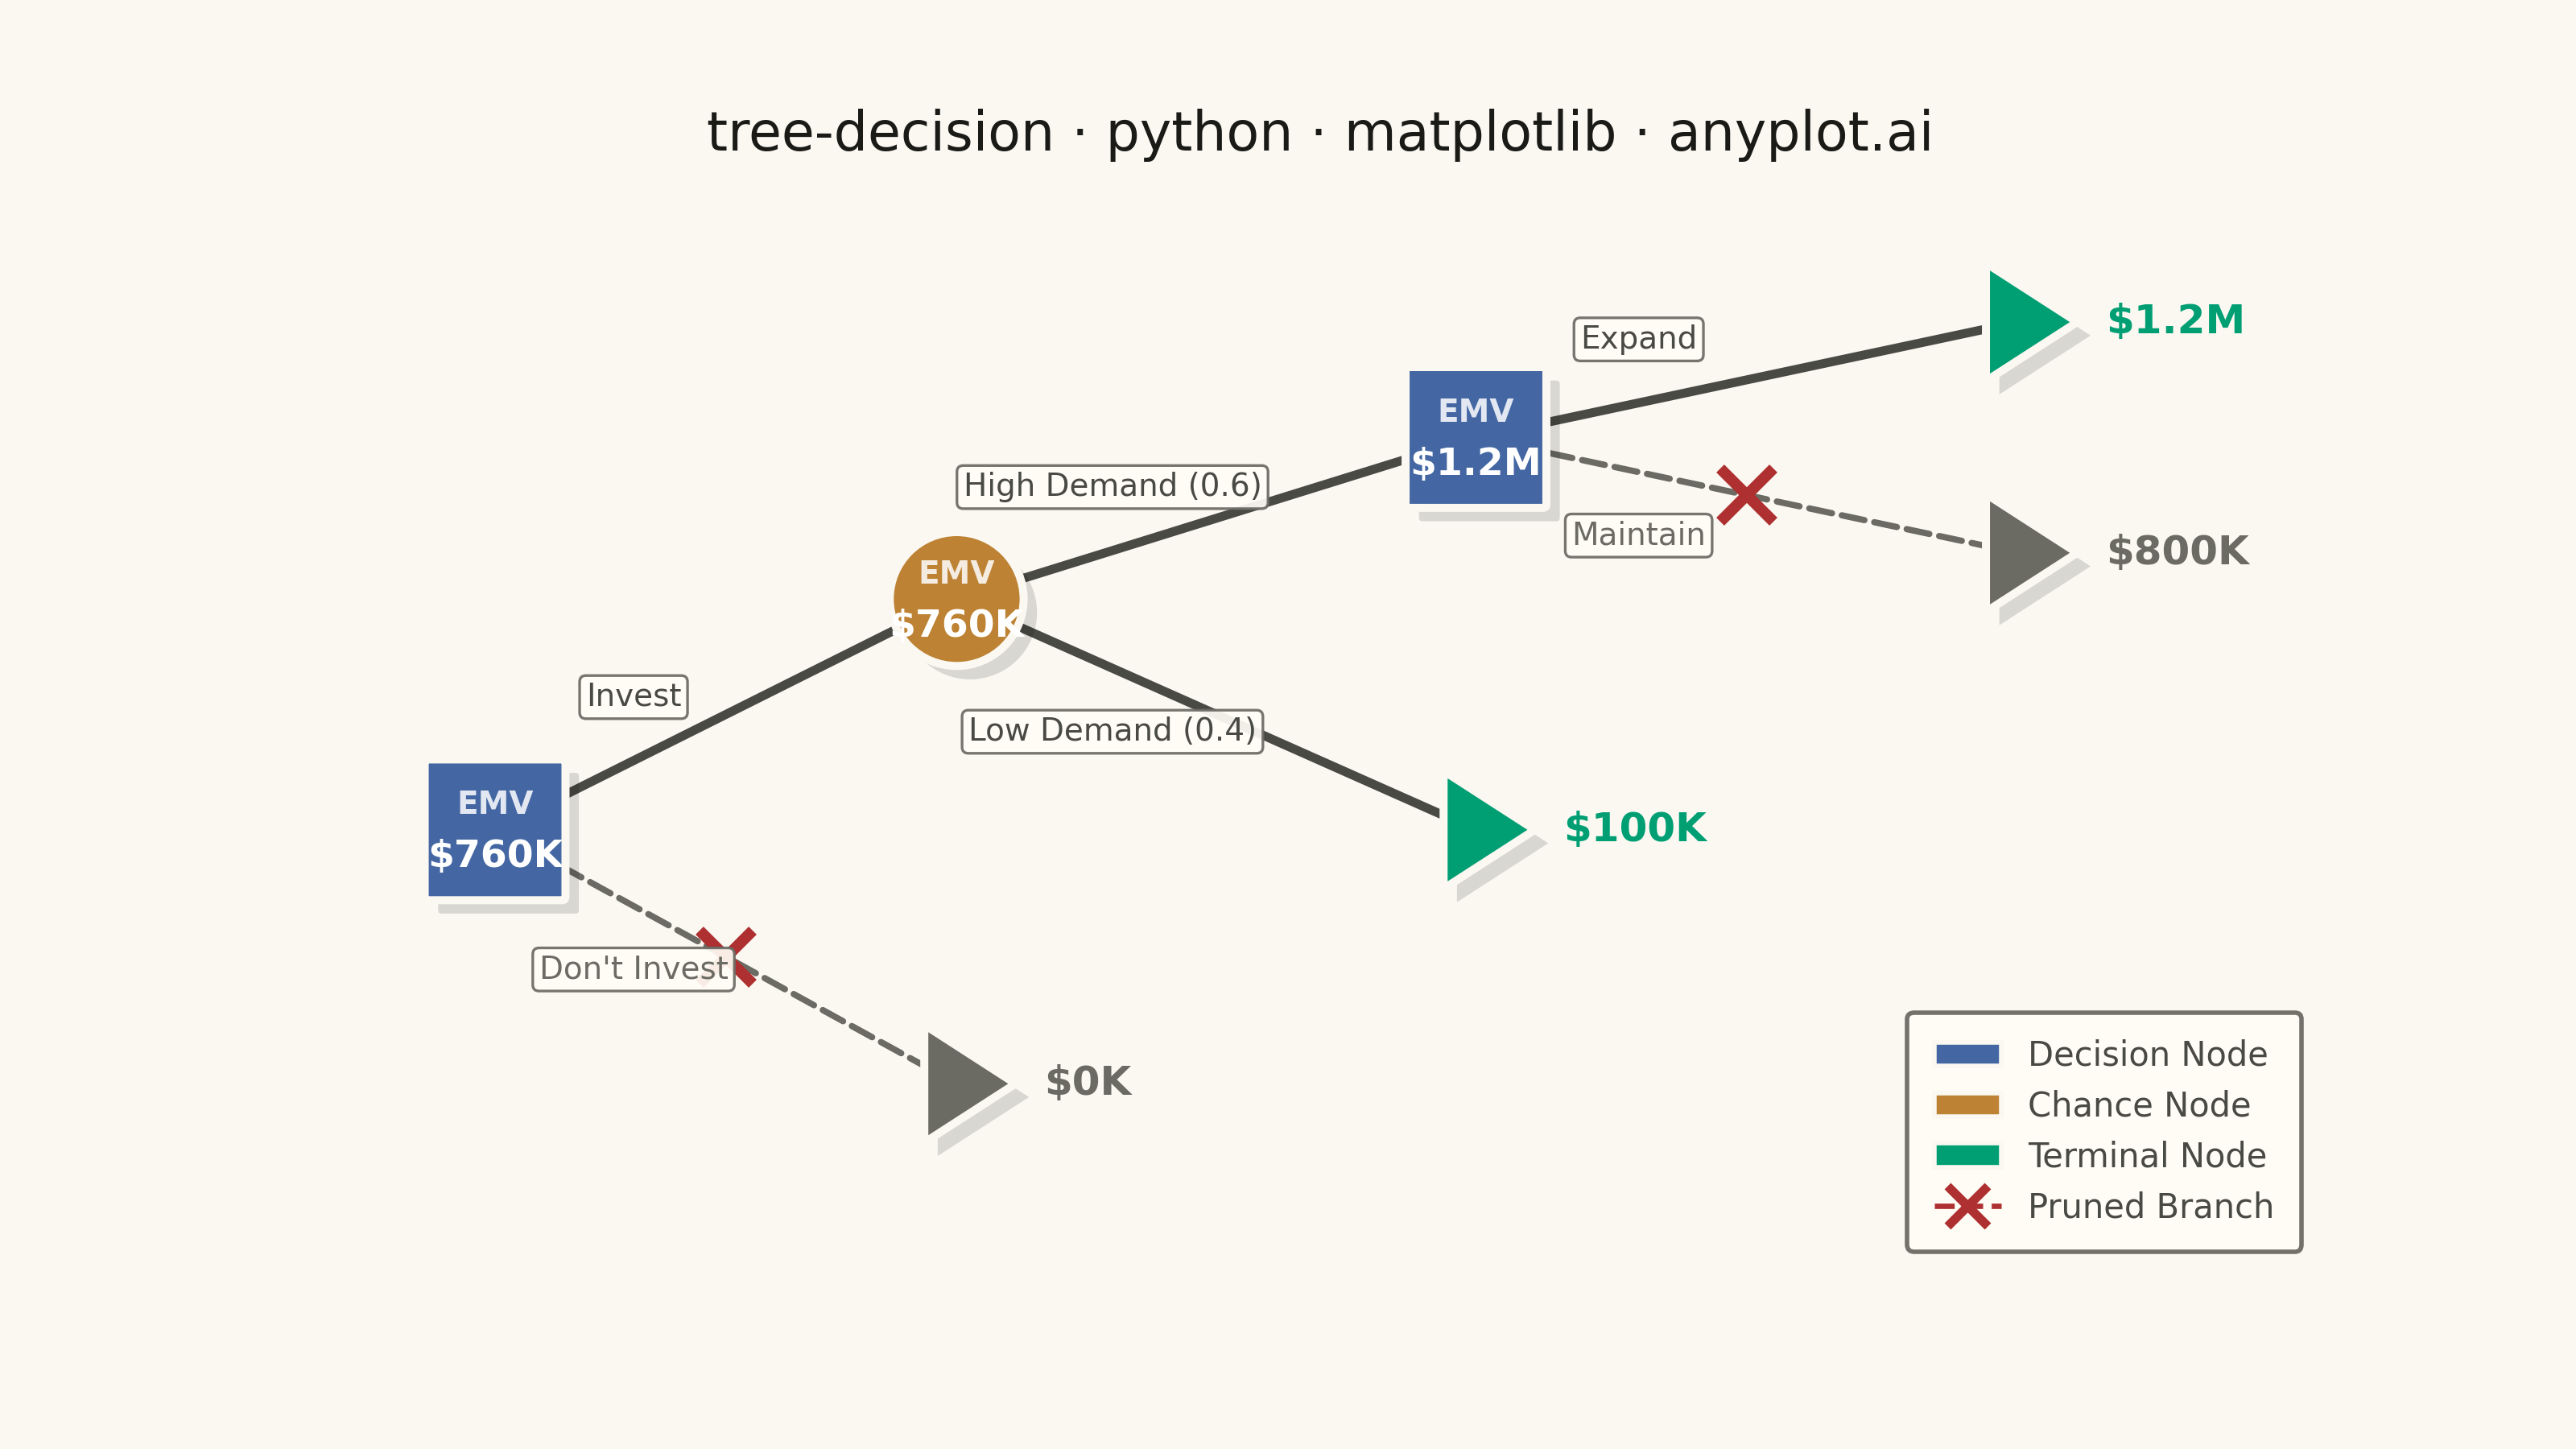
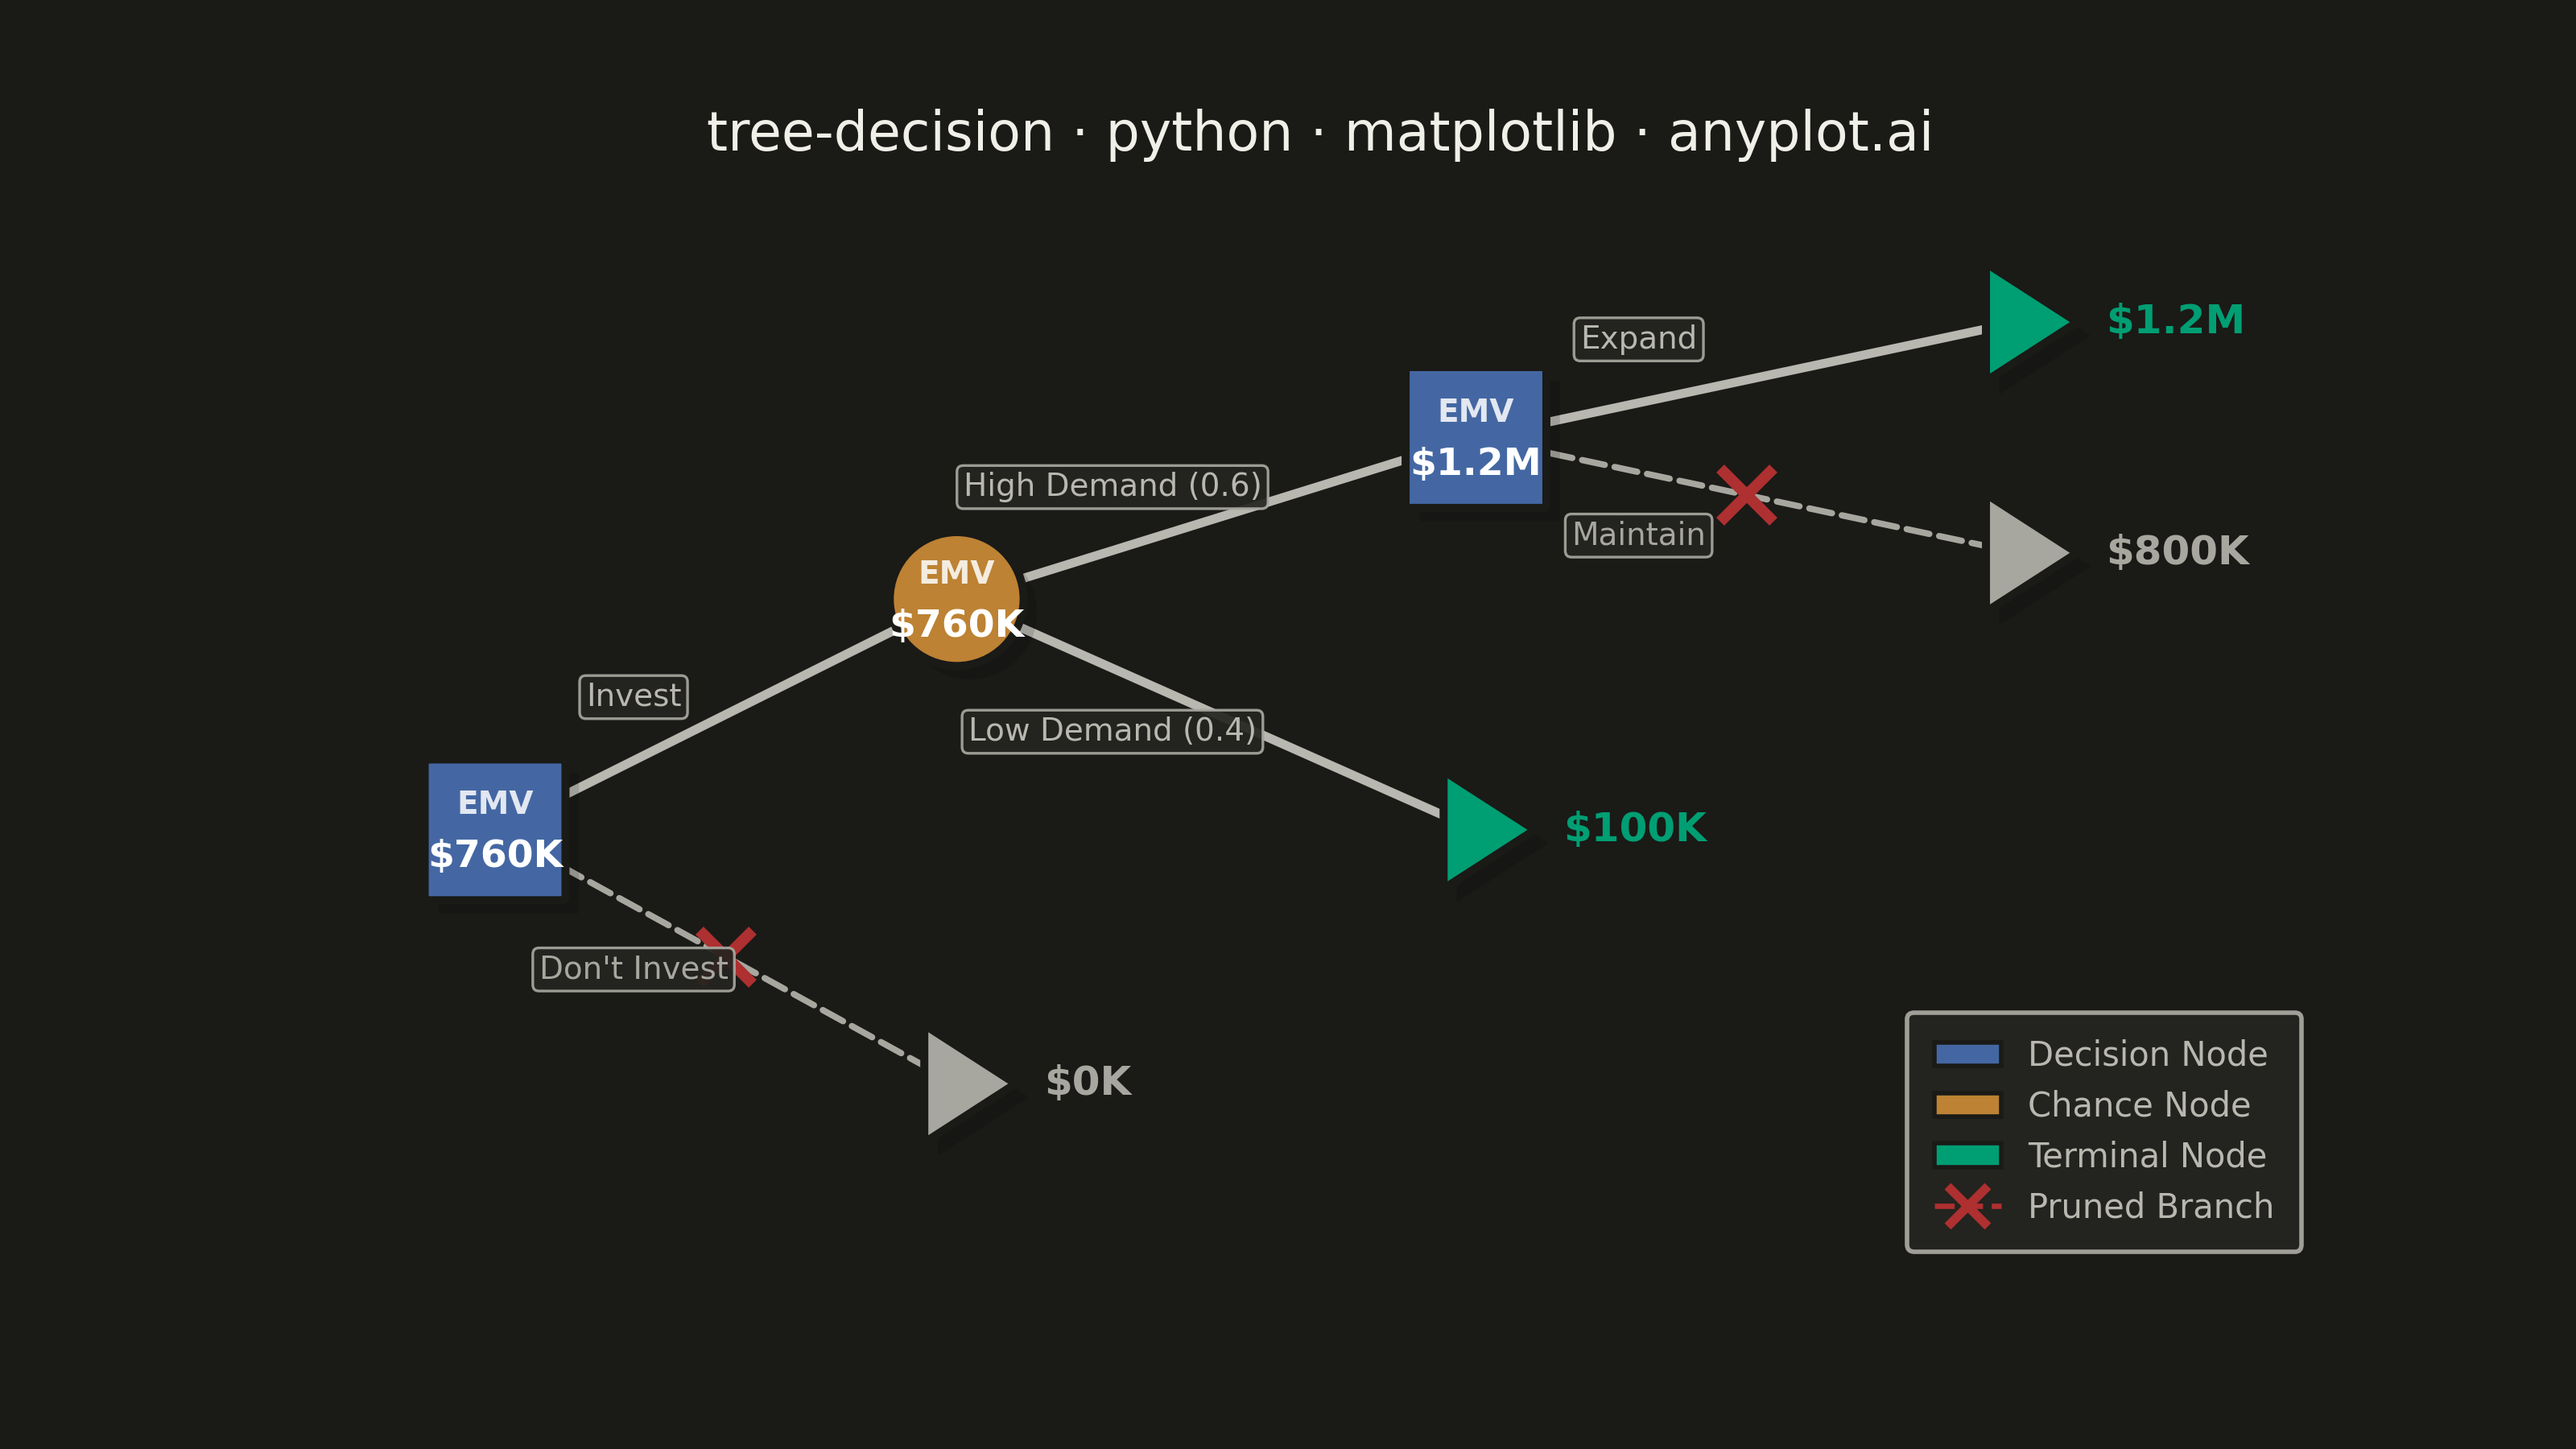
A tree-structured diagram for sequential decision analysis, displaying decision nodes (squares), chance nodes (circles), and terminal outcome nodes (triangles) connected by branching paths. Each chance branch is labeled with probabilities, terminal nodes show payoff values, and Expected Monetary Values (EMV) are calculated via rollback at each node. Rejected (pruned) branches are visually marked, making it easy to trace the optimal decision path through a multi-stage problem.
""" anyplot.ai
tree-decision: Decision Tree Visualization with Probabilities
Library: matplotlib 3.10.9 | Python 3.13.13
Quality: 90/100 | Updated: 2026-06-02
"""

import sys


# Prevent matplotlib.py from shadowing the matplotlib package on sys.path
sys.path = [p for p in sys.path if not p.endswith("/python")]

import os

import matplotlib.patches as mpatches
import matplotlib.patheffects as pe
import matplotlib.pyplot as plt
from matplotlib.patches import FancyArrowPatch, FancyBboxPatch


# Theme tokens
THEME = os.getenv("ANYPLOT_THEME", "light")
PAGE_BG = "#FAF8F1" if THEME == "light" else "#1A1A17"
ELEVATED_BG = "#FFFDF6" if THEME == "light" else "#242420"
INK = "#1A1A17" if THEME == "light" else "#F0EFE8"
INK_SOFT = "#4A4A44" if THEME == "light" else "#B8B7B0"
INK_MUTED = "#6B6A63" if THEME == "light" else "#A8A79F"

# Imprint palette — node type colors (semantic mapping)
DECISION_COLOR = "#4467A3"  # blue (position 3) — decision / control
CHANCE_COLOR = "#BD8233"  # ochre (position 4) — uncertainty / risk
TERMINAL_COLOR = "#009E73"  # brand green (position 1) — outcome / payoff
PRUNED_COLOR = INK_MUTED
PRUNED_MARK = "#AE3030"  # Imprint matte red — rejection / loss semantic

# Data — two-stage investment decision tree
# (node_id, node_type, parent_id, branch_label, probability, payoff, emv, pruned)
# EMV rollback: D2=max(1.2M,800K)=1.2M, C1=0.6×1.2M+0.4×100K=760K, D1=max(760K,0)=760K
nodes = [
    ("D1", "decision", None, None, None, None, 760000, False),
    ("C1", "chance", "D1", "Invest", None, None, 760000, False),
    ("T1", "terminal", "D1", "Don't Invest", None, 0, None, True),
    ("D2", "decision", "C1", "High Demand (0.6)", 0.6, None, 1200000, False),
    ("T2", "terminal", "C1", "Low Demand (0.4)", 0.4, 100000, None, False),
    ("T3", "terminal", "D2", "Expand", None, 1200000, None, False),
    ("T4", "terminal", "D2", "Maintain", None, 800000, None, True),
]

# Layout — coordinate space tuned to 18×10 ≈ 16:9, so content fills the canvas
# without needing set_aspect("equal"). Each axis unit ≈ equal physical inches.
positions = {
    "D1": (2.0, 5.0),
    "C1": (6.0, 7.0),
    "T1": (6.0, 2.8),
    "D2": (10.5, 8.4),
    "T2": (10.5, 5.0),
    "T3": (15.2, 9.4),
    "T4": (15.2, 7.4),
}

# Canvas — 3200×1800 px (landscape 16:9). No bbox_inches="tight".
fig, ax = plt.subplots(figsize=(8, 4.5), dpi=400, facecolor=PAGE_BG)
ax.set_facecolor(PAGE_BG)

# Draw branches first (under nodes)
for node in nodes:
    nid, ntype, parent_id, label, prob, payoff, emv, pruned = node
    if parent_id is None:
        continue
    px, py = positions[parent_id]
    cx, cy = positions[nid]

    line_color = PRUNED_COLOR if pruned else INK_SOFT
    lw = 1.4 if pruned else 2.0
    ls = "dashed" if pruned else "solid"

    arrow = FancyArrowPatch(
        (px, py),
        (cx, cy),
        arrowstyle="-",
        color=line_color,
        linestyle=ls,
        linewidth=lw,
        zorder=1,
        connectionstyle="arc3,rad=0.0",
    )
    ax.add_patch(arrow)

    # Pruned × marker at midpoint
    if pruned:
        mx, my = (px + cx) / 2, (py + cy) / 2
        ax.plot(mx, my, marker="x", markersize=12, color=PRUNED_MARK, markeredgewidth=2.5, zorder=5)

    # Branch label — 30% along the branch, offset toward open space
    if label:
        t = 0.30
        lx = px + (cx - px) * t
        ly = py + (cy - py) * t
        off = 0.55 if cy >= py else -0.55
        ax.text(
            lx,
            ly + off,
            label,
            fontsize=7,
            ha="center",
            va="center",
            color=PRUNED_COLOR if pruned else INK_SOFT,
            bbox={
                "boxstyle": "round,pad=0.2",
                "facecolor": ELEVATED_BG,
                "edgecolor": INK_MUTED,
                "alpha": 0.92,
                "linewidth": 0.6,
            },
            zorder=6,
        )

# Draw nodes
NODE_R = 0.58  # radius / half-size — large enough for two-line EMV text
SHADOW = [pe.SimplePatchShadow(offset=(3, -3), shadow_rgbFace="black", alpha=0.13), pe.Normal()]

for node in nodes:
    nid, ntype, parent_id, label, prob, payoff, emv, pruned = node
    x, y = positions[nid]

    if ntype == "decision":
        rect = FancyBboxPatch(
            (x - NODE_R, y - NODE_R),
            NODE_R * 2,
            NODE_R * 2,
            boxstyle="round,pad=0.03",
            facecolor=DECISION_COLOR,
            edgecolor=PAGE_BG,
            linewidth=1.8,
            zorder=3,
        )
        rect.set_path_effects(SHADOW)
        ax.add_patch(rect)
        if emv is not None:
            emv_str = f"${emv / 1e6:.1f}M" if emv >= 1e6 else f"${emv / 1e3:.0f}K"
            ax.text(
                x,
                y + 0.08,
                "EMV",
                fontsize=7,
                ha="center",
                va="bottom",
                color="white",
                fontweight="bold",
                zorder=4,
                alpha=0.85,
            )
            ax.text(
                x, y - 0.08, emv_str, fontsize=8.5, ha="center", va="top", color="white", fontweight="bold", zorder=4
            )

    elif ntype == "chance":
        circle = plt.Circle((x, y), NODE_R, facecolor=CHANCE_COLOR, edgecolor=PAGE_BG, linewidth=1.8, zorder=3)
        circle.set_path_effects(SHADOW)
        ax.add_patch(circle)
        if emv is not None:
            emv_str = f"${emv / 1e6:.1f}M" if emv >= 1e6 else f"${emv / 1e3:.0f}K"
            ax.text(
                x,
                y + 0.08,
                "EMV",
                fontsize=7,
                ha="center",
                va="bottom",
                color="white",
                fontweight="bold",
                zorder=4,
                alpha=0.85,
            )
            ax.text(
                x, y - 0.08, emv_str, fontsize=8.5, ha="center", va="top", color="white", fontweight="bold", zorder=4
            )

    elif ntype == "terminal":
        tri_color = TERMINAL_COLOR if not pruned else PRUNED_COLOR
        r = NODE_R * 0.88
        triangle = plt.Polygon(
            [(x - r * 0.55, y - r), (x - r * 0.55, y + r), (x + r, y)],
            facecolor=tri_color,
            edgecolor=PAGE_BG,
            linewidth=1.8,
            zorder=3,
        )
        triangle.set_path_effects(SHADOW)
        ax.add_patch(triangle)
        if payoff is not None:
            pay_str = f"${payoff / 1e6:.1f}M" if payoff >= 1e6 else f"${payoff / 1e3:.0f}K"
            ax.text(
                x + r + 0.25,
                y,
                pay_str,
                fontsize=9,
                ha="left",
                va="center",
                fontweight="bold",
                color=tri_color,
                zorder=4,
            )

# Legend
legend_handles = [
    mpatches.Patch(facecolor=DECISION_COLOR, edgecolor=PAGE_BG, label="Decision Node"),
    mpatches.Patch(facecolor=CHANCE_COLOR, edgecolor=PAGE_BG, label="Chance Node"),
    mpatches.Patch(facecolor=TERMINAL_COLOR, edgecolor=PAGE_BG, label="Terminal Node"),
    plt.Line2D(
        [0],
        [0],
        color=PRUNED_MARK,
        marker="x",
        linestyle="--",
        markeredgewidth=2.0,
        markersize=9,
        label="Pruned Branch",
        linewidth=1.2,
    ),
]
leg = ax.legend(
    handles=legend_handles,
    fontsize=7.5,
    loc="lower right",
    framealpha=0.95,
    edgecolor=INK_MUTED,
    fancybox=True,
    borderpad=0.8,
)
leg.get_frame().set_facecolor(ELEVATED_BG)
plt.setp(leg.get_texts(), color=INK_SOFT)

# Title — 48 chars; within 67-char baseline so default fontsize 12 is fine
title = "tree-decision · python · matplotlib · anyplot.ai"
ax.set_title(title, fontsize=12, fontweight="medium", pad=10, color=INK)

ax.set_xlim(0.5, 17.8)
ax.set_ylim(1.2, 10.5)
ax.set_aspect("equal")
ax.axis("off")

plt.savefig(f"plot-{THEME}.png", dpi=400, facecolor=PAGE_BG)
Runnable source as JSON, for any HTTP client: https://api.anyplot.ai/specs/tree-decision/matplotlib/code. Any spec id and library id listed in llms-full.txt fit the same URL shape; every URL below is complete and callable.
{
  "spec_id": "tree-decision",
  "language": "python",
  "library": "matplotlib",
  "page": "https://anyplot.ai/tree-decision/python/matplotlib",
  "hub": "https://anyplot.ai/tree-decision",
  "code_json": "https://api.anyplot.ai/specs/tree-decision/matplotlib/code",
  "spec_json": "https://api.anyplot.ai/specs/tree-decision",
  "render_light_png": "https://storage.googleapis.com/anyplot-images/plots/tree-decision/python/matplotlib/plot-light.png",
  "render_dark_png": "https://storage.googleapis.com/anyplot-images/plots/tree-decision/python/matplotlib/plot-dark.png",
  "quality_score": 90.0,
  "license": "MIT",
  "guide": "https://anyplot.ai/llms.txt"
}
Part of Decision Tree Visualization with Probabilities on anyplot.ai.