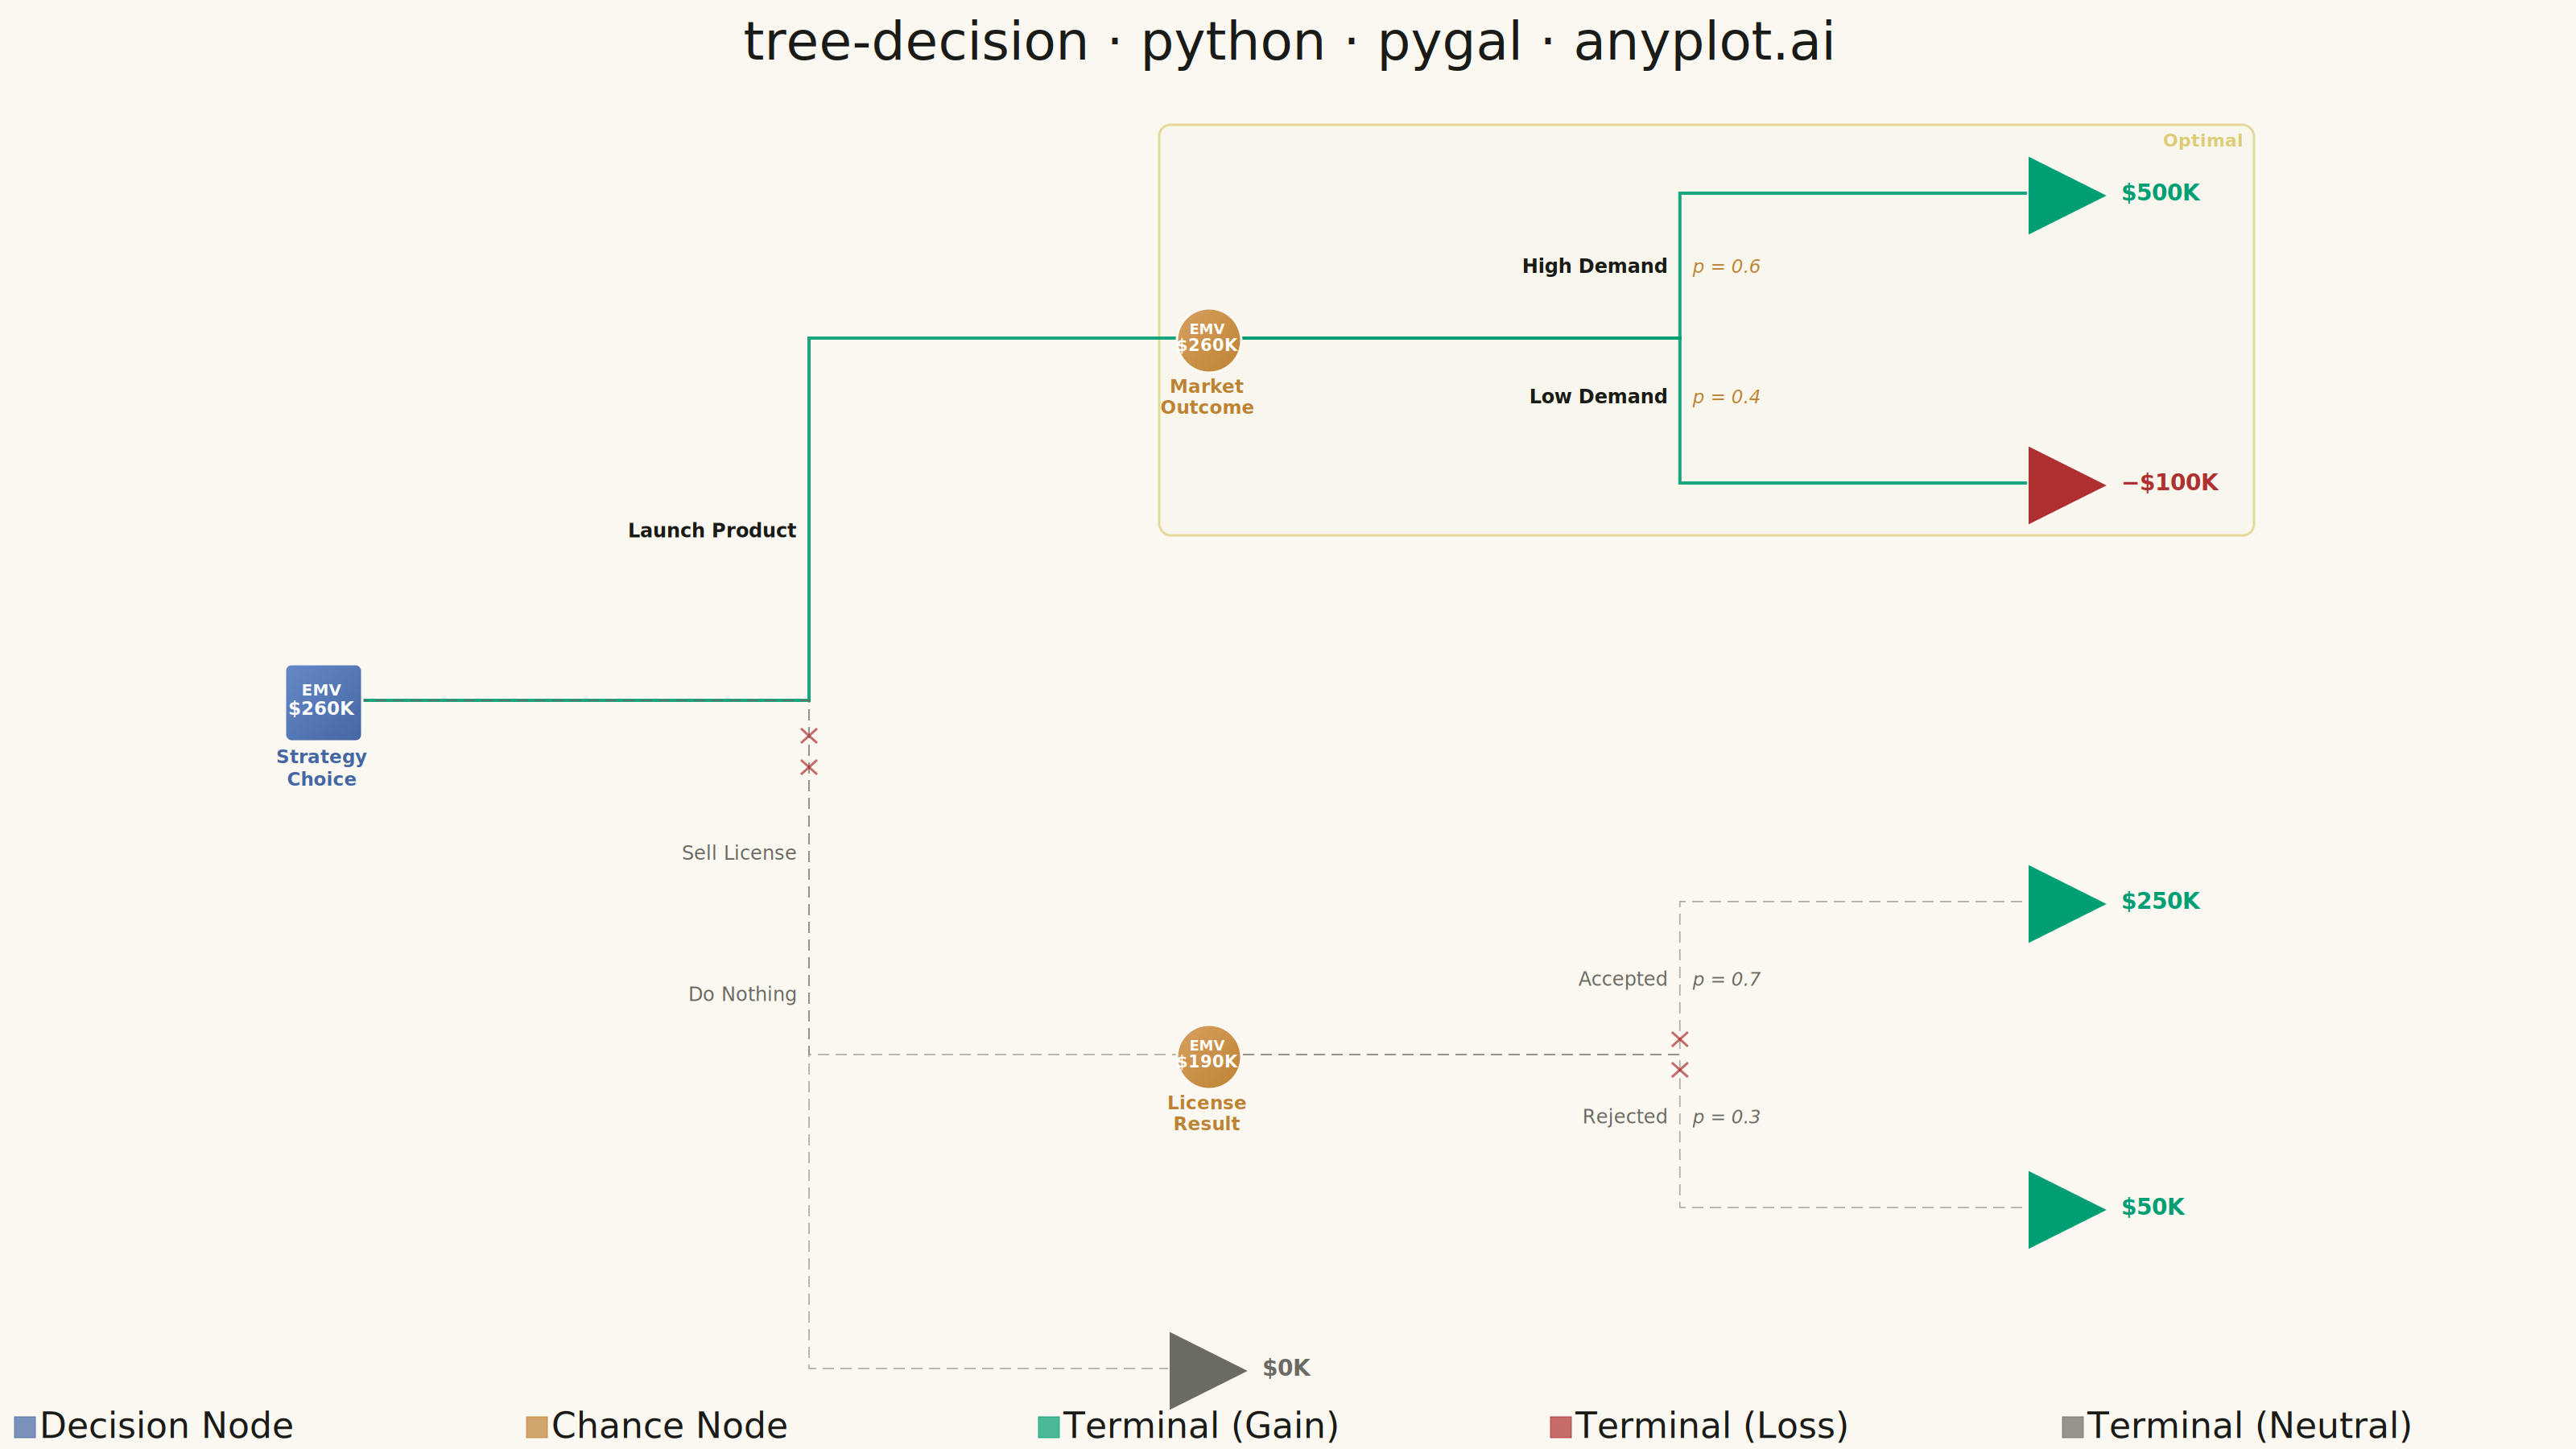
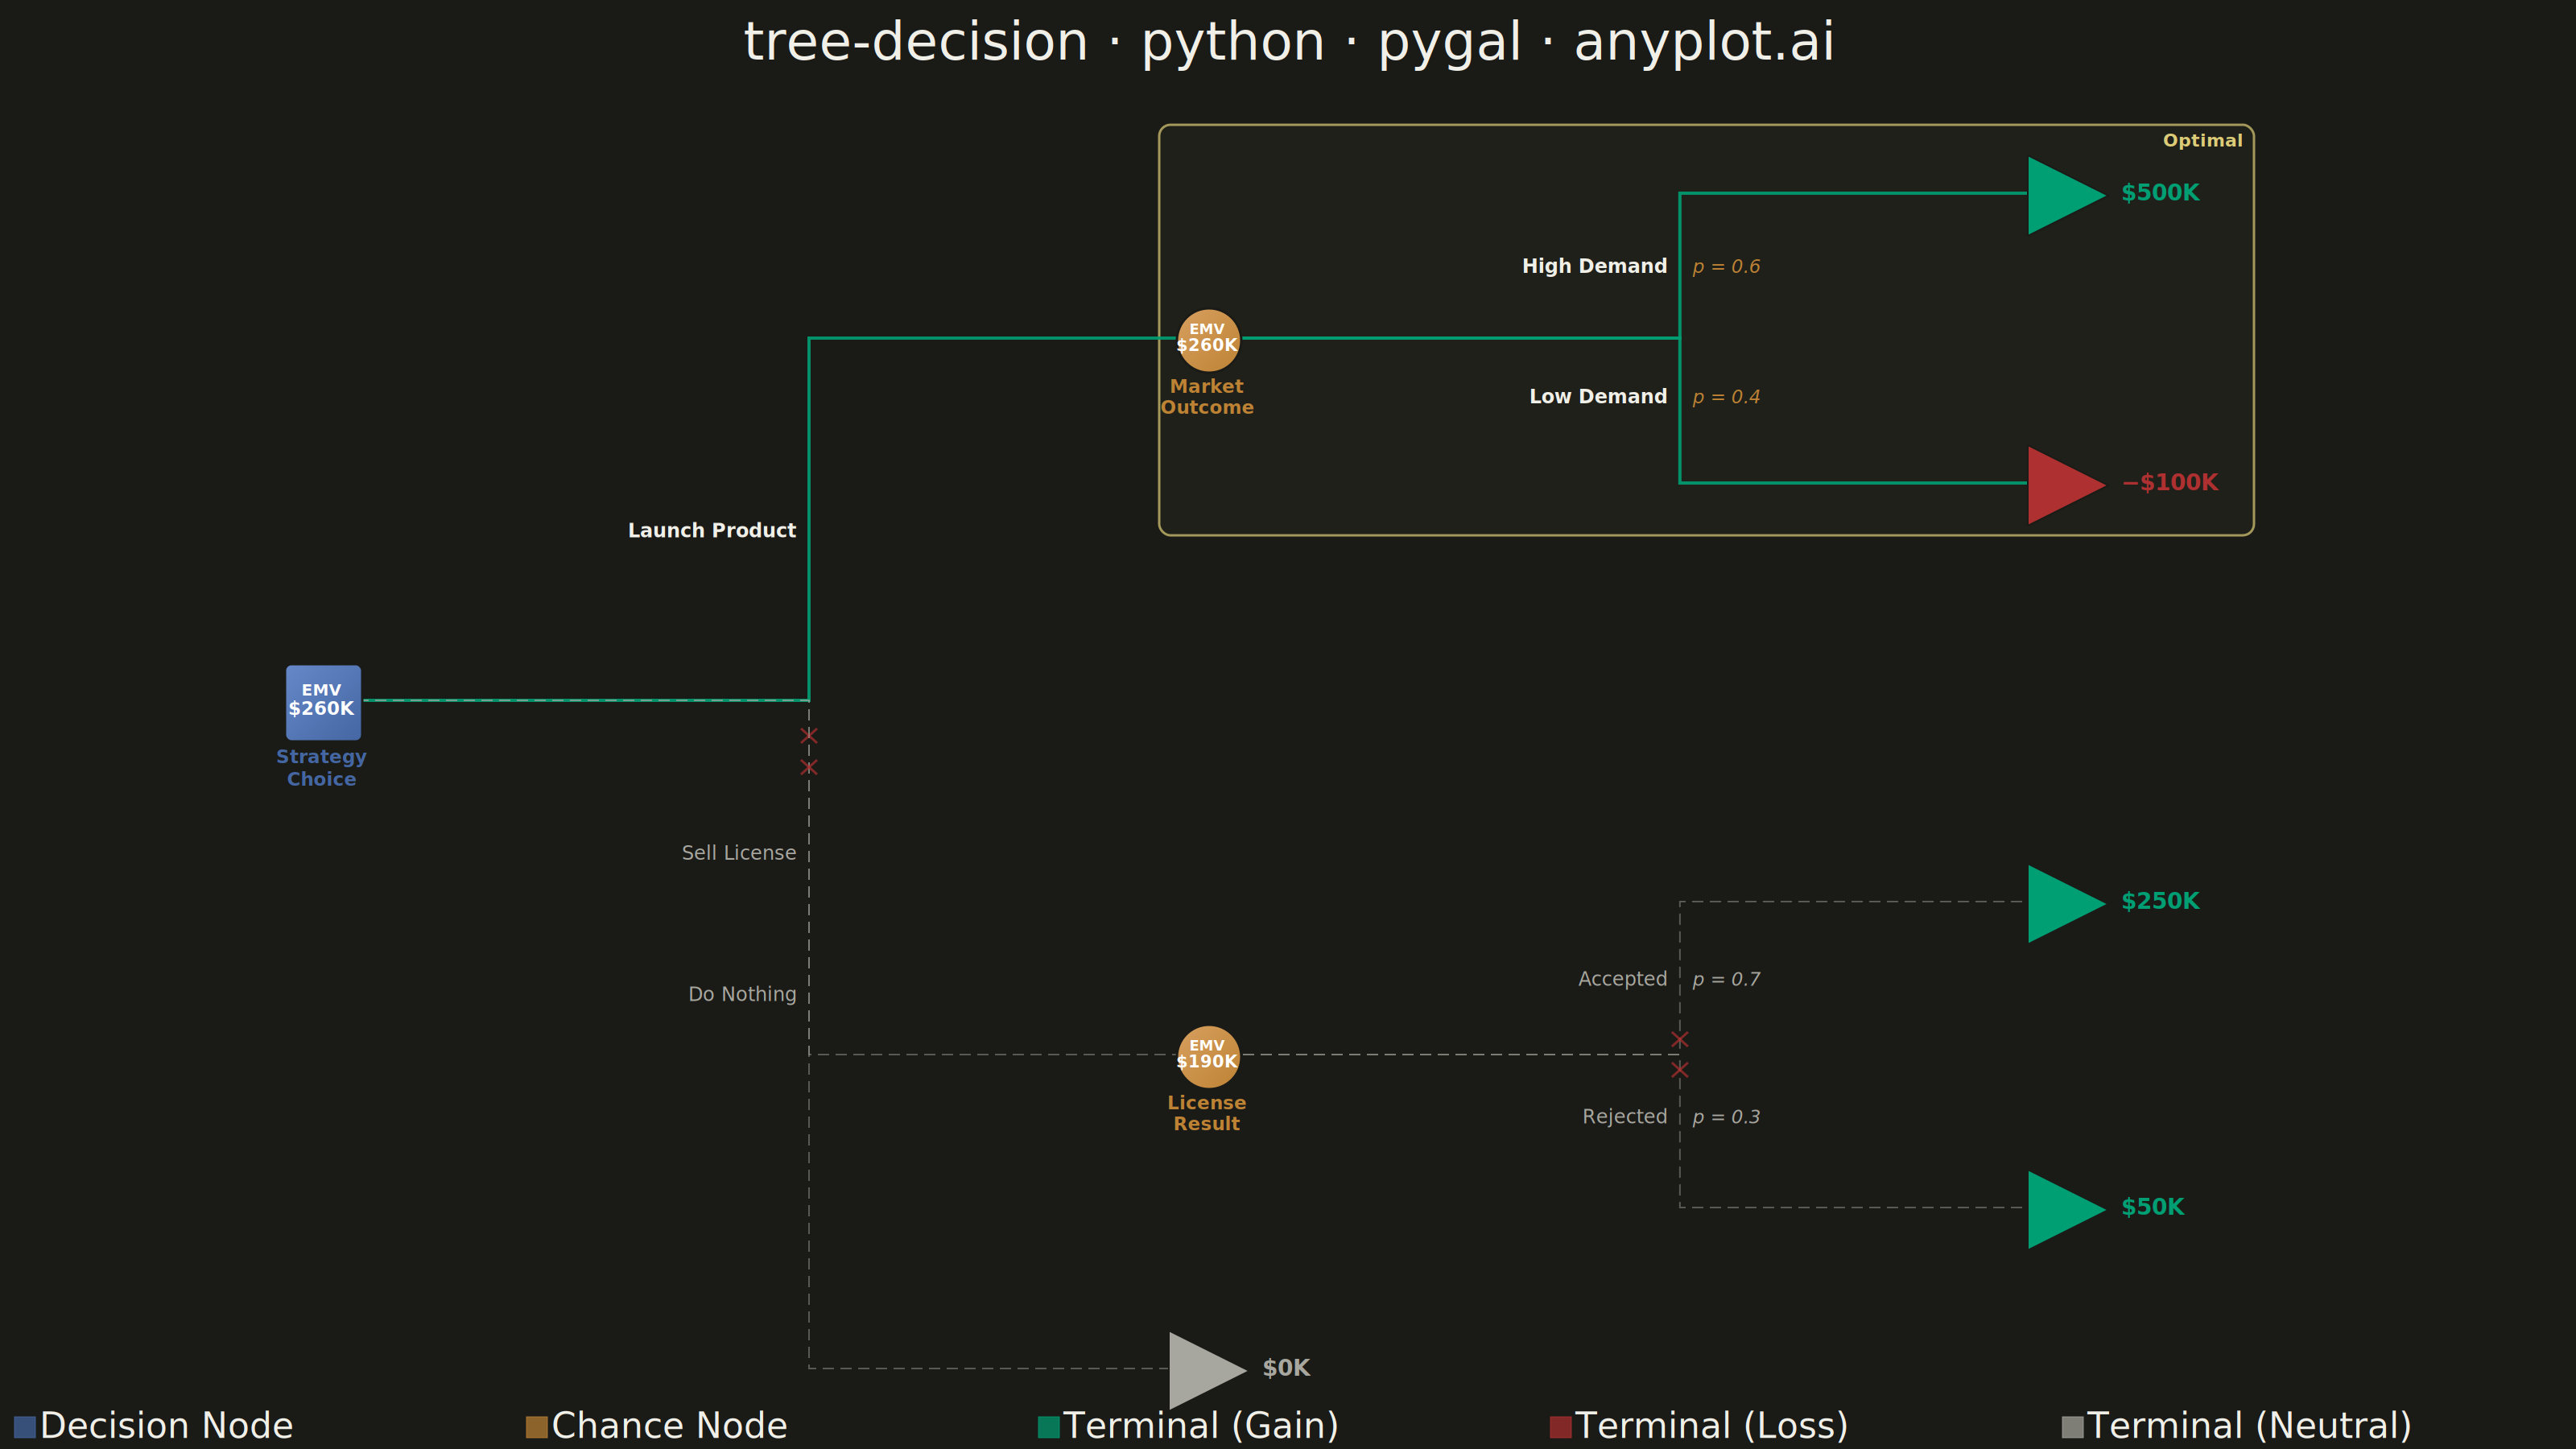
A tree-structured diagram for sequential decision analysis, displaying decision nodes (squares), chance nodes (circles), and terminal outcome nodes (triangles) connected by branching paths. Each chance branch is labeled with probabilities, terminal nodes show payoff values, and Expected Monetary Values (EMV) are calculated via rollback at each node. Rejected (pruned) branches are visually marked, making it easy to trace the optimal decision path through a multi-stage problem.
""" anyplot.ai
tree-decision: Decision Tree Visualization with Probabilities
Library: pygal 3.1.0 | Python 3.13.13
Quality: 87/100 | Updated: 2026-06-02
"""
import os
import sys as _sys
# Prevent this file (pygal.py) from shadowing the installed pygal package
_sys.path = [p for p in _sys.path if p not in ("", os.path.dirname(os.path.abspath(__file__)))]
del _sys
import cairosvg
import pygal
from pygal.style import Style
THEME = os.getenv("ANYPLOT_THEME", "light")
# Theme-adaptive chrome tokens (Imprint palette)
PAGE_BG = "#FAF8F1" if THEME == "light" else "#1A1A17"
INK = "#1A1A17" if THEME == "light" else "#F0EFE8"
INK_MUTED = "#6B6A63" if THEME == "light" else "#A8A79F"
# Imprint palette — semantic assignments for decision tree node roles
DECISION_CLR = "#4467A3" # blue (Imprint #3)
CHANCE_CLR = "#BD8233" # ochre (Imprint #4)
GAIN_CLR = "#009E73" # brand green (Imprint #1, semantic: gain/profit)
LOSS_CLR = "#AE3030" # matte red (Imprint #5, semantic: loss)
AMBER = "#DDCC77" # amber anchor — golden border for optimal outcome region
FONT = "DejaVu Sans, sans-serif"
W, H = 3200, 1800 # canvas: landscape 16:9, canonical Imprint size
# Node shape sizes for 3200×1800 canvas
DEC_HALF = 48 # decision square half-side
CHC_R = 40 # chance circle radius
TRI = 50 # terminal triangle half-side (larger for clear visibility)
# SVG overlay font sizes at native 3200×1800 pixels
FS = {"branch": 24, "prob": 23, "payoff": 28, "emv_hdr": 20, "emv_val": 23, "caption": 23}
# Decision tree — New Product Launch
# EMV rollback: C1: 0.6×500 + 0.4×(-100) = 260K [OPTIMAL]
# C2: 0.7×250 + 0.3×50 = 190K [PRUNED]
# D1: max(260, 190, 0) = 260K
nodes = {
"D1": {"type": "decision", "x": 400, "y": 870, "emv": 260, "label": "Strategy\nChoice"},
"C1": {"type": "chance", "x": 1500, "y": 420, "emv": 260, "label": "Market\nOutcome"},
"C2": {"type": "chance", "x": 1500, "y": 1310, "emv": 190, "label": "License\nResult"},
"T1": {"type": "terminal", "x": 2567, "y": 240, "payoff": 500},
"T2": {"type": "terminal", "x": 2567, "y": 600, "payoff": -100},
"T3": {"type": "terminal", "x": 2567, "y": 1120, "payoff": 250},
"T4": {"type": "terminal", "x": 2567, "y": 1500, "payoff": 50},
"T5": {"type": "terminal", "x": 1500, "y": 1700, "payoff": 0},
}
branches = [
("D1", "C1", "Launch Product", None, False),
("D1", "C2", "Sell License", None, True),
("D1", "T5", "Do Nothing", None, True),
("C1", "T1", "High Demand", 0.6, False),
("C1", "T2", "Low Demand", 0.4, False),
("C2", "T3", "Accepted", 0.7, True),
("C2", "T4", "Rejected", 0.3, True),
]
# Imprint palette passed to pygal Style (first series = brand green)
IMPRINT_PALETTE = ("#009E73", "#C475FD", "#4467A3", "#BD8233", "#AE3030", "#2ABCCD", "#954477", "#99B314")
style = Style(
background=PAGE_BG,
plot_background=PAGE_BG,
foreground=INK,
foreground_strong=INK,
foreground_subtle=INK_MUTED,
colors=(DECISION_CLR, CHANCE_CLR, GAIN_CLR, LOSS_CLR, INK_MUTED),
title_font_size=66,
legend_font_size=44,
label_font_size=56,
major_label_font_size=44,
value_font_size=36,
font_family=FONT,
)
def fmt_k(v):
return f"${v:,.0f}K" if v >= 0 else f"−${abs(v):,.0f}K"
def elbow(x1, y1, x2, y2, ratio=0.55):
mx = x1 + (x2 - x1) * ratio
return f"M {x1},{y1} L {mx},{y1} L {mx},{y2} L {x2},{y2}", mx
def tx(x, y, s, size, fill=None, weight="normal", anchor="middle", italic=False):
fill = fill or INK
fs = ' font-style="italic"' if italic else ""
return (
f'<text x="{x}" y="{y}" text-anchor="{anchor}" font-size="{size}" '
f'fill="{fill}" font-weight="{weight}" font-family="{FONT}"{fs}>{s}</text>'
)
# Build pygal XY chart — provides native legend, tooltips, and themed background
chart = pygal.XY(
width=W,
height=H,
style=style,
title="tree-decision · python · pygal · anyplot.ai",
show_legend=True,
legend_at_bottom=True,
legend_at_bottom_columns=5,
legend_box_size=26,
show_x_guides=False,
show_y_guides=False,
show_x_labels=False,
show_y_labels=False,
dots_size=0,
stroke=False,
range=(0, H),
xrange=(0, W),
margin=10,
margin_bottom=5,
spacing=8,
tooltip_border_radius=8,
tooltip_fancy_mode=True,
value_formatter=fmt_k,
)
chart.add(
"Decision Node",
[
{
"value": (n["x"], n["y"]),
"label": n["label"].replace("\n", " "),
"xlink": {"title": f"EMV: ${n['emv']}K | Optimal: Launch Product"},
}
for n in nodes.values()
if n["type"] == "decision"
],
)
chart.add(
"Chance Node",
[
{"value": (n["x"], n["y"]), "label": n["label"].replace("\n", " "), "xlink": {"title": f"EMV: ${n['emv']}K"}}
for n in nodes.values()
if n["type"] == "chance"
],
)
chart.add(
"Terminal (Gain)",
[
{"value": (n["x"], n["y"]), "label": fmt_k(n["payoff"])}
for n in nodes.values()
if n["type"] == "terminal" and n["payoff"] > 0
],
)
chart.add(
"Terminal (Loss)",
[
{"value": (n["x"], n["y"]), "label": fmt_k(n["payoff"])}
for n in nodes.values()
if n["type"] == "terminal" and n["payoff"] < 0
],
)
chart.add(
"Terminal (Neutral)",
[
{"value": (n["x"], n["y"]), "label": fmt_k(n["payoff"])}
for n in nodes.values()
if n["type"] == "terminal" and n["payoff"] == 0
],
)
base_svg = chart.render().decode("utf-8")
# SVG defs: node gradients + drop-shadow filter
defs = (
"<defs>"
'<filter id="sh" x="-20%" y="-20%" width="150%" height="150%">'
'<feGaussianBlur in="SourceAlpha" stdDeviation="4" result="b"/>'
'<feOffset dx="2" dy="3" result="s"/>'
'<feFlood flood-color="#000" flood-opacity="0.18" result="c"/>'
'<feComposite in="c" in2="s" operator="in" result="shadow"/>'
'<feMerge><feMergeNode in="shadow"/><feMergeNode in="SourceGraphic"/></feMerge>'
"</filter>"
f'<linearGradient id="g_d" x1="0%" y1="0%" x2="100%" y2="100%">'
f'<stop offset="0%" stop-color="#6688C8"/><stop offset="100%" stop-color="{DECISION_CLR}"/>'
"</linearGradient>"
f'<linearGradient id="g_c" x1="0%" y1="0%" x2="100%" y2="100%">'
f'<stop offset="0%" stop-color="#D8A060"/><stop offset="100%" stop-color="{CHANCE_CLR}"/>'
"</linearGradient>"
"</defs>"
)
# Amber golden border highlights the optimal outcome region (C1 subtree: T1 + T2).
# Previous version used a light-blue fill matching altair — change request: golden accent instead.
amber_box = (
f'<rect x="1440" y="155" width="1360" height="510" '
f'fill="{AMBER}" fill-opacity="0.05" stroke="{AMBER}" stroke-width="3" rx="14" opacity="0.7"/>'
+ tx(2785, 182, "Optimal", 22, fill=AMBER, weight="bold", anchor="end")
)
g = ['<g id="dt">']
g.append(amber_box)
# Branch connectors
for src, dst, label, prob, pruned in branches:
p, c = nodes[src], nodes[dst]
path_d, mx = elbow(p["x"], p["y"], c["x"], c["y"])
if pruned:
g.append(
f'<path d="{path_d}" fill="none" stroke="{INK_MUTED}" '
f'stroke-width="2" opacity="0.45" stroke-dasharray="14,8"/>'
)
else:
g.append(f'<path d="{path_d}" fill="none" stroke="{GAIN_CLR}" stroke-width="4" opacity="0.9"/>')
vy = p["y"] + (c["y"] - p["y"]) * 0.45
lc, fw = (INK_MUTED, "normal") if pruned else (INK, "bold")
g.append(tx(mx - 16, vy, label, FS["branch"], fill=lc, weight=fw, anchor="end"))
if prob is not None:
pc = INK_MUTED if pruned else CHANCE_CLR
g.append(tx(mx + 16, vy, f"p = {prob}", FS["prob"], fill=pc, anchor="start", italic=True))
if pruned:
# X mark near top of vertical segment — avoids crowding with branch labels
sy = p["y"] + (c["y"] - p["y"]) * 0.10
g.append(
f'<line x1="{mx - 10}" y1="{sy - 9}" x2="{mx + 10}" y2="{sy + 9}" '
f'stroke="{LOSS_CLR}" stroke-width="3" opacity="0.7"/>'
)
g.append(
f'<line x1="{mx - 10}" y1="{sy + 9}" x2="{mx + 10}" y2="{sy - 9}" '
f'stroke="{LOSS_CLR}" stroke-width="3" opacity="0.7"/>'
)
# Nodes
for nd in nodes.values():
x, y, ntype = nd["x"], nd["y"], nd["type"]
if ntype == "decision":
g.append(
f'<rect x="{x - DEC_HALF}" y="{y - DEC_HALF}" width="{DEC_HALF * 2}" '
f'height="{DEC_HALF * 2}" fill="url(#g_d)" stroke="{PAGE_BG}" '
f'stroke-width="3" rx="8" filter="url(#sh)"/>'
)
g.append(tx(x, y - 6, "EMV", FS["emv_hdr"], fill="white", weight="bold"))
g.append(tx(x, y + 18, f"${nd['emv']}K", FS["emv_val"], fill="white", weight="bold"))
for i, line in enumerate(nd["label"].split("\n")):
g.append(tx(x, y + DEC_HALF + 30 + i * 28, line, FS["caption"], fill=DECISION_CLR, weight="bold"))
elif ntype == "chance":
g.append(
f'<circle cx="{x}" cy="{y}" r="{CHC_R}" fill="url(#g_c)" '
f'stroke="{PAGE_BG}" stroke-width="3" filter="url(#sh)"/>'
)
g.append(tx(x, y - 5, "EMV", FS["emv_hdr"] - 2, fill="white", weight="bold"))
g.append(tx(x, y + 16, f"${nd['emv']}K", FS["emv_val"] - 2, fill="white", weight="bold"))
for i, line in enumerate(nd["label"].split("\n")):
g.append(tx(x, y + CHC_R + 28 + i * 26, line, FS["caption"], fill=CHANCE_CLR, weight="bold"))
elif ntype == "terminal":
payoff = nd["payoff"]
fill = GAIN_CLR if payoff > 0 else (LOSS_CLR if payoff < 0 else INK_MUTED)
pts_str = f"{x - TRI},{y - TRI} {x - TRI},{y + TRI} {x + TRI},{y}"
g.append(f'<polygon points="{pts_str}" fill="{fill}" stroke="{PAGE_BG}" stroke-width="2" filter="url(#sh)"/>')
g.append(tx(x + TRI + 18, y + 9, fmt_k(payoff), FS["payoff"], fill=fill, weight="bold", anchor="start"))
g.append("</g>")
svg_out = base_svg.replace("</svg>", f"{defs}\n{chr(10).join(g)}\n</svg>")
with open(f"plot-{THEME}.svg", "w") as f:
f.write(svg_out)
cairosvg.svg2png(bytestring=svg_out.encode("utf-8"), write_to=f"plot-{THEME}.png")
html_content = (
"<!DOCTYPE html>\n<html>\n<head>\n"
f" <title>tree-decision · python · pygal · anyplot.ai</title>\n"
f" <style>\n"
f" body {{ margin: 0; padding: 20px; background: {PAGE_BG}; font-family: sans-serif; }}\n"
f" .container {{ max-width: 100%; margin: 0 auto; text-align: center; }}\n"
f" object {{ width: 100%; max-width: {W}px; height: auto; }}\n"
f" </style>\n</head>\n<body>\n"
' <div class="container">\n'
f' <object type="image/svg+xml" data="plot-{THEME}.svg">Decision tree</object>\n'
" </div>\n</body>\n</html>"
)
with open(f"plot-{THEME}.html", "w") as f:
f.write(html_content)
Runnable source as JSON, for any HTTP client: https://api.anyplot.ai/specs/tree-decision/pygal/code. Any spec id and library id listed in llms-full.txt fit the same URL shape; every URL below is complete and callable.
{
  "spec_id": "tree-decision",
  "language": "python",
  "library": "pygal",
  "page": "https://anyplot.ai/tree-decision/python/pygal",
  "hub": "https://anyplot.ai/tree-decision",
  "code_json": "https://api.anyplot.ai/specs/tree-decision/pygal/code",
  "spec_json": "https://api.anyplot.ai/specs/tree-decision",
  "render_light_png": "https://storage.googleapis.com/anyplot-images/plots/tree-decision/python/pygal/plot-light.png",
  "render_dark_png": "https://storage.googleapis.com/anyplot-images/plots/tree-decision/python/pygal/plot-dark.png",
  "interactive_light_html": "https://storage.googleapis.com/anyplot-images/plots/tree-decision/python/pygal/plot-light.html",
  "interactive_dark_html": "https://storage.googleapis.com/anyplot-images/plots/tree-decision/python/pygal/plot-dark.html",
  "quality_score": 87.0,
  "license": "MIT",
  "guide": "https://anyplot.ai/llms.txt"
}
Part of Decision Tree Visualization with Probabilities on anyplot.ai.